05四分位数を箱とひげで描くボックスプロット
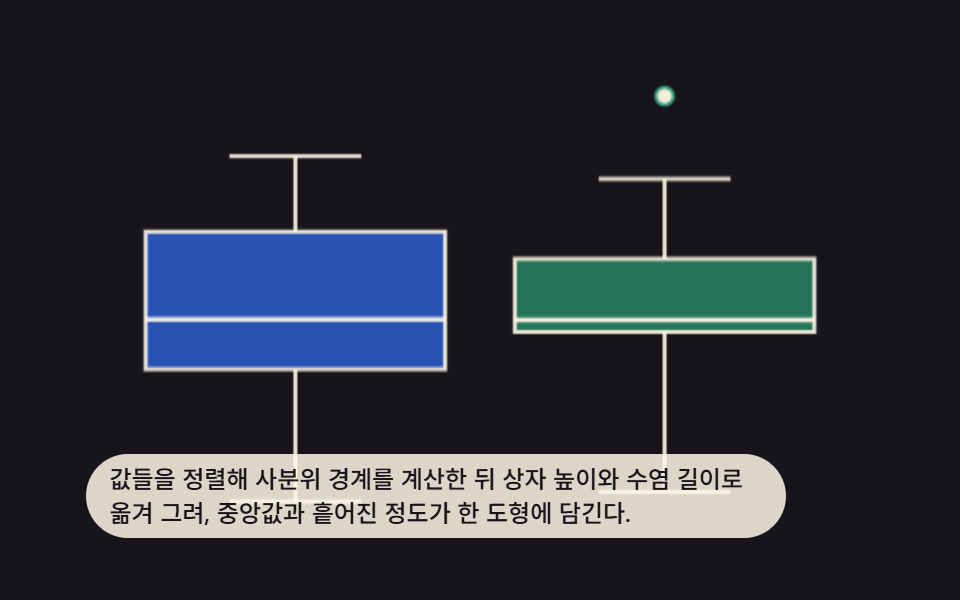
値を並べ替えて四分位の境界を計算し、箱の高さとひげの長さに変換して描くことで、中央値とばらつきが一つの図に収まる。
使いどころグループ別レスポンスタイム分布の比較
GROUP_A_1quartileslerpStats
<main class="stage">
<div class="bxw is-demo" id="bxwRoot">
  <canvas class="bxw__canvas" id="bxwCanvas" width="480" height="300"></canvas>
  <p class="bxw__caption">値を並び替えて四分位境界を計算し、箱の高さとひげの長さに置き換えて描くことで、中央値とばらつきの度合いが一つの図形に収まる。</p>
</div>
</main>
@use "../../../../site/static/demo-tokens" as *;
@include stage($stage-ink);
.bxw {
position: relative;
width: min(92vw, calc(160vh - 12.8vw));
aspect-ratio: 480 / 300;
margin: 0 auto;
border-radius: $r-card;
overflow: hidden;
box-shadow: $shadow-raised;
background: $stage-ink;
}
.bxw__canvas {
display: block;
width: 100%;
height: 100%;
}
.bxw__caption {
position: absolute;
left: $sp-3;
bottom: $sp-3;
max-width: 78%;
margin: 0;
padding: $sp-1 $sp-3;
border-radius: $r-pill;
background: rgba(255, 247, 230, .85);
color: $subject-ink;
font-weight: 500;
font-size: 12px;
line-height: 1.4;
pointer-events: none;
}
@media (max-width: 340px) {
.bxw__caption { font-size: 10px; padding: $sp-1 $sp-2; }
}
@media (prefers-reduced-motion: reduce) {
.bxw { cursor: default; }
}html, body {
margin: 0;
overflow: hidden;
}
.stage {
box-sizing: border-box;
min-height: 100vh;
display: grid;
place-items: center;
margin: 0;
background: #17141a;
font-family: -apple-system, "Segoe UI", "Noto Sans KR", sans-serif;
padding: clamp(8px, 4vw, 24px);
}
.bxw {
position: relative;
width: min(92vw, 160vh - 12.8vw);
aspect-ratio: 480/300;
margin: 0 auto;
border-radius: 16px;
overflow: hidden;
box-shadow: 0 14px 24px rgba(23, 20, 26, 0.32);
background: #17141a;
}
.bxw__canvas {
display: block;
width: 100%;
height: 100%;
}
.bxw__caption {
position: absolute;
left: 12px;
bottom: 12px;
max-width: 78%;
margin: 0;
padding: 4px 12px;
border-radius: 999px;
background: rgba(255, 247, 230, 0.85);
color: #17141a;
font-weight: 500;
font-size: 12px;
line-height: 1.4;
pointer-events: none;
}
@media (max-width: 340px) {
.bxw__caption {
font-size: 10px;
padding: 4px 8px;
}
}
@media (prefers-reduced-motion: reduce) {
.bxw {
cursor: default;
}
}(function () {
// 기법: 두 그룹 각각에 표본 집합을 두 벌씩 두고 사분위(최소·1사분위·중앙값·3사분위·최대)를
// 미리 계산해둔다. 매 프레임 삼각파(0→1→0)로 두 표본 집합의 사분위 값을 요소별로 보간해
// 그 프레임의 상자·수염 좌표를 다시 계산해서 그린다 — 정적인 두 장을 겹쳐 페이드하는 것이
// 아니라 통계값 자체가 시간에 따라 움직인다.
var root = document.getElementById('bxwRoot');
var canvas = document.getElementById('bxwCanvas');
var ctx = canvas.getContext('2d');
var wrap = canvas.parentElement;
function seedRand(seed) {
var s = seed >>> 0;
return function () { s = (s * 1664525 + 1013904223) >>> 0; return s / 4294967296; };
}
var CALC_W = 480, CALC_H = 300;
var LOOP_MS = 800;
var T0 = 200;
function clamp(v, a, b) { return Math.max(a, Math.min(b, v)); }
var rand = seedRand(425051);
function sample(n) {
var out = [];
for (var i = 0; i < n; i += 1) out.push(20 + rand() * 80);
return out;
}
var GROUP_A_1 = sample(9), GROUP_A_2 = sample(9);
var GROUP_B_1 = sample(9), GROUP_B_2 = sample(9);
function quartiles(arr) {
var s = arr.slice().sort(function (a, b) { return a - b; });
function pct(p) {
var idx = (s.length - 1) * p, lo = Math.floor(idx), hi = Math.ceil(idx);
return s[lo] + (s[hi] - s[lo]) * (idx - lo);
}
return { min: s[0], q1: pct(0.25), med: pct(0.5), q3: pct(0.75), max: s[s.length - 1] };
}
var qA1 = quartiles(GROUP_A_1), qA2 = quartiles(GROUP_A_2);
var qB1 = quartiles(GROUP_B_1), qB2 = quartiles(GROUP_B_2);
function lerp(x0, x1, f) { return x0 + (x1 - x0) * f; }
function lerpStats(s1, s2, f) {
return {
min: lerp(s1.min, s2.min, f),
q1: lerp(s1.q1, s2.q1, f),
med: lerp(s1.med, s2.med, f),
q3: lerp(s1.q3, s2.q3, f),
max: lerp(s1.max, s2.max, f)
};
}
var DOMAIN_MIN = 10, DOMAIN_MAX = 115;
var PLOT_TOP = 22, PLOT_BOTTOM = 292;
function valueToY(v) {
var f = (v - DOMAIN_MIN) / (DOMAIN_MAX - DOMAIN_MIN);
return PLOT_BOTTOM - f * (PLOT_BOTTOM - PLOT_TOP);
}
var BOX_FILL = ['47,109,246', '43,157,116'];
var CREAM_LINE = '255,247,230';
var BOX_WIDTH = 172;
var GROUP_X = [134, 346];
var OUTLIER_MULT = 1.2;
function drawBox(cx, stats, fillRgb, sx, sy, showOutlier) {
var yMin = valueToY(stats.min), yQ1 = valueToY(stats.q1);
var yMed = valueToY(stats.med), yQ3 = valueToY(stats.q3), yMax = valueToY(stats.max);
var xLeft = cx - BOX_WIDTH / 2;
var capHalf = BOX_WIDTH * 0.22;
ctx.strokeStyle = 'rgba(' + CREAM_LINE + ',.9)';
ctx.lineWidth = 2;
ctx.beginPath();
ctx.moveTo(cx * sx, yMax * sy); ctx.lineTo(cx * sx, yQ3 * sy); ctx.stroke();
ctx.beginPath();
ctx.moveTo(cx * sx, yQ1 * sy); ctx.lineTo(cx * sx, yMin * sy); ctx.stroke();
ctx.beginPath();
ctx.moveTo((cx - capHalf) * sx, yMax * sy); ctx.lineTo((cx + capHalf) * sx, yMax * sy); ctx.stroke();
ctx.beginPath();
ctx.moveTo((cx - capHalf) * sx, yMin * sy); ctx.lineTo((cx + capHalf) * sx, yMin * sy); ctx.stroke();
ctx.fillStyle = 'rgba(' + fillRgb + ',.7)';
ctx.fillRect(xLeft * sx, yQ3 * sy, BOX_WIDTH * sx, (yQ1 - yQ3) * sy);
ctx.strokeStyle = 'rgba(' + CREAM_LINE + ',.9)';
ctx.strokeRect(xLeft * sx, yQ3 * sy, BOX_WIDTH * sx, (yQ1 - yQ3) * sy);
ctx.beginPath();
ctx.moveTo(xLeft * sx, yMed * sy);
ctx.lineTo((xLeft + BOX_WIDTH) * sx, yMed * sy);
ctx.lineWidth = 2.4;
ctx.stroke();
if (showOutlier) {
var yOut = valueToY(stats.max * OUTLIER_MULT);
ctx.beginPath();
ctx.fillStyle = 'rgba(' + CREAM_LINE + ',.95)';
ctx.arc(cx * sx, yOut * sy, 4.4, 0, Math.PI * 2);
ctx.fill();
ctx.strokeStyle = 'rgba(' + fillRgb + ',.95)';
ctx.lineWidth = 1.6;
ctx.stroke();
}
}
var cw = 480, ch = 300;
function draw(phase) {
var sx = cw / CALC_W, sy = ch / CALC_H;
ctx.clearRect(0, 0, cw, ch);
var t = Math.max(0, phase - T0);
var half = (LOOP_MS - T0) / 2;
var blend = t < half ? t / half : 2 - t / half;
blend = clamp(blend, 0, 1);
var statsA = lerpStats(qA1, qA2, blend);
var statsB = lerpStats(qB1, qB2, blend);
drawBox(GROUP_X[0], statsA, BOX_FILL[0], sx, sy, blend > 0.62);
drawBox(GROUP_X[1], statsB, BOX_FILL[1], sx, sy, blend < 0.38);
}
var reduce = window.matchMedia('(prefers-reduced-motion: reduce)').matches;
var elapsed = 0;
if (reduce) root.classList.remove('is-demo');
function phaseOf(ms) { return reduce ? LOOP_MS * 0.5 : (ms % LOOP_MS); }
function fit() {
var r = wrap.getBoundingClientRect();
cw = Math.max(1, Math.round(r.width));
ch = Math.max(1, Math.round(r.height));
canvas.width = cw; canvas.height = ch;
draw(phaseOf(elapsed));
}
var lastTs = null;
function tick(ts) {
if (lastTs === null) lastTs = ts;
var dt = Math.min(ts - lastTs, 48);
lastTs = ts;
if (!reduce) elapsed += dt;
draw(phaseOf(elapsed));
requestAnimationFrame(tick);
}
fit();
window.addEventListener('resize', fit);
draw(phaseOf(elapsed));
requestAnimationFrame(tick);
})();import { useEffect, useRef } from "react";
import styles from "./ChartAdvancedBoxplotQuartileWhisker.module.scss";
type Stats = { min: number; q1: number; med: number; q3: number; max: number };
export default function ChartAdvancedBoxplotQuartileWhisker() {
const rootRef = useRef<HTMLDivElement>(null);
const canvasRef = useRef<HTMLCanvasElement>(null);
useEffect(() => {
const root = rootRef.current;
const canvas = canvasRef.current;
if (!root || !canvas) return;
const ctx = canvas.getContext("2d");
if (!ctx) return;
const wrap = canvas.parentElement as HTMLElement;
function seedRand(seed: number) {
let s = seed >>> 0;
return function () { s = (s * 1664525 + 1013904223) >>> 0; return s / 4294967296; };
}
const CALC_W = 480, CALC_H = 300;
const LOOP_MS = 800;
const T0 = 200;
function clamp(v: number, a: number, b: number) { return Math.max(a, Math.min(b, v)); }
const rand = seedRand(425051);
function sample(n: number) {
const out: number[] = [];
for (let i = 0; i < n; i += 1) out.push(20 + rand() * 80);
return out;
}
const GROUP_A_1 = sample(9), GROUP_A_2 = sample(9);
const GROUP_B_1 = sample(9), GROUP_B_2 = sample(9);
function quartiles(arr: number[]): Stats {
const s = arr.slice().sort(function (a, b) { return a - b; });
function pct(p: number) {
const idx = (s.length - 1) * p, lo = Math.floor(idx), hi = Math.ceil(idx);
return s[lo] + (s[hi] - s[lo]) * (idx - lo);
}
return { min: s[0], q1: pct(0.25), med: pct(0.5), q3: pct(0.75), max: s[s.length - 1] };
}
const qA1 = quartiles(GROUP_A_1), qA2 = quartiles(GROUP_A_2);
const qB1 = quartiles(GROUP_B_1), qB2 = quartiles(GROUP_B_2);
function lerp(x0: number, x1: number, f: number) { return x0 + (x1 - x0) * f; }
function lerpStats(s1: Stats, s2: Stats, f: number): Stats {
return {
min: lerp(s1.min, s2.min, f),
q1: lerp(s1.q1, s2.q1, f),
med: lerp(s1.med, s2.med, f),
q3: lerp(s1.q3, s2.q3, f),
max: lerp(s1.max, s2.max, f)
};
}
const DOMAIN_MIN = 10, DOMAIN_MAX = 115;
const PLOT_TOP = 22, PLOT_BOTTOM = 292;
function valueToY(v: number) {
const f = (v - DOMAIN_MIN) / (DOMAIN_MAX - DOMAIN_MIN);
return PLOT_BOTTOM - f * (PLOT_BOTTOM - PLOT_TOP);
}
const BOX_FILL = ["47,109,246", "43,157,116"];
const CREAM_LINE = "255,247,230";
const BOX_WIDTH = 172;
const GROUP_X = [134, 346];
const OUTLIER_MULT = 1.2;
let cw = 480, ch = 300;
function drawBox(cx: number, stats: Stats, fillRgb: string, sx: number, sy: number, showOutlier: boolean) {
const yMin = valueToY(stats.min), yQ1 = valueToY(stats.q1);
const yMed = valueToY(stats.med), yQ3 = valueToY(stats.q3), yMax = valueToY(stats.max);
const xLeft = cx - BOX_WIDTH / 2;
const capHalf = BOX_WIDTH * 0.22;
ctx!.strokeStyle = "rgba(" + CREAM_LINE + ",.9)";
ctx!.lineWidth = 2;
ctx!.beginPath();
ctx!.moveTo(cx * sx, yMax * sy); ctx!.lineTo(cx * sx, yQ3 * sy); ctx!.stroke();
ctx!.beginPath();
ctx!.moveTo(cx * sx, yQ1 * sy); ctx!.lineTo(cx * sx, yMin * sy); ctx!.stroke();
ctx!.beginPath();
ctx!.moveTo((cx - capHalf) * sx, yMax * sy); ctx!.lineTo((cx + capHalf) * sx, yMax * sy); ctx!.stroke();
ctx!.beginPath();
ctx!.moveTo((cx - capHalf) * sx, yMin * sy); ctx!.lineTo((cx + capHalf) * sx, yMin * sy); ctx!.stroke();
ctx!.fillStyle = "rgba(" + fillRgb + ",.7)";
ctx!.fillRect(xLeft * sx, yQ3 * sy, BOX_WIDTH * sx, (yQ1 - yQ3) * sy);
ctx!.strokeStyle = "rgba(" + CREAM_LINE + ",.9)";
ctx!.strokeRect(xLeft * sx, yQ3 * sy, BOX_WIDTH * sx, (yQ1 - yQ3) * sy);
ctx!.beginPath();
ctx!.moveTo(xLeft * sx, yMed * sy);
ctx!.lineTo((xLeft + BOX_WIDTH) * sx, yMed * sy);
ctx!.lineWidth = 2.4;
ctx!.stroke();
if (showOutlier) {
const yOut = valueToY(stats.max * OUTLIER_MULT);
ctx!.beginPath();
ctx!.fillStyle = "rgba(" + CREAM_LINE + ",.95)";
ctx!.arc(cx * sx, yOut * sy, 4.4, 0, Math.PI * 2);
ctx!.fill();
ctx!.strokeStyle = "rgba(" + fillRgb + ",.95)";
ctx!.lineWidth = 1.6;
ctx!.stroke();
}
}
function draw(phase: number) {
const sx = cw / CALC_W, sy = ch / CALC_H;
ctx!.clearRect(0, 0, cw, ch);
const t = Math.max(0, phase - T0);
const half = (LOOP_MS - T0) / 2;
let blend = t < half ? t / half : 2 - t / half;
blend = clamp(blend, 0, 1);
const statsA = lerpStats(qA1, qA2, blend);
const statsB = lerpStats(qB1, qB2, blend);
drawBox(GROUP_X[0], statsA, BOX_FILL[0], sx, sy, blend > 0.62);
drawBox(GROUP_X[1], statsB, BOX_FILL[1], sx, sy, blend < 0.38);
}
const reduce = window.matchMedia("(prefers-reduced-motion: reduce)").matches;
let elapsed = 0;
if (reduce) root.classList.remove("is-demo");
function phaseOf(ms: number) { return reduce ? LOOP_MS * 0.5 : (ms % LOOP_MS); }
function fit() {
const r = wrap.getBoundingClientRect();
cw = Math.max(1, Math.round(r.width));
ch = Math.max(1, Math.round(r.height));
canvas!.width = cw; canvas!.height = ch;
draw(phaseOf(elapsed));
}
let lastTs: number | null = null;
let raf = 0;
function tick(ts: number) {
if (lastTs === null) lastTs = ts;
const dt = Math.min(ts - lastTs, 48);
lastTs = ts;
if (!reduce) elapsed += dt;
draw(phaseOf(elapsed));
raf = requestAnimationFrame(tick);
}
fit();
window.addEventListener("resize", fit);
draw(phaseOf(elapsed));
raf = requestAnimationFrame(tick);
return () => {
cancelAnimationFrame(raf);
window.removeEventListener("resize", fit);
};
}, []);
return (
<main className={styles.stage}>
<div className={`${styles.bxw} is-demo`} ref={rootRef}>
<canvas className={styles.bxw__canvas} ref={canvasRef} width={480} height={300} />
<p className={styles.bxw__caption}>값들을 정렬해 사분위 경계를 계산한 뒤 상자 높이와 수염 길이로 옮겨 그려, 중앙값과 흩어진 정도가 한 도형에 담긴다.</p>
</div>
</main>
);
}05 四分位数を箱とひげで描くボックスプロット — 計測 累積面積 12.065% · 動いたフレーム 20/23GODRICH オリジナル · SCSS と React は zip に同梱 · グラフ 種類 9選 — 計算で描くデータ可視化チャート
このデモが属する記事
 グラフ 種類 9選 — 計算で描くデータ可視化チャートグラフ 種類を実際の計算式だけで描き分けたセットです。九種類のうち三つはリボンのように流れ、三つは棒で途切れ、二つは円にまとまり、一つは漏斗状に狭まる。 この記事のデモをすべて見る