04Bubble-Pack Chart Where Circles Push Apart by Value Size
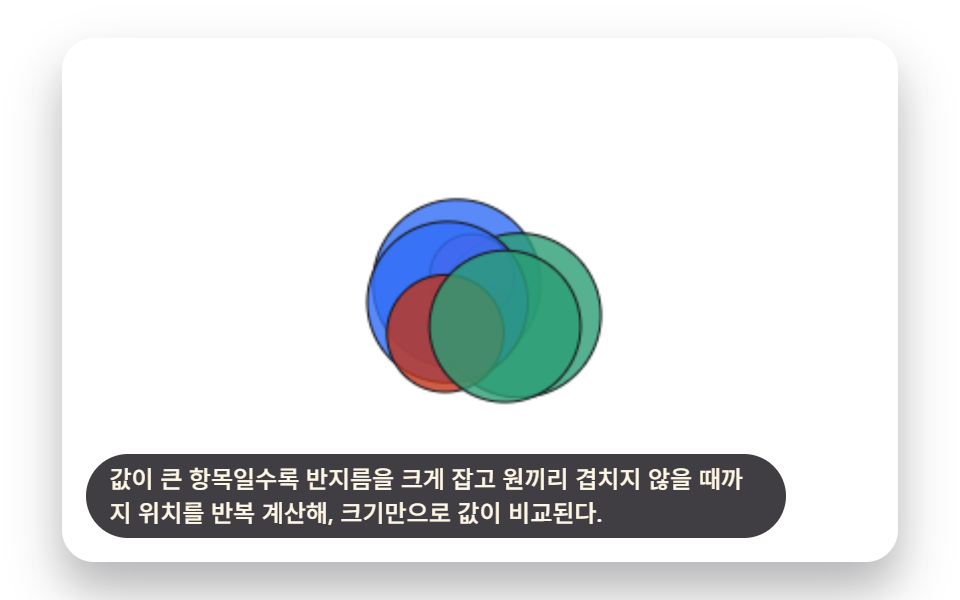
Bigger values get a bigger radius, and positions are recalculated repeatedly until no two circles overlap, so size alone compares the values.
Best forCategory revenue-share comparison card
BUBBLE_PACK_COLLISION_ITERATIONSsnapshotsradii
<main class="stage">
<div class="bpk is-demo" id="bpkRoot">
  <canvas class="bpk__canvas" id="bpkCanvas" width="480" height="300"></canvas>
  <p class="bpk__caption">The larger the value, the bigger the radius it gets, and positions are recalculated repeatedly until no circles overlap, so size alone lets you compare values.</p>
</div>
</main>
@use "../../../../site/static/demo-tokens" as *;
@include stage($stage-paper);
.bpk {
position: relative;
width: min(92vw, calc(160vh - 12.8vw));
aspect-ratio: 480 / 300;
margin: 0 auto;
border-radius: $r-card;
overflow: hidden;
box-shadow: $shadow-raised;
background: $stage-paper;
}
.bpk__canvas {
display: block;
width: 100%;
height: 100%;
}
.bpk__caption {
position: absolute;
left: $sp-3;
bottom: $sp-3;
max-width: 78%;
margin: 0;
padding: $sp-1 $sp-3;
border-radius: $r-pill;
background: rgba(23, 20, 26, .82);
color: $subject-cream;
font-weight: 500;
font-size: 12px;
line-height: 1.4;
pointer-events: none;
}
@media (max-width: 340px) {
.bpk__caption { font-size: 10px; padding: $sp-1 $sp-2; }
}
@media (prefers-reduced-motion: reduce) {
.bpk { cursor: default; }
}html, body {
margin: 0;
overflow: hidden;
}
.stage {
box-sizing: border-box;
min-height: 100vh;
display: grid;
place-items: center;
margin: 0;
background: #ffffff;
font-family: -apple-system, "Segoe UI", "Noto Sans KR", sans-serif;
padding: clamp(8px, 4vw, 24px);
}
.bpk {
position: relative;
width: min(92vw, 160vh - 12.8vw);
aspect-ratio: 480/300;
margin: 0 auto;
border-radius: 16px;
overflow: hidden;
box-shadow: 0 14px 24px rgba(23, 20, 26, 0.32);
background: #ffffff;
}
.bpk__canvas {
display: block;
width: 100%;
height: 100%;
}
.bpk__caption {
position: absolute;
left: 12px;
bottom: 12px;
max-width: 78%;
margin: 0;
padding: 4px 12px;
border-radius: 999px;
background: rgba(23, 20, 26, 0.82);
color: #fff7e6;
font-weight: 500;
font-size: 12px;
line-height: 1.4;
pointer-events: none;
}
@media (max-width: 340px) {
.bpk__caption {
font-size: 10px;
padding: 4px 8px;
}
}
@media (prefers-reduced-motion: reduce) {
.bpk {
cursor: default;
}
}(function () {
// 기법: 값마다 반지름을 정한 뒤 겹치는 원 쌍을 찾아 겹친 만큼 절반씩 밀어내는 완화
// (relaxation) 을 정해진 횟수만큼 반복한다. 매 반복 뒤의 좌표를 스냅샷으로 저장해두고,
// 재생 시점에는 그 스냅샷 사이를 시간에 따라 보간해서 그린다 — 물리 엔진 없이 배열
// 하나로 원들이 서서히 자리를 잡아 벌어지는 과정을 재현한다.
var root = document.getElementById('bpkRoot');
var canvas = document.getElementById('bpkCanvas');
var ctx = canvas.getContext('2d');
var wrap = canvas.parentElement;
function seedRand(seed) {
var s = seed >>> 0;
return function () { s = (s * 1664525 + 1013904223) >>> 0; return s / 4294967296; };
}
var CALC_W = 480, CALC_H = 300;
var LOOP_MS = 2000;
var T0 = 200;
var COUNT = 7;
var K = 3.1;
var BUBBLE_PACK_COLLISION_ITERATIONS = 30;
function buildPack(seed) {
var pr = seedRand(seed);
var values = [];
for (var vi = 0; vi < COUNT; vi += 1) values.push(30 + pr() * 220);
var radii = values.map(function (v) { return Math.sqrt(v) * K; });
var packCenterX = CALC_W * 0.5;
var packCenterY = CALC_H * 0.5;
var initialPositions = [];
for (var pi = 0; pi < COUNT; pi += 1) {
initialPositions.push({
x: packCenterX + (pr() - 0.5) * 46,
y: packCenterY + (pr() - 0.5) * 46
});
}
var snapshots = [initialPositions.map(function (p) { return { x: p.x, y: p.y }; })];
var relaxed = initialPositions.map(function (p) { return { x: p.x, y: p.y }; });
for (var iter = 0; iter < BUBBLE_PACK_COLLISION_ITERATIONS; iter += 1) {
for (var a = 0; a < COUNT; a += 1) {
for (var b = a + 1; b < COUNT; b += 1) {
var pa = relaxed[a], pb = relaxed[b];
var dx = pb.x - pa.x, dy = pb.y - pa.y;
var dist = Math.sqrt(dx * dx + dy * dy);
var minDist = radii[a] + radii[b];
if (dist < minDist) {
if (dist < 0.001) {
var ang = ((a * 37 + b * 53 + seed) % 360) * Math.PI / 180;
dx = Math.cos(ang); dy = Math.sin(ang); dist = 0.001;
}
var overlap = minDist - dist;
var nx = dx / dist, ny = dy / dist;
var push = overlap * 0.5;
pa.x -= nx * push; pa.y -= ny * push;
pb.x += nx * push; pb.y += ny * push;
}
}
}
for (var c = 0; c < COUNT; c += 1) {
var pc = relaxed[c], rc = radii[c];
pc.x = Math.max(rc, Math.min(CALC_W - rc, pc.x));
pc.y = Math.max(rc, Math.min(CALC_H - rc, pc.y));
}
snapshots.push(relaxed.map(function (p) { return { x: p.x, y: p.y }; }));
}
return { radii: radii, snapshots: snapshots };
}
// 값 리셔플 2회: 세 팩을 시연 구간에 나눠 배치해, 완화가 한 번에 끝나지 않고
// 시연 내내 진행되다가 경계마다 다시 밀어내는 과정을 두 번 더 보여준다.
var PACKS = [buildPack(425041), buildPack(425042), buildPack(425043)];
var FILL_COLORS = ['47,109,246', '194,54,26', '43,157,116', '138,92,214'];
var INK_STROKE = '23,20,26';
function lerp(x0, x1, f) { return x0 + (x1 - x0) * f; }
var cw = 480, ch = 300;
function draw(t) {
var sx = cw / CALC_W, sy = ch / CALC_H;
ctx.clearRect(0, 0, cw, ch);
var et = Math.max(0, t - T0);
var seg = (LOOP_MS - T0) / PACKS.length;
var segIdx = Math.min(PACKS.length - 1, Math.floor(et / seg));
var localT = et - segIdx * seg;
var unit = Math.max(0, Math.min(1, localT / seg));
var tri = unit < 0.5 ? unit * 2 : 2 - unit * 2;
// 완화 초반(적은 반복)이 위치 변화가 크고 후반은 변화가 작아, 시간을 선형으로 매핑하면
// 뒤쪽 프레임이 정지해 보인다 — frac 을 볼록(위로 가속)하게 눌러 반복 인덱스가
// 초반엔 느리게(그래도 위치는 크게 바뀜), 후반엔 빠르게 지나가 프레임마다 변화가 이어진다.
var frac = Math.pow(tri, 3.6);
var iterFrac = frac * BUBBLE_PACK_COLLISION_ITERATIONS;
var lo = Math.floor(iterFrac);
var hi = Math.min(lo + 1, BUBBLE_PACK_COLLISION_ITERATIONS);
var f2 = iterFrac - lo;
var pack = PACKS[segIdx];
var snapLo = pack.snapshots[lo], snapHi = pack.snapshots[hi];
var radii = pack.radii;
for (var i = 0; i < COUNT; i += 1) {
var px = lerp(snapLo[i].x, snapHi[i].x, f2);
var py = lerp(snapLo[i].y, snapHi[i].y, f2);
var dx = px * sx, dy = py * sy, dr = radii[i] * ((sx + sy) / 2);
ctx.beginPath();
ctx.fillStyle = 'rgba(' + FILL_COLORS[i % 4] + ',0.8)';
ctx.strokeStyle = 'rgba(' + INK_STROKE + ',1)';
ctx.lineWidth = 1;
ctx.arc(dx, dy, dr, 0, Math.PI * 2);
ctx.fill();
ctx.stroke();
}
}
var reduce = window.matchMedia('(prefers-reduced-motion: reduce)').matches;
var elapsed = 0;
if (reduce) root.classList.remove('is-demo');
function phaseOf(ms) { return reduce ? LOOP_MS * 0.72 : (ms % LOOP_MS); }
function fit() {
var r = wrap.getBoundingClientRect();
cw = Math.max(1, Math.round(r.width));
ch = Math.max(1, Math.round(r.height));
canvas.width = cw; canvas.height = ch;
draw(phaseOf(elapsed));
}
var lastTs = null;
function tick(ts) {
if (lastTs === null) lastTs = ts;
var dt = Math.min(ts - lastTs, 48);
lastTs = ts;
if (!reduce) elapsed += dt;
draw(phaseOf(elapsed));
requestAnimationFrame(tick);
}
fit();
window.addEventListener('resize', fit);
draw(phaseOf(elapsed));
requestAnimationFrame(tick);
})();import { useEffect, useRef } from "react";
import styles from "./ChartAdvancedBubblePackCollision.module.scss";
type Pos = { x: number; y: number };
export default function ChartAdvancedBubblePackCollision() {
const rootRef = useRef<HTMLDivElement>(null);
const canvasRef = useRef<HTMLCanvasElement>(null);
useEffect(() => {
const root = rootRef.current;
const canvas = canvasRef.current;
if (!root || !canvas) return;
const ctx = canvas.getContext("2d");
if (!ctx) return;
const wrap = canvas.parentElement as HTMLElement;
function seedRand(seed: number) {
let s = seed >>> 0;
return function () { s = (s * 1664525 + 1013904223) >>> 0; return s / 4294967296; };
}
const CALC_W = 480, CALC_H = 300;
const LOOP_MS = 2000;
const T0 = 200;
const COUNT = 7;
const K = 3.1;
const BUBBLE_PACK_COLLISION_ITERATIONS = 30;
function buildPack(seed: number) {
const pr = seedRand(seed);
const values: number[] = [];
for (let vi = 0; vi < COUNT; vi += 1) values.push(30 + pr() * 220);
const radii = values.map(function (v) { return Math.sqrt(v) * K; });
const packCenterX = CALC_W * 0.5;
const packCenterY = CALC_H * 0.5;
const initialPositions: Pos[] = [];
for (let pi = 0; pi < COUNT; pi += 1) {
initialPositions.push({
x: packCenterX + (pr() - 0.5) * 46,
y: packCenterY + (pr() - 0.5) * 46
});
}
const snapshots: Pos[][] = [initialPositions.map(function (p) { return { x: p.x, y: p.y }; })];
const relaxed: Pos[] = initialPositions.map(function (p) { return { x: p.x, y: p.y }; });
for (let iter = 0; iter < BUBBLE_PACK_COLLISION_ITERATIONS; iter += 1) {
for (let a = 0; a < COUNT; a += 1) {
for (let b = a + 1; b < COUNT; b += 1) {
const pa = relaxed[a], pb = relaxed[b];
let dx = pb.x - pa.x, dy = pb.y - pa.y;
let dist = Math.sqrt(dx * dx + dy * dy);
const minDist = radii[a] + radii[b];
if (dist < minDist) {
if (dist < 0.001) {
const ang = ((a * 37 + b * 53 + seed) % 360) * Math.PI / 180;
dx = Math.cos(ang); dy = Math.sin(ang); dist = 0.001;
}
const overlap = minDist - dist;
const nx = dx / dist, ny = dy / dist;
const push = overlap * 0.5;
pa.x -= nx * push; pa.y -= ny * push;
pb.x += nx * push; pb.y += ny * push;
}
}
}
for (let c = 0; c < COUNT; c += 1) {
const pc = relaxed[c], rc = radii[c];
pc.x = Math.max(rc, Math.min(CALC_W - rc, pc.x));
pc.y = Math.max(rc, Math.min(CALC_H - rc, pc.y));
}
snapshots.push(relaxed.map(function (p) { return { x: p.x, y: p.y }; }));
}
return { radii, snapshots };
}
// 값 리셔플 2회: 세 팩을 시연 구간에 나눠 배치해, 완화가 한 번에 끝나지 않고
// 시연 내내 진행되다가 경계마다 다시 밀어내는 과정을 두 번 더 보여준다.
const PACKS = [buildPack(425041), buildPack(425042), buildPack(425043)];
const FILL_COLORS = ["47,109,246", "194,54,26", "43,157,116", "138,92,214"];
const INK_STROKE = "23,20,26";
function lerp(x0: number, x1: number, f: number) { return x0 + (x1 - x0) * f; }
let cw = 480, ch = 300;
function draw(t: number) {
const sx = cw / CALC_W, sy = ch / CALC_H;
ctx!.clearRect(0, 0, cw, ch);
const et = Math.max(0, t - T0);
const seg = (LOOP_MS - T0) / PACKS.length;
const segIdx = Math.min(PACKS.length - 1, Math.floor(et / seg));
const localT = et - segIdx * seg;
const unit = Math.max(0, Math.min(1, localT / seg));
const tri = unit < 0.5 ? unit * 2 : 2 - unit * 2;
// 완화 초반(적은 반복)이 위치 변화가 크고 후반은 변화가 작아, 시간을 선형으로 매핑하면
// 뒤쪽 프레임이 정지해 보인다 — frac 을 볼록(위로 가속)하게 눌러 반복 인덱스가
// 초반엔 느리게(그래도 위치는 크게 바뀜), 후반엔 빠르게 지나가 프레임마다 변화가 이어진다.
const frac = Math.pow(tri, 3.6);
const iterFrac = frac * BUBBLE_PACK_COLLISION_ITERATIONS;
const lo = Math.floor(iterFrac);
const hi = Math.min(lo + 1, BUBBLE_PACK_COLLISION_ITERATIONS);
const f2 = iterFrac - lo;
const pack = PACKS[segIdx];
const snapLo = pack.snapshots[lo], snapHi = pack.snapshots[hi];
const radii = pack.radii;
for (let i = 0; i < COUNT; i += 1) {
const px = lerp(snapLo[i].x, snapHi[i].x, f2);
const py = lerp(snapLo[i].y, snapHi[i].y, f2);
const dx = px * sx, dy = py * sy, dr = radii[i] * ((sx + sy) / 2);
ctx!.beginPath();
ctx!.fillStyle = "rgba(" + FILL_COLORS[i % 4] + ",0.8)";
ctx!.strokeStyle = "rgba(" + INK_STROKE + ",1)";
ctx!.lineWidth = 1;
ctx!.arc(dx, dy, dr, 0, Math.PI * 2);
ctx!.fill();
ctx!.stroke();
}
}
const reduce = window.matchMedia("(prefers-reduced-motion: reduce)").matches;
let elapsed = 0;
if (reduce) root.classList.remove("is-demo");
function phaseOf(ms: number) { return reduce ? LOOP_MS * 0.72 : (ms % LOOP_MS); }
function fit() {
const r = wrap.getBoundingClientRect();
cw = Math.max(1, Math.round(r.width));
ch = Math.max(1, Math.round(r.height));
canvas!.width = cw; canvas!.height = ch;
draw(phaseOf(elapsed));
}
let lastTs: number | null = null;
let raf = 0;
function tick(ts: number) {
if (lastTs === null) lastTs = ts;
const dt = Math.min(ts - lastTs, 48);
lastTs = ts;
if (!reduce) elapsed += dt;
draw(phaseOf(elapsed));
raf = requestAnimationFrame(tick);
}
fit();
window.addEventListener("resize", fit);
draw(phaseOf(elapsed));
raf = requestAnimationFrame(tick);
return () => {
cancelAnimationFrame(raf);
window.removeEventListener("resize", fit);
};
}, []);
return (
<main className={styles.stage}>
<div className={`${styles.bpk} is-demo`} ref={rootRef}>
<canvas className={styles.bpk__canvas} ref={canvasRef} width={480} height={300} />
<p className={styles.bpk__caption}>값이 큰 항목일수록 반지름을 크게 잡고 원끼리 겹치지 않을 때까지 위치를 반복 계산해, 크기만으로 값이 비교된다.</p>
</div>
</main>
);
}04 Bubble-Pack Chart Where Circles Push Apart by Value Size — Measured area 25.791% · moving frames 18/23Original by GODRICH · SCSS and React ship in the zip · 9 Data Visualization Chart Types With Real Math
The post this demo lives in
 9 Data Visualization Chart Types With Real MathA data visualization chart types set built from real math, not screenshots. Three of the nine flow like ribbons, three b See all demos in this post
If you like this effect - similar demos
 Dashboard UI05 A Pie Chart With Leader-Line Labels That Push Apart When They OverlapPie Chart CSS: 9 Slices That Pop, Tilt and Morph
 Dashboard UI06 Word Bubbles That Push Into PlaceWord Cloud JavaScript: 9 Scenes, Spiral to 3D
 Dashboard UI04 A month bar splits into days where it standsChart UI Design: 9 Interactions You Can Drag