08Bump Chart Where Lines Cross as Rankings Change
Values are re-ranked at every period and turned into a vertical coordinate, so lines cross exactly where two items swap places.
Best forQuarterly product-ranking change chart
ranksOfPERIOD_COUNTSEG_DUR
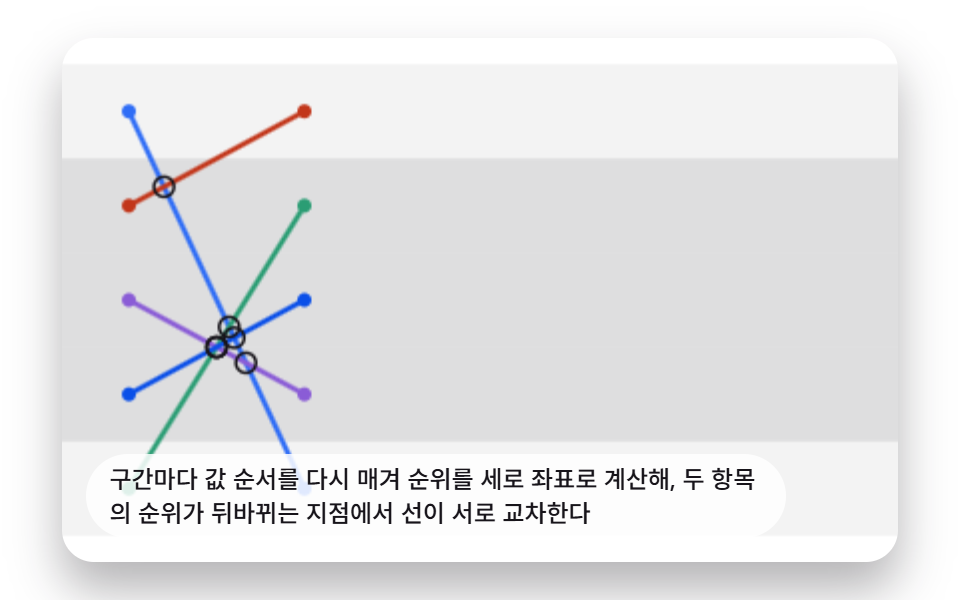
<main class="stage">
<div class="bmp is-demo" id="bmpRoot">
  <canvas class="bmp__canvas" id="bmpCanvas" width="480" height="300"></canvas>
  <p class="bmp__caption">Values are re-ranked at every period and the rank is used as the vertical coordinate, so wherever two items swap places the lines cross each other</p>
</div>
</main>
@use "../../../../site/static/demo-tokens" as *;
@include stage($stage-paper);
.bmp {
position: relative;
width: min(92vw, calc(160vh - 12.8vw));
aspect-ratio: 480 / 300;
margin: 0 auto;
border-radius: $r-card;
overflow: hidden;
box-shadow: $shadow-raised;
background: $stage-paper;
}
.bmp__canvas {
display: block;
width: 100%;
height: 100%;
}
.bmp__caption {
position: absolute;
left: $sp-3;
bottom: $sp-3;
max-width: 78%;
margin: 0;
padding: $sp-1 $sp-3;
border-radius: $r-pill;
background: rgba(255, 255, 255, .85);
color: $subject-ink;
font-weight: 500;
font-size: 12px;
line-height: 1.4;
pointer-events: none;
}
@media (max-width: 340px) {
.bmp__caption { font-size: 10px; padding: $sp-1 $sp-2; }
}
@media (prefers-reduced-motion: reduce) {
.bmp { cursor: default; }
}html, body {
margin: 0;
overflow: hidden;
}
.stage {
box-sizing: border-box;
min-height: 100vh;
display: grid;
place-items: center;
margin: 0;
background: #ffffff;
font-family: -apple-system, "Segoe UI", "Noto Sans KR", sans-serif;
padding: clamp(8px, 4vw, 24px);
}
.bmp {
position: relative;
width: min(92vw, 160vh - 12.8vw);
aspect-ratio: 480/300;
margin: 0 auto;
border-radius: 16px;
overflow: hidden;
box-shadow: 0 14px 24px rgba(23, 20, 26, 0.32);
background: #ffffff;
}
.bmp__canvas {
display: block;
width: 100%;
height: 100%;
}
.bmp__caption {
position: absolute;
left: 12px;
bottom: 12px;
max-width: 78%;
margin: 0;
padding: 4px 12px;
border-radius: 999px;
background: rgba(255, 255, 255, 0.85);
color: #17141a;
font-weight: 500;
font-size: 12px;
line-height: 1.4;
pointer-events: none;
}
@media (max-width: 340px) {
.bmp__caption {
font-size: 10px;
padding: 4px 8px;
}
}
@media (prefers-reduced-motion: reduce) {
.bmp {
cursor: default;
}
}(function () {
// 기법: 기간마다 값을 다시 정렬해 순위(등수)를 매기고, 그 순위를 세로 좌표로 써서 항목별
// 꺾은선을 그린다. 두 항목의 순위가 인접 구간에서 뒤바뀌면 두 직선이 그 구간 안에서
// 반드시 교차하므로, 교차점을 대수적으로 계산해 순간적으로 강조한다. 왼쪽 구간부터
// 순서대로 공개(reveal)해 시간이 흐르며 그려지는 것처럼 보이게 한다.
var root = document.getElementById('bmpRoot');
var canvas = document.getElementById('bmpCanvas');
var ctx = canvas.getContext('2d');
var wrap = canvas.parentElement;
function seedRand(seed) {
var s = seed >>> 0;
return function () { s = (s * 1664525 + 1013904223) >>> 0; return s / 4294967296; };
}
var rand = seedRand(425081);
var ITEM_COUNT = 5, PERIOD_COUNT = 5;
var VALUES = [];
for (var p = 0; p < PERIOD_COUNT; p += 1) {
var row = [];
for (var i = 0; i < ITEM_COUNT; i += 1) row.push(10 + rand() * 90);
VALUES.push(row);
}
function ranksOf(row) {
var idx = row.map(function (v, i) { return i; });
idx.sort(function (a, b) { return row[b] - row[a]; });
var rank = new Array(row.length);
idx.forEach(function (itemI, pos) { rank[itemI] = pos; });
return rank;
}
var RANKS = VALUES.map(ranksOf);
var LINE_COLORS = ['#2f6df6', '#c2361a', '#2b9d74', '#8a5cd6', '#0a4fe8'];
var LOOP_MS = 2000;
var T0 = 200;
var SEG_MS = 300;
var SEG_DUR = 260;
var SEG_COUNT = PERIOD_COUNT - 1;
var cw = 480, ch = 300;
function clamp(v, lo, hi) { return Math.max(lo, Math.min(hi, v)); }
function periodX(p) {
var padX = cw * 0.08;
return padX + (cw - padX * 2) * (p / (PERIOD_COUNT - 1));
}
function rankY(r) {
var padY = ch * 0.14;
return padY + (ch - padY * 2) * (r / (ITEM_COUNT - 1));
}
function render(elapsedMs) {
var t = elapsedMs % LOOP_MS;
ctx.clearRect(0, 0, cw, ch);
var fadeAlpha = 1;
if (t >= 1750) fadeAlpha = clamp(1 - (t - 1750) / 200, 0, 1);
ctx.globalAlpha = fadeAlpha;
var rowH = (ch - ch * 0.28) / (ITEM_COUNT - 1);
var crossings = [];
for (var s = 0; s < SEG_COUNT; s += 1) {
var raw = (t - T0 - s * SEG_MS) / SEG_DUR;
if (raw < 0) continue;
var flashing = raw >= 0.9 && raw <= 1.2;
if (!flashing) continue;
for (var a = 0; a < ITEM_COUNT; a += 1) {
for (var b = a + 1; b < ITEM_COUNT; b += 1) {
var y1a = RANKS[s][a], y1b = RANKS[s + 1][a];
var y2a = RANKS[s][b], y2b = RANKS[s + 1][b];
var Da = y1a - y2a, Db = y1b - y2b;
if ((Da > 0) === (Db > 0)) continue;
var f = Da / (Da - Db);
if (f < 0 || f > 1) continue;
crossings.push({ s: s, f: f, rank: y1a + (y1b - y1a) * f });
}
}
}
for (var r = 0; r < ITEM_COUNT; r += 1) {
var boosted = crossings.some(function (c) { return Math.round(c.rank) === r; });
ctx.fillStyle = boosted ? 'rgba(23,20,26,.14)' : 'rgba(23,20,26,.05)';
var bandTop = Math.max(0, rankY(r) - rowH / 2);
var bandBottom = Math.min(ch, rankY(r) + rowH / 2);
ctx.fillRect(0, bandTop, cw, bandBottom - bandTop);
}
for (var it = 0; it < ITEM_COUNT; it += 1) {
ctx.strokeStyle = LINE_COLORS[it];
ctx.lineWidth = 2.5;
for (var s2 = 0; s2 < SEG_COUNT; s2 += 1) {
var raw2 = (t - T0 - s2 * SEG_MS) / SEG_DUR;
if (raw2 <= 0) break;
var frac2 = clamp(raw2, 0, 1);
var x0 = periodX(s2), x1 = periodX(s2 + 1);
var y0 = rankY(RANKS[s2][it]), y1v = rankY(RANKS[s2 + 1][it]);
var xEnd = x0 + (x1 - x0) * frac2;
var yEnd = y0 + (y1v - y0) * frac2;
ctx.beginPath();
ctx.moveTo(x0, y0);
ctx.lineTo(xEnd, yEnd);
ctx.stroke();
}
for (var pd = 0; pd < PERIOD_COUNT; pd += 1) {
var arrived = pd === 0 || clamp((t - T0 - (pd - 1) * SEG_MS) / SEG_DUR, 0, 1) >= 1;
if (!arrived) continue;
ctx.fillStyle = LINE_COLORS[it];
ctx.beginPath();
ctx.arc(periodX(pd), rankY(RANKS[pd][it]), 3.5, 0, Math.PI * 2);
ctx.fill();
}
}
for (var ci = 0; ci < crossings.length; ci += 1) {
var c = crossings[ci];
var cx0 = periodX(c.s), cx1 = periodX(c.s + 1);
var xc = cx0 + (cx1 - cx0) * c.f;
var yc = rankY(c.rank);
ctx.strokeStyle = '#17141a';
ctx.lineWidth = 1.5;
ctx.beginPath();
ctx.arc(xc, yc, 5, 0, Math.PI * 2);
ctx.stroke();
}
ctx.globalAlpha = 1;
}
function autoDemoStep(elapsedMs) {
render(elapsedMs);
}
function fit() {
var r = wrap.getBoundingClientRect();
cw = Math.max(1, Math.round(r.width));
ch = Math.max(1, Math.round(r.height));
canvas.width = cw; canvas.height = ch;
render(elapsed);
}
var reduce = window.matchMedia('(prefers-reduced-motion: reduce)').matches;
var elapsed = reduce ? 1500 : 0;
if (reduce) root.classList.remove('is-demo');
var lastTs = null;
function tick(ts) {
if (lastTs === null) lastTs = ts;
var dt = Math.min(ts - lastTs, 48);
lastTs = ts;
if (!reduce) {
elapsed += dt;
autoDemoStep(elapsed);
}
requestAnimationFrame(tick);
}
fit();
window.addEventListener('resize', fit);
render(elapsed);
requestAnimationFrame(tick);
})();import { useEffect, useRef } from "react";
import styles from "./ChartAdvancedBumpRankCrossing.module.scss";
type Crossing = { s: number; f: number; rank: number };
export default function ChartAdvancedBumpRankCrossing() {
const rootRef = useRef<HTMLDivElement>(null);
const canvasRef = useRef<HTMLCanvasElement>(null);
useEffect(() => {
const root = rootRef.current;
const canvas = canvasRef.current;
if (!root || !canvas) return;
const ctx = canvas.getContext("2d");
if (!ctx) return;
const wrap = canvas.parentElement as HTMLElement;
function seedRand(seed: number) {
let s = seed >>> 0;
return function () { s = (s * 1664525 + 1013904223) >>> 0; return s / 4294967296; };
}
const rand = seedRand(425081);
const ITEM_COUNT = 5, PERIOD_COUNT = 5;
const VALUES: number[][] = [];
for (let p = 0; p < PERIOD_COUNT; p += 1) {
const row: number[] = [];
for (let i = 0; i < ITEM_COUNT; i += 1) row.push(10 + rand() * 90);
VALUES.push(row);
}
function ranksOf(row: number[]) {
const idx = row.map((v, i) => i);
idx.sort((a, b) => row[b] - row[a]);
const rank = new Array(row.length);
idx.forEach((itemI, pos) => { rank[itemI] = pos; });
return rank;
}
const RANKS = VALUES.map(ranksOf);
const LINE_COLORS = ["#2f6df6", "#c2361a", "#2b9d74", "#8a5cd6", "#0a4fe8"];
const LOOP_MS = 2000;
const T0 = 200;
const SEG_MS = 300;
const SEG_DUR = 260;
const SEG_COUNT = PERIOD_COUNT - 1;
let cw = 480, ch = 300;
function clamp(v: number, lo: number, hi: number) { return Math.max(lo, Math.min(hi, v)); }
function periodX(p: number) {
const padX = cw * 0.08;
return padX + (cw - padX * 2) * (p / (PERIOD_COUNT - 1));
}
function rankY(r: number) {
const padY = ch * 0.14;
return padY + (ch - padY * 2) * (r / (ITEM_COUNT - 1));
}
function render(elapsedMs: number) {
const t = elapsedMs % LOOP_MS;
ctx!.clearRect(0, 0, cw, ch);
let fadeAlpha = 1;
if (t >= 1750) fadeAlpha = clamp(1 - (t - 1750) / 200, 0, 1);
ctx!.globalAlpha = fadeAlpha;
const rowH = (ch - ch * 0.28) / (ITEM_COUNT - 1);
const crossings: Crossing[] = [];
for (let s = 0; s < SEG_COUNT; s += 1) {
const raw = (t - T0 - s * SEG_MS) / SEG_DUR;
if (raw < 0) continue;
const flashing = raw >= 0.9 && raw <= 1.2;
if (!flashing) continue;
for (let a = 0; a < ITEM_COUNT; a += 1) {
for (let b = a + 1; b < ITEM_COUNT; b += 1) {
const y1a = RANKS[s][a], y1b = RANKS[s + 1][a];
const y2a = RANKS[s][b], y2b = RANKS[s + 1][b];
const Da = y1a - y2a, Db = y1b - y2b;
if ((Da > 0) === (Db > 0)) continue;
const f = Da / (Da - Db);
if (f < 0 || f > 1) continue;
crossings.push({ s: s, f: f, rank: y1a + (y1b - y1a) * f });
}
}
}
for (let r = 0; r < ITEM_COUNT; r += 1) {
const boosted = crossings.some((c) => Math.round(c.rank) === r);
ctx!.fillStyle = boosted ? "rgba(23,20,26,.14)" : "rgba(23,20,26,.05)";
const bandTop = Math.max(0, rankY(r) - rowH / 2);
const bandBottom = Math.min(ch, rankY(r) + rowH / 2);
ctx!.fillRect(0, bandTop, cw, bandBottom - bandTop);
}
for (let it = 0; it < ITEM_COUNT; it += 1) {
ctx!.strokeStyle = LINE_COLORS[it];
ctx!.lineWidth = 2.5;
for (let s2 = 0; s2 < SEG_COUNT; s2 += 1) {
const raw2 = (t - T0 - s2 * SEG_MS) / SEG_DUR;
if (raw2 <= 0) break;
const frac2 = clamp(raw2, 0, 1);
const x0 = periodX(s2), x1 = periodX(s2 + 1);
const y0 = rankY(RANKS[s2][it]), y1v = rankY(RANKS[s2 + 1][it]);
const xEnd = x0 + (x1 - x0) * frac2;
const yEnd = y0 + (y1v - y0) * frac2;
ctx!.beginPath();
ctx!.moveTo(x0, y0);
ctx!.lineTo(xEnd, yEnd);
ctx!.stroke();
}
for (let pd = 0; pd < PERIOD_COUNT; pd += 1) {
const arrived = pd === 0 || clamp((t - T0 - (pd - 1) * SEG_MS) / SEG_DUR, 0, 1) >= 1;
if (!arrived) continue;
ctx!.fillStyle = LINE_COLORS[it];
ctx!.beginPath();
ctx!.arc(periodX(pd), rankY(RANKS[pd][it]), 3.5, 0, Math.PI * 2);
ctx!.fill();
}
}
for (let ci = 0; ci < crossings.length; ci += 1) {
const c = crossings[ci];
const cx0 = periodX(c.s), cx1 = periodX(c.s + 1);
const xc = cx0 + (cx1 - cx0) * c.f;
const yc = rankY(c.rank);
ctx!.strokeStyle = "#17141a";
ctx!.lineWidth = 1.5;
ctx!.beginPath();
ctx!.arc(xc, yc, 5, 0, Math.PI * 2);
ctx!.stroke();
}
ctx!.globalAlpha = 1;
}
function autoDemoStep(elapsedMs: number) {
render(elapsedMs);
}
function fit() {
const r = wrap.getBoundingClientRect();
cw = Math.max(1, Math.round(r.width));
ch = Math.max(1, Math.round(r.height));
canvas!.width = cw; canvas!.height = ch;
render(elapsed);
}
const reduce = window.matchMedia("(prefers-reduced-motion: reduce)").matches;
let elapsed = reduce ? 1500 : 0;
if (reduce) root.classList.remove("is-demo");
let lastTs: number | null = null;
let raf = 0;
function tick(ts: number) {
if (lastTs === null) lastTs = ts;
const dt = Math.min(ts - lastTs, 48);
lastTs = ts;
if (!reduce) {
elapsed += dt;
autoDemoStep(elapsed);
}
raf = requestAnimationFrame(tick);
}
fit();
window.addEventListener("resize", fit);
render(elapsed);
raf = requestAnimationFrame(tick);
return () => {
cancelAnimationFrame(raf);
window.removeEventListener("resize", fit);
};
}, []);
return (
<main className={styles.stage}>
<div className={`${styles.bmp} is-demo`} ref={rootRef}>
<canvas className={styles.bmp__canvas} ref={canvasRef} width={480} height={300} />
<p className={styles.bmp__caption}>구간마다 값 순서를 다시 매겨 순위를 세로 좌표로 계산해, 두 항목의 순위가 뒤바뀌는 지점에서 선이 서로 교차한다</p>
</div>
</main>
);
}08 Bump Chart Where Lines Cross as Rankings Change — Measured area 42.761% · moving frames 20/23Original by GODRICH · SCSS and React ship in the zip · 9 Data Visualization Chart Types With Real Math
The post this demo lives in
 9 Data Visualization Chart Types With Real MathA data visualization chart types set built from real math, not screenshots. Three of the nine flow like ribbons, three b See all demos in this post
If you like this effect - similar demos
 Dashboard UI02 A Bar Chart Race Where Bars Switch Lanes as Ranks FlipBar Chart Animation: 9 Demos From Spring to Race
 Dashboard UI04 A month bar splits into days where it standsChart UI Design: 9 Interactions You Can Drag
 Dashboard UI09 A Pie Chart Scene Where the Pointer Acts as a Light Over Every SlicePie Chart CSS: 9 Slices That Pop, Tilt and Morph