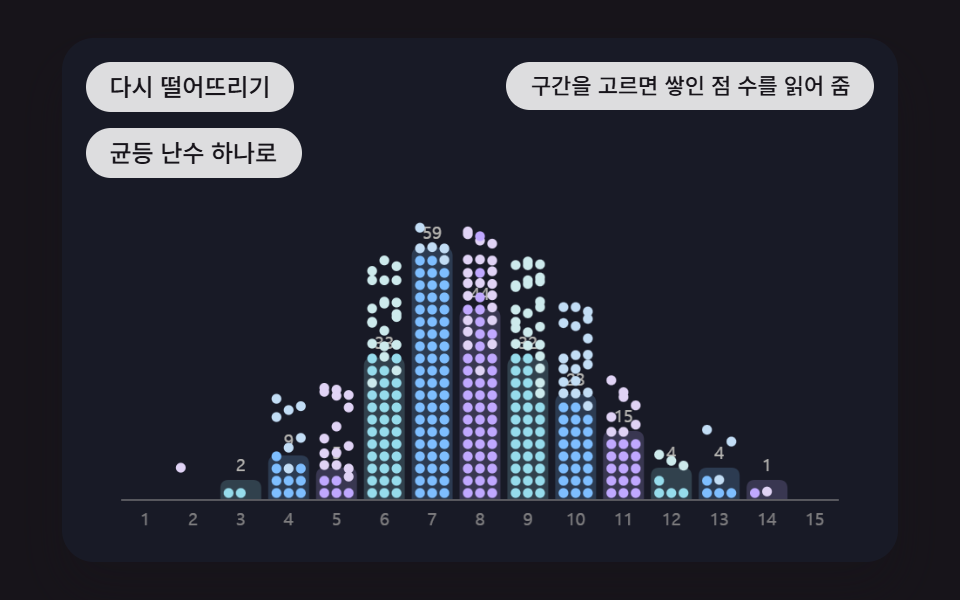
08Falling Dots That Pile Into Bins and Become a Histogram
It makes dots from the average of several uniform randoms so the middle is thicker, drops them from the top, integrates speed with DROP_GRAVITY, and when one hits its bin's pile among BIN_COUNT bins it bounces with BOUNCE_LOSS and comes to rest, so the piles become the bars.
Best forA tech post explaining response-time spread
DROP_GRAVITYBIN_COUNTBOUNCE_LOSS
<main class="stage">
<div class="bc is-demo" id="bc">
  <canvas class="bc__canvas" data-role="canvas" width="480" height="300" tabindex="0" aria-label="A chart where falling dots bounce, settle and pile up in each bin until the piles become histogram bars. Pick a bin with ←/→ to hear how many dots piled up"></canvas>
  <p class="bc__status" data-role="status" aria-live="off">Pick a bin to hear how many dots piled up</p>
  <div class="bc__tools">
    <button class="bc__btn" data-role="replay" type="button">Drop again</button>
    <button class="bc__btn" data-role="flat" type="button" aria-pressed="false">One uniform random</button>
  </div>
</div>
</main>
@use "../../../../site/static/demo-tokens" as *;
@include stage($stage-ink);
.bc {
position: relative;
width: min(92vw, calc(160vh - 12.8vw));
aspect-ratio: 480 / 300;
margin: 0 auto;
border-radius: $r-card;
overflow: hidden;
box-shadow: $shadow-raised;
background: $subject-ink;
}
.bc__canvas {
display: block;
width: 100%;
height: 100%;
cursor: crosshair;
}
.bc__canvas:focus-visible {
outline: 2px solid rgba(255, 255, 255, .85);
outline-offset: -6px;
}
.bc__status {
position: absolute;
right: $sp-3;
top: $sp-3;
box-sizing: border-box;
max-width: 46%;
margin: 0;
text-align: right;
padding: $sp-1 $sp-3;
border-radius: $r-control;
background: rgba(255, 255, 255, .85);
color: $subject-ink;
font-weight: 500;
font-size: 11px;
line-height: 1.4;
pointer-events: none;
}
// 그래프는 아래쪽 판에 있다 — 버튼은 왼쪽 위, 상태 줄은 오른쪽 위 띠에 두어 막대를 덮지 않는다
.bc__tools {
position: absolute;
left: $sp-3;
top: $sp-3;
box-sizing: border-box;
max-width: 50%;
display: flex;
flex-wrap: wrap;
gap: $sp-2;
}
.bc__btn {
margin: 0;
padding: $sp-1 $sp-3;
border: 0;
border-radius: $r-pill;
background: rgba(255, 255, 255, .85);
color: $subject-ink;
font: inherit;
font-weight: 500;
font-size: 12px;
line-height: 1.4;
cursor: pointer;
transition: background-color $dur-quick ease-out;
}
.bc__btn:hover {
background: $subject-cream;
}
.bc__btn[aria-pressed="true"] {
background: $subject-mint;
}
.bc__btn:focus-visible {
outline: 2px solid rgba(255, 255, 255, .95);
outline-offset: 2px;
}
// 손가락 가로 끌기는 이 캔버스가 받고, 세로 쓸기는 브라우저에 남겨 페이지 스크롤이 막히지 않게 한다
.bc__canvas { touch-action: pan-y; }
@media (max-width: 340px) {
.bc__btn { font-size: 10px; padding: $sp-1 $sp-2; }
.bc__status { font-size: 10px; padding: $sp-1 $sp-2; }
}
@media (prefers-reduced-motion: reduce) {
.bc__btn { transition: none; }
}html, body {
margin: 0;
overflow: hidden;
}
.stage {
box-sizing: border-box;
min-height: 100vh;
display: grid;
place-items: center;
margin: 0;
background: #17141a;
font-family: -apple-system, "Segoe UI", "Noto Sans KR", sans-serif;
padding: clamp(8px, 4vw, 24px);
}
.bc {
position: relative;
width: min(92vw, 160vh - 12.8vw);
aspect-ratio: 480/300;
margin: 0 auto;
border-radius: 16px;
overflow: hidden;
box-shadow: 0 14px 24px rgba(23, 20, 26, 0.32);
background: #17141a;
}
.bc__canvas {
display: block;
width: 100%;
height: 100%;
cursor: crosshair;
}
.bc__canvas:focus-visible {
outline: 2px solid rgba(255, 255, 255, 0.85);
outline-offset: -6px;
}
.bc__status {
position: absolute;
right: 12px;
top: 12px;
box-sizing: border-box;
max-width: 46%;
margin: 0;
text-align: right;
padding: 4px 12px;
border-radius: 12px;
background: rgba(255, 255, 255, 0.85);
color: #17141a;
font-weight: 500;
font-size: 11px;
line-height: 1.4;
pointer-events: none;
}
.bc__tools {
position: absolute;
left: 12px;
top: 12px;
box-sizing: border-box;
max-width: 50%;
display: flex;
flex-wrap: wrap;
gap: 8px;
}
.bc__btn {
margin: 0;
padding: 4px 12px;
border: 0;
border-radius: 999px;
background: rgba(255, 255, 255, 0.85);
color: #17141a;
font: inherit;
font-weight: 500;
font-size: 12px;
line-height: 1.4;
cursor: pointer;
transition: background-color 220ms ease-out;
}
.bc__btn:hover {
background: #fff7e6;
}
.bc__btn[aria-pressed=true] {
background: #4cd4a6;
}
.bc__btn:focus-visible {
outline: 2px solid rgba(255, 255, 255, 0.95);
outline-offset: 2px;
}
.bc__canvas {
touch-action: pan-y;
}
@media (max-width: 340px) {
.bc__btn {
font-size: 10px;
padding: 4px 8px;
}
.bc__status {
font-size: 10px;
padding: 4px 8px;
}
}
@media (prefers-reduced-motion: reduce) {
.bc__btn {
transition: none;
}
}(function () {
const root = document.getElementById("bc");
if (!root) return;
const W = 480;
const H = 300;
const FIXED_DT = 16;
const TAU = Math.PI * 2;
// 파스텔 팔레트 — 어두운 무대 위에 밝은 막대를 얹어 명도 차로 경계가 읽힌다
const BG = [24, 26, 38];
const PANEL = [36, 39, 56];
const PAPER = [250, 246, 236];
const INK = [30, 30, 44];
const PAL = [
[126, 190, 255],
[255, 164, 190],
[130, 224, 190],
[192, 168, 255],
[255, 206, 160],
[244, 226, 140],
[150, 220, 236],
[230, 184, 226],
[196, 220, 160],
[176, 196, 236],
];
// 가상 데이터의 이름 — 실제 항목이 아니라 순서만 뜻한다
const LABELS = ['Item A', 'Item B', 'Item C', 'Item D', 'Item E', 'Item F', 'Item G', 'Item H', 'Item I', 'Item J'];
function clamp(v, lo, hi) { return v < lo ? lo : (v > hi ? hi : v); }
function lerp(a, b, k) { return a + (b - a) * k; }
function smooth(x) { const c = clamp(x, 0, 1); return c * c * (3 - 2 * c); }
function rgba(c, a) {
return 'rgba(' + Math.round(c[0]) + ',' + Math.round(c[1]) + ',' + Math.round(c[2]) + ',' + clamp(a, 0, 1).toFixed(3) + ')';
}
function mix(a, b, k) { return [lerp(a[0], b[0], k), lerp(a[1], b[1], k), lerp(a[2], b[2], k)]; }
const canvasEl = root.querySelector('[data-role="canvas"]');
const statusEl = root.querySelector('[data-role="status"]');
const ctxRaw = canvasEl ? canvasEl.getContext('2d') : null;
if (!canvasEl || !ctxRaw || !statusEl) {
return;
}
const cv = canvasEl;
const ctx = ctxRaw;
const status = statusEl;
const reduceQuery = window.matchMedia('(prefers-reduced-motion: reduce)');
// 움직임 줄이기 — 열린 페이지에서 설정을 바꿔도 아래 tail 의 change 리스너가 이 값을 다시 읽는다
let still = reduceQuery.matches;
// 자동 시연 중인가 — 사람이 처음 만지는 순간 시연을 멈추고 상태 줄을 읽어 주기 시작한다
let demo = root.classList.contains('is-demo');
function wake() {
if (!demo) {
return;
}
demo = false;
root.classList.remove('is-demo');
status.setAttribute('aria-live', 'polite');
}
function say(text) {
if (status.textContent !== text) {
status.textContent = text;
}
}
function fitCanvas() {
// 배율은 2 에서 자른다 — 배율 3 기기에서 화소가 2.25배로 늘어 프레임마다 일이 그만큼 커지지 않게
const dpr = Math.min(window.devicePixelRatio || 1, 2);
cv.width = Math.round(W * dpr);
cv.height = Math.round(H * dpr);
ctx.setTransform(dpr, 0, 0, dpr, 0, 0);
}
function onResize() {
fitCanvas();
draw();
}
fitCanvas();
window.addEventListener('resize', onResize);
// 화면 좌표(CSS px) → 장면 좌표(480x300). 리사이즈 뒤에도 늘 현재 크기로 다시 잰다
function toScene(ev) {
const r = cv.getBoundingClientRect();
return [((ev.clientX - r.left) / r.width) * W, ((ev.clientY - r.top) / r.height) * H];
}
// 시드 고정 난수 — 같은 시드면 같은 가상 데이터가 다시 나온다 (32비트 정수 섞기)
function makeRng(seed) {
let s = seed >>> 0;
return function () {
s = (s + 0x6d2b79f5) >>> 0;
let t = s;
t = Math.imul(t ^ (t >>> 15), t | 1);
t ^= t + Math.imul(t ^ (t >>> 7), t | 61);
return ((t ^ (t >>> 14)) >>> 0) / 4294967296;
};
}
function seededValues(seed, n, lo, hi) {
const rnd = makeRng(seed);
const out = [];
for (let i = 0; i < n; i += 1) {
out.push(lo + Math.floor(rnd() * (hi - lo + 1)));
}
return out;
}
// 세 자리마다 쉼표 — 지역 설정에 기대지 않는다
function groupDigits(n) {
const s = String(Math.round(Math.abs(n)));
let out = '';
for (let i = 0; i < s.length; i += 1) {
if (i > 0 && (s.length - i) % 3 === 0) {
out += ',';
}
out += s[i];
}
return (n < 0 ? '-' : '') + out;
}
// 세로 막대 경로 — 기준선 base 에서 h 만큼(음수면 아래로) 뻗고, 끝 모서리만 둥글린다
function barPath(c, x, base, w, h, r) {
const rr = Math.min(r, Math.abs(h), w / 2);
const tip = base - h;
const s = h >= 0 ? 1 : -1;
c.beginPath();
c.moveTo(x, base);
c.lineTo(x, tip + s * rr);
c.quadraticCurveTo(x, tip, x + rr, tip);
c.lineTo(x + w - rr, tip);
c.quadraticCurveTo(x + w, tip, x + w, tip + s * rr);
c.lineTo(x + w, base);
c.closePath();
}
// 가로 막대 경로 — 왼쪽 x0 에서 len 만큼 뻗고 오른쪽 끝만 둥글린다
function hbarPath(c, x0, y, len, th, r) {
const rr = Math.min(r, Math.max(len, 0), th / 2);
const x1 = x0 + Math.max(len, 0);
c.beginPath();
c.moveTo(x0, y);
c.lineTo(x1 - rr, y);
c.quadraticCurveTo(x1, y, x1, y + rr);
c.lineTo(x1, y + th - rr);
c.quadraticCurveTo(x1, y + th, x1 - rr, y + th);
c.lineTo(x0, y + th);
c.closePath();
}
function clearStage() {
ctx.fillStyle = rgba(BG, 1);
ctx.fillRect(0, 0, W, H);
}
function axisText(text, x, y, align, a) {
ctx.font = '500 10px sans-serif';
ctx.textAlign = align;
ctx.textBaseline = 'middle';
ctx.fillStyle = rgba(PAPER, a);
ctx.fillText(text, x, y);
}
// 고른 막대 — 화살표 키·포인터가 가리키는 sel 과 Enter·Space·클릭으로 고정한 pinned
let sel = -1;
let pinned = -1;
function focusIdx() { return sel >= 0 ? sel : pinned; }
function nextIdx(cur, d, n) {
return cur < 0 ? (d > 0 ? 0 : n - 1) : (cur + d + n) % n;
}
function togglePin(i) {
pinned = i < 0 || pinned === i ? -1 : i;
}
// 고른 막대 테두리 — 화살표·포인터로 가리키기만 하면 점선, Enter·Space·클릭으로 고정하면 실선
function ringStyle(i, a) {
ctx.strokeStyle = rgba(PAPER, 0.95 * a);
ctx.lineWidth = 2;
ctx.setLineDash(i === pinned ? [] : [4, 3]);
}
// 키보드 — ←/→ 막대 옮기기, Enter·Space 고르기, Esc 풀기. 셋 다 상태 줄이 이름과 값을 읽는다
function bindKeys(move, changed) {
cv.addEventListener('keydown', function (ev) {
if (ev.key === 'ArrowRight' || ev.key === 'ArrowLeft') {
ev.preventDefault();
wake();
move(ev.key === 'ArrowRight' ? 1 : -1);
changed();
}
else if (ev.key === 'Enter' || ev.key === ' ') {
ev.preventDefault();
wake();
togglePin(focusIdx());
changed();
}
else if (ev.key === 'Escape') {
ev.preventDefault();
wake();
sel = -1;
pinned = -1;
changed();
}
});
}
// 포인터 — 올리면 sel, 누르면 그 막대를 고정(같은 막대를 다시 누르면 풀기)
function bindPointer(hit, changed) {
cv.addEventListener('pointermove', function (ev) {
if (demo) {
return;
}
const p = toScene(ev);
const i = hit(p[0], p[1]);
if (i !== sel) {
sel = i;
changed();
}
});
cv.addEventListener('pointerdown', function (ev) {
wake();
const p = toScene(ev);
const i = hit(p[0], p[1]);
sel = i;
togglePin(i);
changed();
});
}
// 시연 일정 — 루프 안의 시각(ms) 표를 지날 때마다 한 번씩 부른다
let schedCycle = -1;
let schedIdx = 0;
function runSchedule(t, loop, marks, fire) {
const cyc = Math.floor(t / loop);
const p = t - cyc * loop;
if (cyc !== schedCycle) {
schedCycle = cyc;
schedIdx = 0;
}
while (schedIdx < marks.length && p >= marks[schedIdx]) {
fire(schedIdx, cyc);
schedIdx += 1;
}
}
// 중력 가속도(px/s²) — 16ms 걸음마다 속도에 더하고, 속도로 위치를 옮긴다
const DROP_GRAVITY = 1400;
// 칸 수 — 0~1 사이 표본을 이만큼 똑같이 나눠 어느 칸에 떨어질지 정한다
const BIN_COUNT = 15;
// 쌓인 점에 닿을 때 남기는 속도 비율 — 이 값을 곱해 위로 튕긴다
const BOUNCE_LOSS = 0.35;
// 균등 난수 몇 개를 평균 내는지 — 1 이면 칸마다 고르고, 늘수록 가운데가 두꺼워진다
const MEAN_OF = 4;
const DOT_N = 360;
const SPAWN_PER_STEP = 6;
const REST_SPEED = 70;
const DOT_COLS = 3;
const DOT_STEP = 7;
const DOT_R = 2.8;
const SEED = 4708;
const PLOT_L = 34;
const PLOT_R = 446;
const PLOT_T = 52;
const PLOT_B = 264;
const DEMO_LOOP = 2000;
const TXT_IDLE = 'Pick a bin to hear how many dots piled up';
const TXT_BIN = 'Bin ';
const replayBtn = root.querySelector('[data-role="replay"]');
const flatBtn = root.querySelector('[data-role="flat"]');
const binW = (PLOT_R - PLOT_L) / BIN_COUNT;
let dots = [];
let reserved = [];
let landed = [];
let rnd = makeRng(SEED);
let spawned = 0;
let flat = false;
let round = 0;
// 표본 하나 — 균등 난수 n 개의 평균. 여러 개를 더할수록 가운데(0.5) 근처가 잦아진다
function sampleMean(n) {
let s = 0;
for (let i = 0; i < n; i += 1) {
s += rnd();
}
return s / n;
}
function reset() {
round += 1;
rnd = makeRng(SEED + round);
dots = [];
reserved = [];
landed = [];
for (let b = 0; b < BIN_COUNT; b += 1) {
reserved.push(0);
landed.push(0);
}
spawned = 0;
}
// 점 하나 내보내기 — 칸을 고르고, 그 칸에서 몇 번째 자리에 앉을지 미리 잡아 둔다
function spawn() {
const u = sampleMean(flat ? 1 : MEAN_OF);
const bin = Math.min(BIN_COUNT - 1, Math.floor(u * BIN_COUNT));
const slot = reserved[bin];
reserved[bin] += 1;
const col = slot % DOT_COLS;
const row = Math.floor(slot / DOT_COLS);
const x = PLOT_L + bin * binW + (binW - (DOT_COLS - 1) * DOT_STEP) / 2 + col * DOT_STEP;
dots.push({ x: x, y: PLOT_T - 6 - rnd() * 40, v: 0, bin: bin, restY: PLOT_B - DOT_STEP / 2 - row * DOT_STEP, rest: false });
spawned += 1;
}
function step() {
const dt = FIXED_DT / 1000;
for (let k = 0; k < SPAWN_PER_STEP && spawned < DOT_N; k += 1) {
spawn();
}
for (let i = 0; i < dots.length; i += 1) {
const d = dots[i];
if (d.rest) {
continue;
}
d.v += DROP_GRAVITY * dt;
d.y += d.v * dt;
// 제 자리(쌓인 높이)에 닿으면 튕기거나, 충분히 느리면 멈춰 쌓인다
if (d.y >= d.restY) {
d.y = d.restY;
if (d.v > REST_SPEED) {
d.v = -d.v * BOUNCE_LOSS;
}
else {
d.v = 0;
d.rest = true;
landed[d.bin] += 1;
}
}
}
}
function settle() {
while (spawned < DOT_N) {
spawn();
}
for (let i = 0; i < dots.length; i += 1) {
const d = dots[i];
if (!d.rest) {
d.rest = true;
d.y = d.restY;
d.v = 0;
landed[d.bin] += 1;
}
}
}
function report() {
const f = focusIdx();
if (f >= 0) {
say(TXT_BIN + (f + 1) + ' · ' + landed[f] + ' / ' + spawned);
}
else {
say(TXT_IDLE);
}
}
function demoTick(t) {
runSchedule(t, DEMO_LOOP, [200], function () { reset(); });
}
function draw() {
clearStage();
ctx.fillStyle = rgba(PAPER, 0.3);
ctx.fillRect(PLOT_L, PLOT_B, PLOT_R - PLOT_L, 1);
const f = focusIdx();
// 막대 — 칸마다 멈춘 점 줄 수만큼의 높이. 쌓인 점 기둥을 그대로 감싼다
for (let b = 0; b < BIN_COUNT; b += 1) {
const rows = Math.ceil(landed[b] / DOT_COLS);
const h = rows * DOT_STEP;
const x = PLOT_L + b * binW + 2;
const c = PAL[b % 3 === 0 ? 0 : (b % 3 === 1 ? 3 : 6)];
ctx.fillStyle = rgba(c, b === f ? 0.42 : 0.2);
barPath(ctx, x, PLOT_B, binW - 4, h + (h > 0 ? 4 : 0), 5);
ctx.fill();
if (b === f) {
ringStyle(b, 1);
ctx.stroke();
ctx.setLineDash([]);
}
if (landed[b] > 0) {
axisText(String(landed[b]), x + (binW - 4) / 2, PLOT_B - h - 12, 'center', b === f ? 1 : 0.7);
}
axisText(String(b + 1), x + (binW - 4) / 2, PLOT_B + 12, 'center', b === f ? 0.95 : 0.45);
}
// 점 — 떨어지는 동안은 밝게, 멈추면 칸 색으로
for (let i = 0; i < dots.length; i += 1) {
const d = dots[i];
const c = PAL[d.bin % 3 === 0 ? 0 : (d.bin % 3 === 1 ? 3 : 6)];
ctx.fillStyle = d.rest ? rgba(c, 1) : rgba(mix(c, PAPER, 0.55), 1);
ctx.beginPath();
ctx.arc(d.x, d.y, DOT_R, 0, TAU);
ctx.fill();
}
}
function after() {
if (still) {
settle();
}
report();
draw();
if (flatBtn) {
flatBtn.setAttribute('aria-pressed', flat ? 'true' : 'false');
}
}
function hitBin(x, y) {
if (y < PLOT_T - 20 || y > PLOT_B + 20) {
return -1;
}
const b = Math.floor((x - PLOT_L) / binW);
return b >= 0 && b < BIN_COUNT ? b : -1;
}
bindKeys(function (d) { sel = nextIdx(focusIdx(), d, BIN_COUNT); }, after);
bindPointer(hitBin, after);
if (replayBtn) {
replayBtn.addEventListener('click', function () { wake(); reset(); after(); });
}
if (flatBtn) {
flatBtn.addEventListener('click', function () { wake(); flat = !flat; reset(); after(); });
}
reset();
report();
let rafId = 0;
let lastTs = -1;
let acc = 0;
let clock = 0;
function frame(ts) {
if (lastTs < 0) {
lastTs = ts;
}
// 탭이 숨었다 돌아와도 한 번에 100ms 까지만 따라잡는다 — 순간이동 대신 이어서 움직인다
acc += Math.min(ts - lastTs, 100);
lastTs = ts;
let n = 0;
while (acc >= FIXED_DT && n < 6) {
clock += FIXED_DT;
if (demo) {
demoTick(clock);
}
step();
acc -= FIXED_DT;
n += 1;
}
draw();
rafId = window.requestAnimationFrame(frame);
}
function startMotion() {
window.cancelAnimationFrame(rafId);
lastTs = -1;
acc = 0;
if (still) {
// 움직임 줄이기 — 루프를 돌리지 않고 지금 목표 상태로 바로 그린다
settle();
draw();
}
else {
rafId = window.requestAnimationFrame(frame);
}
}
// 열린 페이지에서 움직임 줄이기 설정이 바뀌어도 그 자리에서 루프를 멈추거나 다시 켠다
function onMotionPref() {
still = reduceQuery.matches;
startMotion();
}
if (typeof reduceQuery.addEventListener === 'function') {
reduceQuery.addEventListener('change', onMotionPref);
}
startMotion();
return function () {
window.cancelAnimationFrame(rafId);
window.removeEventListener('resize', onResize);
if (typeof reduceQuery.removeEventListener === 'function') {
reduceQuery.removeEventListener('change', onMotionPref);
}
};
})();// BarHistogramParticleDrop - vanilla 판(08-bar-chart-histogram-particle-drop) 의 React 포트. 같은 계산을 useEffect 안에서 돌린다.
import { useEffect, useRef } from "react";
import styles from "./BarHistogramParticleDrop.module.scss";
const cx = (s: string): string => s.split(" ").map((n) => styles[n] ?? n).join(" ");
export default function BarHistogramParticleDrop() {
const rootRef = useRef<HTMLDivElement | null>(null);
useEffect(() => {
const rootEl = rootRef.current;
if (!rootEl) return;
const root: HTMLElement = rootEl;
type RGB = [number, number, number];
const W = 480;
const H = 300;
const FIXED_DT = 16;
const TAU = Math.PI * 2;
// 파스텔 팔레트 — 어두운 무대 위에 밝은 막대를 얹어 명도 차로 경계가 읽힌다
const BG: RGB = [24, 26, 38];
const PANEL: RGB = [36, 39, 56];
const PAPER: RGB = [250, 246, 236];
const INK: RGB = [30, 30, 44];
const PAL: RGB[] = [
[126, 190, 255],
[255, 164, 190],
[130, 224, 190],
[192, 168, 255],
[255, 206, 160],
[244, 226, 140],
[150, 220, 236],
[230, 184, 226],
[196, 220, 160],
[176, 196, 236],
];
// 가상 데이터의 이름 — 실제 항목이 아니라 순서만 뜻한다
const LABELS = ['항목 A', '항목 B', '항목 C', '항목 D', '항목 E', '항목 F', '항목 G', '항목 H', '항목 I', '항목 J'];
function clamp(v: number, lo: number, hi: number): number { return v < lo ? lo : (v > hi ? hi : v); }
function lerp(a: number, b: number, k: number): number { return a + (b - a) * k; }
function smooth(x: number): number { const c = clamp(x, 0, 1); return c * c * (3 - 2 * c); }
function rgba(c: RGB, a: number): string {
return 'rgba(' + Math.round(c[0]) + ',' + Math.round(c[1]) + ',' + Math.round(c[2]) + ',' + clamp(a, 0, 1).toFixed(3) + ')';
}
function mix(a: RGB, b: RGB, k: number): RGB { return [lerp(a[0], b[0], k), lerp(a[1], b[1], k), lerp(a[2], b[2], k)]; }
const canvasEl = root.querySelector('[data-role="canvas"]') as HTMLCanvasElement | null;
const statusEl = root.querySelector('[data-role="status"]') as HTMLElement | null;
const ctxRaw = canvasEl ? canvasEl.getContext('2d') : null;
if (!canvasEl || !ctxRaw || !statusEl) { return; }
const cv: HTMLCanvasElement = canvasEl;
const ctx: CanvasRenderingContext2D = ctxRaw;
const status: HTMLElement = statusEl;
const reduceQuery = window.matchMedia('(prefers-reduced-motion: reduce)');
// 움직임 줄이기 — 열린 페이지에서 설정을 바꿔도 아래 tail 의 change 리스너가 이 값을 다시 읽는다
let still = reduceQuery.matches;
// 자동 시연 중인가 — 사람이 처음 만지는 순간 시연을 멈추고 상태 줄을 읽어 주기 시작한다
let demo = root.classList.contains('is-demo');
function wake(): void {
if (!demo) { return; }
demo = false;
root.classList.remove('is-demo');
status.setAttribute('aria-live', 'polite');
}
function say(text: string): void {
if (status.textContent !== text) { status.textContent = text; }
}
function fitCanvas(): void {
// 배율은 2 에서 자른다 — 배율 3 기기에서 화소가 2.25배로 늘어 프레임마다 일이 그만큼 커지지 않게
const dpr = Math.min(window.devicePixelRatio || 1, 2);
cv.width = Math.round(W * dpr);
cv.height = Math.round(H * dpr);
ctx.setTransform(dpr, 0, 0, dpr, 0, 0);
}
function onResize(): void {
fitCanvas();
draw();
}
fitCanvas();
window.addEventListener('resize', onResize);
// 화면 좌표(CSS px) → 장면 좌표(480x300). 리사이즈 뒤에도 늘 현재 크기로 다시 잰다
function toScene(ev: PointerEvent): [number, number] {
const r = cv.getBoundingClientRect();
return [((ev.clientX - r.left) / r.width) * W, ((ev.clientY - r.top) / r.height) * H];
}
// 시드 고정 난수 — 같은 시드면 같은 가상 데이터가 다시 나온다 (32비트 정수 섞기)
function makeRng(seed: number): () => number {
let s = seed >>> 0;
return function (): number {
s = (s + 0x6d2b79f5) >>> 0;
let t = s;
t = Math.imul(t ^ (t >>> 15), t | 1);
t ^= t + Math.imul(t ^ (t >>> 7), t | 61);
return ((t ^ (t >>> 14)) >>> 0) / 4294967296;
};
}
function seededValues(seed: number, n: number, lo: number, hi: number): number[] {
const rnd = makeRng(seed);
const out: number[] = [];
for (let i = 0; i < n; i += 1) { out.push(lo + Math.floor(rnd() * (hi - lo + 1))); }
return out;
}
// 세 자리마다 쉼표 — 지역 설정에 기대지 않는다
function groupDigits(n: number): string {
const s = String(Math.round(Math.abs(n)));
let out = '';
for (let i = 0; i < s.length; i += 1) {
if (i > 0 && (s.length - i) % 3 === 0) { out += ','; }
out += s[i];
}
return (n < 0 ? '-' : '') + out;
}
// 세로 막대 경로 — 기준선 base 에서 h 만큼(음수면 아래로) 뻗고, 끝 모서리만 둥글린다
function barPath(c: CanvasRenderingContext2D, x: number, base: number, w: number, h: number, r: number): void {
const rr = Math.min(r, Math.abs(h), w / 2);
const tip = base - h;
const s = h >= 0 ? 1 : -1;
c.beginPath();
c.moveTo(x, base);
c.lineTo(x, tip + s * rr);
c.quadraticCurveTo(x, tip, x + rr, tip);
c.lineTo(x + w - rr, tip);
c.quadraticCurveTo(x + w, tip, x + w, tip + s * rr);
c.lineTo(x + w, base);
c.closePath();
}
// 가로 막대 경로 — 왼쪽 x0 에서 len 만큼 뻗고 오른쪽 끝만 둥글린다
function hbarPath(c: CanvasRenderingContext2D, x0: number, y: number, len: number, th: number, r: number): void {
const rr = Math.min(r, Math.max(len, 0), th / 2);
const x1 = x0 + Math.max(len, 0);
c.beginPath();
c.moveTo(x0, y);
c.lineTo(x1 - rr, y);
c.quadraticCurveTo(x1, y, x1, y + rr);
c.lineTo(x1, y + th - rr);
c.quadraticCurveTo(x1, y + th, x1 - rr, y + th);
c.lineTo(x0, y + th);
c.closePath();
}
function clearStage(): void {
ctx.fillStyle = rgba(BG, 1);
ctx.fillRect(0, 0, W, H);
}
function axisText(text: string, x: number, y: number, align: CanvasTextAlign, a: number): void {
ctx.font = '500 10px sans-serif';
ctx.textAlign = align;
ctx.textBaseline = 'middle';
ctx.fillStyle = rgba(PAPER, a);
ctx.fillText(text, x, y);
}
// 고른 막대 — 화살표 키·포인터가 가리키는 sel 과 Enter·Space·클릭으로 고정한 pinned
let sel = -1;
let pinned = -1;
function focusIdx(): number { return sel >= 0 ? sel : pinned; }
function nextIdx(cur: number, d: number, n: number): number {
return cur < 0 ? (d > 0 ? 0 : n - 1) : (cur + d + n) % n;
}
function togglePin(i: number): void {
pinned = i < 0 || pinned === i ? -1 : i;
}
// 고른 막대 테두리 — 화살표·포인터로 가리키기만 하면 점선, Enter·Space·클릭으로 고정하면 실선
function ringStyle(i: number, a: number): void {
ctx.strokeStyle = rgba(PAPER, 0.95 * a);
ctx.lineWidth = 2;
ctx.setLineDash(i === pinned ? [] : [4, 3]);
}
// 키보드 — ←/→ 막대 옮기기, Enter·Space 고르기, Esc 풀기. 셋 다 상태 줄이 이름과 값을 읽는다
function bindKeys(move: (d: number) => void, changed: () => void): void {
cv.addEventListener('keydown', function (ev: KeyboardEvent): void {
if (ev.key === 'ArrowRight' || ev.key === 'ArrowLeft') {
ev.preventDefault();
wake();
move(ev.key === 'ArrowRight' ? 1 : -1);
changed();
} else if (ev.key === 'Enter' || ev.key === ' ') {
ev.preventDefault();
wake();
togglePin(focusIdx());
changed();
} else if (ev.key === 'Escape') {
ev.preventDefault();
wake();
sel = -1;
pinned = -1;
changed();
}
});
}
// 포인터 — 올리면 sel, 누르면 그 막대를 고정(같은 막대를 다시 누르면 풀기)
function bindPointer(hit: (x: number, y: number) => number, changed: () => void): void {
cv.addEventListener('pointermove', function (ev: PointerEvent): void {
if (demo) { return; }
const p = toScene(ev);
const i = hit(p[0], p[1]);
if (i !== sel) { sel = i; changed(); }
});
cv.addEventListener('pointerdown', function (ev: PointerEvent): void {
wake();
const p = toScene(ev);
const i = hit(p[0], p[1]);
sel = i;
togglePin(i);
changed();
});
}
// 시연 일정 — 루프 안의 시각(ms) 표를 지날 때마다 한 번씩 부른다
let schedCycle = -1;
let schedIdx = 0;
function runSchedule(t: number, loop: number, marks: number[], fire: (k: number, cycle: number) => void): void {
const cyc = Math.floor(t / loop);
const p = t - cyc * loop;
if (cyc !== schedCycle) { schedCycle = cyc; schedIdx = 0; }
while (schedIdx < marks.length && p >= marks[schedIdx]) {
fire(schedIdx, cyc);
schedIdx += 1;
}
}
// 중력 가속도(px/s²) — 16ms 걸음마다 속도에 더하고, 속도로 위치를 옮긴다
const DROP_GRAVITY = 1400;
// 칸 수 — 0~1 사이 표본을 이만큼 똑같이 나눠 어느 칸에 떨어질지 정한다
const BIN_COUNT = 15;
// 쌓인 점에 닿을 때 남기는 속도 비율 — 이 값을 곱해 위로 튕긴다
const BOUNCE_LOSS = 0.35;
// 균등 난수 몇 개를 평균 내는지 — 1 이면 칸마다 고르고, 늘수록 가운데가 두꺼워진다
const MEAN_OF = 4;
const DOT_N = 360;
const SPAWN_PER_STEP = 6;
const REST_SPEED = 70;
const DOT_COLS = 3;
const DOT_STEP = 7;
const DOT_R = 2.8;
const SEED = 4708;
const PLOT_L = 34;
const PLOT_R = 446;
const PLOT_T = 52;
const PLOT_B = 264;
const DEMO_LOOP = 2000;
const TXT_IDLE = '구간을 고르면 쌓인 점 수를 읽어 줌';
const TXT_BIN = '구간 ';
const replayBtn = root.querySelector('[data-role="replay"]') as HTMLButtonElement | null;
const flatBtn = root.querySelector('[data-role="flat"]') as HTMLButtonElement | null;
const binW = (PLOT_R - PLOT_L) / BIN_COUNT;
type Dot = { x: number; y: number; v: number; bin: number; restY: number; rest: boolean };
let dots: Dot[] = [];
let reserved: number[] = [];
let landed: number[] = [];
let rnd = makeRng(SEED);
let spawned = 0;
let flat = false;
let round = 0;
// 표본 하나 — 균등 난수 n 개의 평균. 여러 개를 더할수록 가운데(0.5) 근처가 잦아진다
function sampleMean(n: number): number {
let s = 0;
for (let i = 0; i < n; i += 1) { s += rnd(); }
return s / n;
}
function reset(): void {
round += 1;
rnd = makeRng(SEED + round);
dots = [];
reserved = [];
landed = [];
for (let b = 0; b < BIN_COUNT; b += 1) { reserved.push(0); landed.push(0); }
spawned = 0;
}
// 점 하나 내보내기 — 칸을 고르고, 그 칸에서 몇 번째 자리에 앉을지 미리 잡아 둔다
function spawn(): void {
const u = sampleMean(flat ? 1 : MEAN_OF);
const bin = Math.min(BIN_COUNT - 1, Math.floor(u * BIN_COUNT));
const slot = reserved[bin];
reserved[bin] += 1;
const col = slot % DOT_COLS;
const row = Math.floor(slot / DOT_COLS);
const x = PLOT_L + bin * binW + (binW - (DOT_COLS - 1) * DOT_STEP) / 2 + col * DOT_STEP;
dots.push({ x: x, y: PLOT_T - 6 - rnd() * 40, v: 0, bin: bin, restY: PLOT_B - DOT_STEP / 2 - row * DOT_STEP, rest: false });
spawned += 1;
}
function step(): void {
const dt = FIXED_DT / 1000;
for (let k = 0; k < SPAWN_PER_STEP && spawned < DOT_N; k += 1) { spawn(); }
for (let i = 0; i < dots.length; i += 1) {
const d = dots[i];
if (d.rest) { continue; }
d.v += DROP_GRAVITY * dt;
d.y += d.v * dt;
// 제 자리(쌓인 높이)에 닿으면 튕기거나, 충분히 느리면 멈춰 쌓인다
if (d.y >= d.restY) {
d.y = d.restY;
if (d.v > REST_SPEED) { d.v = -d.v * BOUNCE_LOSS; }
else { d.v = 0; d.rest = true; landed[d.bin] += 1; }
}
}
}
function settle(): void {
while (spawned < DOT_N) { spawn(); }
for (let i = 0; i < dots.length; i += 1) {
const d = dots[i];
if (!d.rest) { d.rest = true; d.y = d.restY; d.v = 0; landed[d.bin] += 1; }
}
}
function report(): void {
const f = focusIdx();
if (f >= 0) { say(TXT_BIN + (f + 1) + ' · ' + landed[f] + ' / ' + spawned); } else { say(TXT_IDLE); }
}
function demoTick(t: number): void {
runSchedule(t, DEMO_LOOP, [200], function (): void { reset(); });
}
function draw(): void {
clearStage();
ctx.fillStyle = rgba(PAPER, 0.3);
ctx.fillRect(PLOT_L, PLOT_B, PLOT_R - PLOT_L, 1);
const f = focusIdx();
// 막대 — 칸마다 멈춘 점 줄 수만큼의 높이. 쌓인 점 기둥을 그대로 감싼다
for (let b = 0; b < BIN_COUNT; b += 1) {
const rows = Math.ceil(landed[b] / DOT_COLS);
const h = rows * DOT_STEP;
const x = PLOT_L + b * binW + 2;
const c = PAL[b % 3 === 0 ? 0 : (b % 3 === 1 ? 3 : 6)];
ctx.fillStyle = rgba(c, b === f ? 0.42 : 0.2);
barPath(ctx, x, PLOT_B, binW - 4, h + (h > 0 ? 4 : 0), 5);
ctx.fill();
if (b === f) {
ringStyle(b, 1);
ctx.stroke();
ctx.setLineDash([]);
}
if (landed[b] > 0) {
axisText(String(landed[b]), x + (binW - 4) / 2, PLOT_B - h - 12, 'center', b === f ? 1 : 0.7);
}
axisText(String(b + 1), x + (binW - 4) / 2, PLOT_B + 12, 'center', b === f ? 0.95 : 0.45);
}
// 점 — 떨어지는 동안은 밝게, 멈추면 칸 색으로
for (let i = 0; i < dots.length; i += 1) {
const d = dots[i];
const c = PAL[d.bin % 3 === 0 ? 0 : (d.bin % 3 === 1 ? 3 : 6)];
ctx.fillStyle = d.rest ? rgba(c, 1) : rgba(mix(c, PAPER, 0.55), 1);
ctx.beginPath();
ctx.arc(d.x, d.y, DOT_R, 0, TAU);
ctx.fill();
}
}
function after(): void {
if (still) { settle(); }
report();
draw();
if (flatBtn) { flatBtn.setAttribute('aria-pressed', flat ? 'true' : 'false'); }
}
function hitBin(x: number, y: number): number {
if (y < PLOT_T - 20 || y > PLOT_B + 20) { return -1; }
const b = Math.floor((x - PLOT_L) / binW);
return b >= 0 && b < BIN_COUNT ? b : -1;
}
bindKeys(function (d: number): void { sel = nextIdx(focusIdx(), d, BIN_COUNT); }, after);
bindPointer(hitBin, after);
if (replayBtn) { replayBtn.addEventListener('click', function (): void { wake(); reset(); after(); }); }
if (flatBtn) { flatBtn.addEventListener('click', function (): void { wake(); flat = !flat; reset(); after(); }); }
reset();
report();
let rafId = 0;
let lastTs = -1;
let acc = 0;
let clock = 0;
function frame(ts: number): void {
if (lastTs < 0) { lastTs = ts; }
// 탭이 숨었다 돌아와도 한 번에 100ms 까지만 따라잡는다 — 순간이동 대신 이어서 움직인다
acc += Math.min(ts - lastTs, 100);
lastTs = ts;
let n = 0;
while (acc >= FIXED_DT && n < 6) {
clock += FIXED_DT;
if (demo) { demoTick(clock); }
step();
acc -= FIXED_DT;
n += 1;
}
draw();
rafId = window.requestAnimationFrame(frame);
}
function startMotion(): void {
window.cancelAnimationFrame(rafId);
lastTs = -1;
acc = 0;
if (still) {
// 움직임 줄이기 — 루프를 돌리지 않고 지금 목표 상태로 바로 그린다
settle();
draw();
} else {
rafId = window.requestAnimationFrame(frame);
}
}
// 열린 페이지에서 움직임 줄이기 설정이 바뀌어도 그 자리에서 루프를 멈추거나 다시 켠다
function onMotionPref(): void {
still = reduceQuery.matches;
startMotion();
}
if (typeof reduceQuery.addEventListener === 'function') { reduceQuery.addEventListener('change', onMotionPref); }
startMotion();
return function (): void {
window.cancelAnimationFrame(rafId);
window.removeEventListener('resize', onResize);
if (typeof reduceQuery.removeEventListener === 'function') { reduceQuery.removeEventListener('change', onMotionPref); }
};
}, []);
return (
<div className={cx("bc") + " is-demo"} ref={rootRef}>
<canvas className={cx("bc__canvas")} data-role="canvas" width={480} height={300} tabIndex={0} aria-label="떨어진 점들이 칸마다 튕겼다 멈춰 쌓이며 히스토그램 막대가 되는 그래프. ←/→ 로 구간을 고르면 쌓인 점 수를 읽어 준다"></canvas>
<p className={cx("bc__status")} data-role="status" aria-live="off">구간을 고르면 쌓인 점 수를 읽어 줌</p>
<div className={cx("bc__tools")}>
<button className={cx("bc__btn")} data-role="replay" type="button">다시 떨어뜨리기</button>
<button className={cx("bc__btn")} data-role="flat" type="button" aria-pressed="false">균등 난수 하나로</button>
</div>
</div>
);
}08 Falling Dots That Pile Into Bins and Become a Histogram — Measured area 24.856% · moving frames 23/23Original by GODRICH · SCSS and React ship in the zip · Bar Chart Animation: 9 Demos From Spring to Race
The post this demo lives in
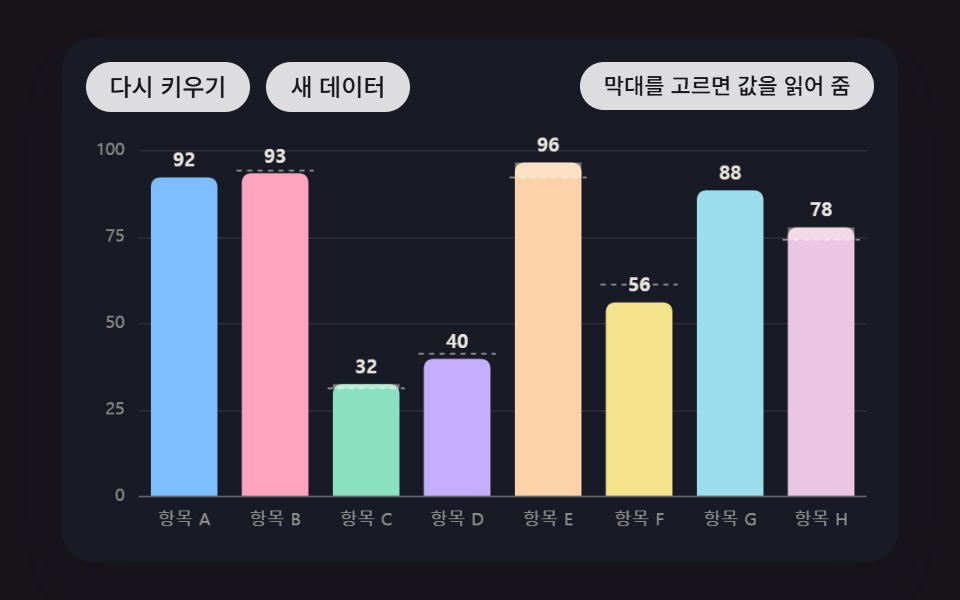 Bar Chart Animation: 9 Demos From Spring to RaceWhen bars jump straight to new values, the eye misses what grew. So 01 grows bars on a spring that overshoots once, 02 s See all demos in this post
If you like this effect - similar demos
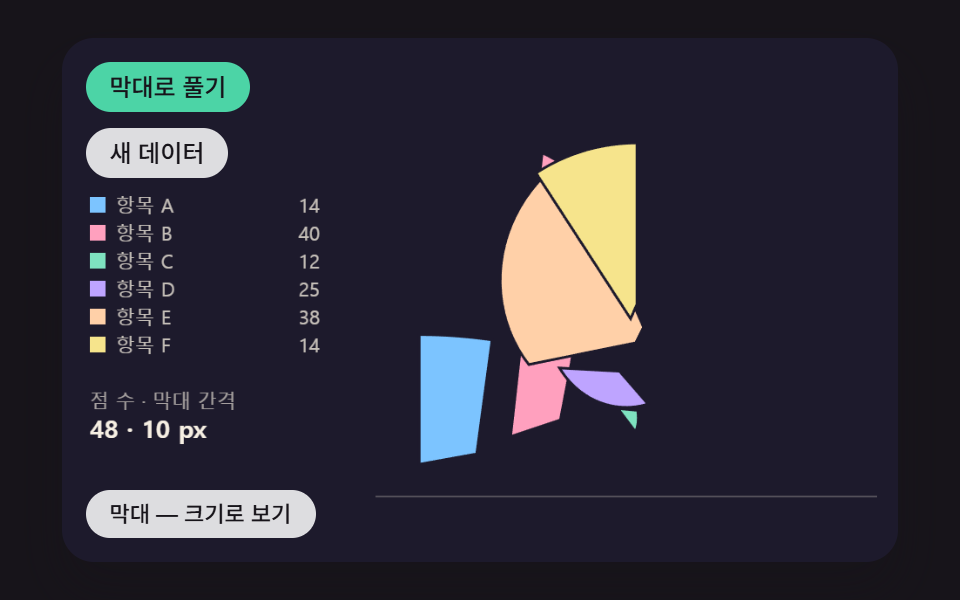 Dashboard UI06 A Pie Chart That Unrolls Into a Bar Chart, Slice by SlicePie Chart CSS: 9 Slices That Pop, Tilt and Morph
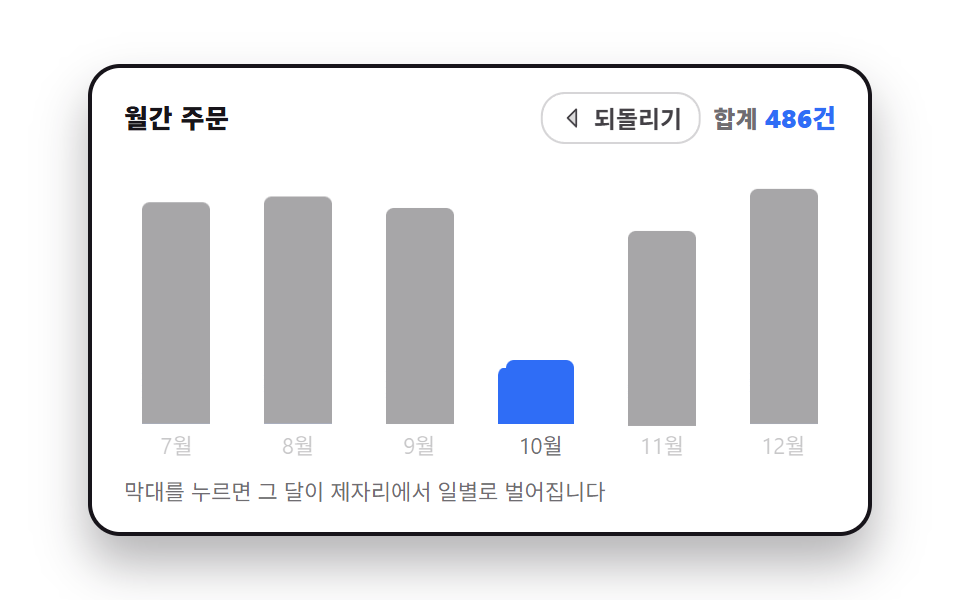 Dashboard UI04 A month bar splits into days where it standsChart UI Design: 9 Interactions You Can Drag
 Dashboard UI03 A Card That Settles Into Its Slot on ReleaseCSS Kanban Board: 9 Demos With Springs and Lerp