07A Motion Trail Joining Time Steps
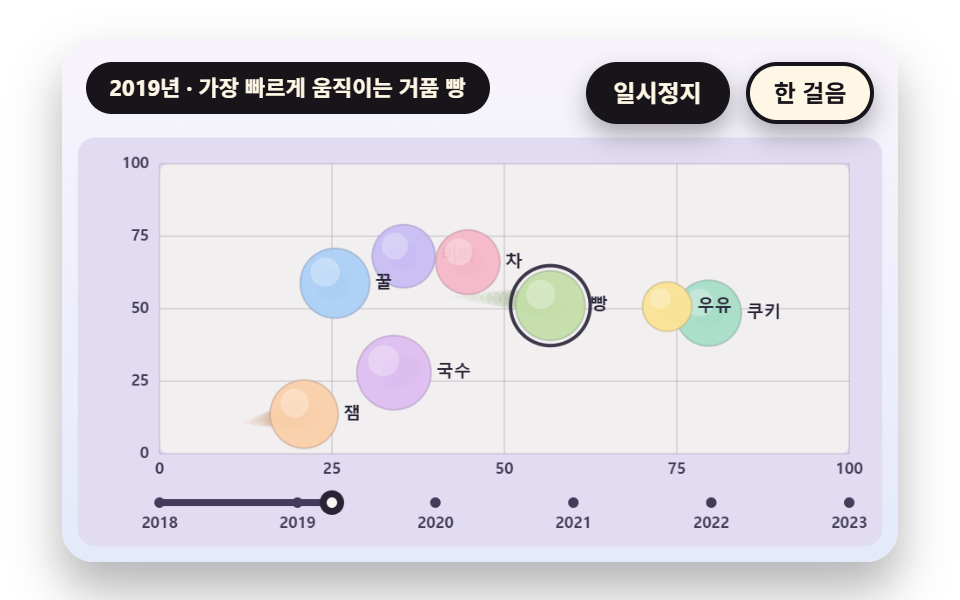
The three values given for each year are blended smoothly between time steps so a bubble slides across and changes size. Where it has been stays as TRAIL_LEN faint dots, showing direction and speed at a glance, and the timetable pushes the time slider in place of a hand.
Best forA statistics video showing the direction of change instead of a single point in time
TRAIL_LENsplineStepyearAt
<main class="stage">
<div class="vj is-demo" id="vj">
  <div class="vj__pad" data-role="pad" tabindex="0" role="application" aria-label="Bubble chart stage: arrow keys move between bubbles, Enter picks, P pauses, N steps once, R restarts">
    <canvas class="vj__canvas" data-role="canvas" width="480" height="300" role="img" aria-label="Eight bubbles slide along curves joining their horizontal, vertical and size values at six time steps, leaving a tail of sixteen faint dots where they have been. The fastest moving bubble gets an outline, and the time slider below is pushed by the timetable from 2018 to 2023"></canvas>
  </div>
  <p class="vj__status" data-role="status" aria-live="off">Bubble chart demo</p>
  <div class="vj__ctrl">
    <button class="vj__pause" data-role="pause" type="button" aria-pressed="false">Pause</button>
    <button class="vj__step" data-role="step" type="button">Step</button>
  </div>
  <p class="vj__done" data-role="done" role="status" aria-live="polite"></p>
</div>
</main>
@use "../../../../site/static/demo-tokens" as *;
@include stage($stage-paper);
.vj {
position: relative;
width: min(92vw, calc(160vh - 12.8vw));
aspect-ratio: 480 / 300;
margin: 0 auto;
border-radius: $r-card;
overflow: hidden;
box-shadow: $shadow-raised;
background: $subject-cream;
}
// 무대 상자 — 여기서 시작한 터치만 칸 누르기로 읽는다(touch-action: none 은 이 상자에만). 무대 밖 터치는 페이지 스크롤 그대로
.vj__pad {
position: absolute;
inset: 0;
border-radius: inherit;
outline: none;
touch-action: none;
cursor: pointer;
}
// 바깥 .vj 가 넘침을 자르므로 포커스 테두리는 안쪽으로 들인다
.vj__pad:focus-visible {
outline: 3px solid $subject-ink;
outline-offset: -3px;
}
.vj__canvas {
position: absolute;
inset: 0;
display: block;
width: 100%;
height: 100%;
}
.vj__ctrl {
position: absolute;
right: $sp-3;
top: $sp-3;
display: flex;
gap: $sp-2;
}
.vj__pause,
.vj__step {
padding: $sp-1 $sp-3;
border: 2px solid $subject-ink;
border-radius: $r-pill;
background: $subject-ink;
color: $subject-cream;
font-family: inherit;
font-weight: 700;
font-size: 12px;
line-height: 1.6;
cursor: pointer;
box-shadow: $shadow-press;
transition: transform $dur-quick $ease-spring;
}
.vj__step {
background: $subject-cream;
color: $subject-ink;
}
// 스크린리더에만 읽히는 완료 알림
.vj__done {
position: absolute;
width: 1px;
height: 1px;
margin: 0;
overflow: hidden;
clip-path: inset(50%);
white-space: nowrap;
}
// 눌린 상태(멈춤) — 바탕과 글자색을 뒤집어 aria-pressed 가 눈에도 보이게
.vj__pause[aria-pressed="true"] {
background: $subject-cream;
color: $subject-ink;
}
.vj__pause:hover,
.vj__step:hover {
transform: translateY(-2px);
}
.vj__pause:active,
.vj__step:active {
transform: translateY(1px);
}
.vj__pause:focus-visible,
.vj__step:focus-visible {
outline: 3px solid $subject-ink;
outline-offset: 3px;
}
// 상태 줄 — 지금 장면의 수치를 글자로. 시연 중에는 aria-live off, 사람이 처음 손대면 polite
.vj__status {
position: absolute;
left: $sp-3;
top: $sp-3;
max-width: calc(100% - 190px);
margin: 0;
padding: $sp-1 $sp-3;
border-radius: $r-pill;
background: $subject-ink;
color: $subject-cream;
font-weight: 700;
font-size: 11px;
line-height: 1.6;
white-space: nowrap;
overflow: hidden;
text-overflow: ellipsis;
pointer-events: none;
}
@media (max-width: 340px) {
.vj__pause,
.vj__step,
.vj__status { font-size: 10px; padding: 0 $sp-2; }
}
// 움직임 줄이기 — 장면은 스크립트가 정지 장면 한 장으로 멈춘다. 버튼도 떠오르지 않게
@media (prefers-reduced-motion: reduce) {
.vj__pause,
.vj__step { transition: none !important; }
.vj__pause:hover,
.vj__pause:active,
.vj__step:hover,
.vj__step:active { transform: none !important; }
}html, body {
margin: 0;
overflow: hidden;
}
.stage {
box-sizing: border-box;
min-height: 100vh;
display: grid;
place-items: center;
margin: 0;
background: #ffffff;
font-family: -apple-system, "Segoe UI", "Noto Sans KR", sans-serif;
padding: clamp(8px, 4vw, 24px);
}
.vj {
position: relative;
width: min(92vw, 160vh - 12.8vw);
aspect-ratio: 480/300;
margin: 0 auto;
border-radius: 16px;
overflow: hidden;
box-shadow: 0 14px 24px rgba(23, 20, 26, 0.32);
background: #fff7e6;
}
.vj__pad {
position: absolute;
inset: 0;
border-radius: inherit;
outline: none;
touch-action: none;
cursor: pointer;
}
.vj__pad:focus-visible {
outline: 3px solid #17141a;
outline-offset: -3px;
}
.vj__canvas {
position: absolute;
inset: 0;
display: block;
width: 100%;
height: 100%;
}
.vj__ctrl {
position: absolute;
right: 12px;
top: 12px;
display: flex;
gap: 8px;
}
.vj__pause,
.vj__step {
padding: 4px 12px;
border: 2px solid #17141a;
border-radius: 999px;
background: #17141a;
color: #fff7e6;
font-family: inherit;
font-weight: 700;
font-size: 12px;
line-height: 1.6;
cursor: pointer;
box-shadow: 0 6px 12px rgba(23, 20, 26, 0.32);
transition: transform 220ms cubic-bezier(0.2, 0.8, 0.2, 1);
}
.vj__step {
background: #fff7e6;
color: #17141a;
}
.vj__done {
position: absolute;
width: 1px;
height: 1px;
margin: 0;
overflow: hidden;
clip-path: inset(50%);
white-space: nowrap;
}
.vj__pause[aria-pressed=true] {
background: #fff7e6;
color: #17141a;
}
.vj__pause:hover,
.vj__step:hover {
transform: translateY(-2px);
}
.vj__pause:active,
.vj__step:active {
transform: translateY(1px);
}
.vj__pause:focus-visible,
.vj__step:focus-visible {
outline: 3px solid #17141a;
outline-offset: 3px;
}
.vj__status {
position: absolute;
left: 12px;
top: 12px;
max-width: calc(100% - 190px);
margin: 0;
padding: 4px 12px;
border-radius: 999px;
background: #17141a;
color: #fff7e6;
font-weight: 700;
font-size: 11px;
line-height: 1.6;
white-space: nowrap;
overflow: hidden;
text-overflow: ellipsis;
pointer-events: none;
}
@media (max-width: 340px) {
.vj__pause,
.vj__step,
.vj__status {
font-size: 10px;
padding: 0 8px;
}
}
@media (prefers-reduced-motion: reduce) {
.vj__pause,
.vj__step {
transition: none !important;
}
.vj__pause:hover,
.vj__pause:active,
.vj__step:hover,
.vj__step:active {
transform: none !important;
}
}(function () {
const root = document.getElementById("vj");
if (!root) return;
// 무대 좌표 — 캔버스 안 계산은 늘 480×300. 화면에 보이는 크기와 상관없다
const W = 480;
const H = 300;
const TAU = Math.PI * 2;
function clamp(v, lo, hi) { return v < lo ? lo : (v > hi ? hi : v); }
function lerp(a, b, k) { return a + (b - a) * k; }
function ease(x) { const c = clamp(x, 0, 1); return c * c * (3 - 2 * c); }
// 끝에서 한 번 넘쳤다 돌아오는 곡선 — 거품이 자리에 튀어 나올 때
function backOut(x) {
const c = clamp(x, 0, 1) - 1;
return 1 + 2.70158 * c * c * c + 1.70158 * c * c;
}
// 시드 고정 난수 — 선형 합동 생성기(곱 1664525, 더함 1013904223). 같은 시드면 같은 수열
function seeded(seed) {
let s = (seed >>> 0) || 1;
return function () {
s = (Math.imul(s, 1664525) + 1013904223) >>> 0;
return s / 4294967296;
};
}
// 파스텔 팔레트 — 거품은 연한 면, 글자는 늘 진한 잉크
const BG_TOP = [248, 244, 252];
const BG_BOT = [228, 234, 250];
const BED = [226, 220, 242];
const INK = [40, 36, 54];
const INK2 = [66, 60, 90];
const PAPER = [250, 246, 240];
const ROSE = [244, 162, 186];
const MINT = [148, 212, 182];
const TILES = [
[200, 190, 244], [168, 222, 200], [250, 228, 150], [246, 184, 200],
[172, 208, 246], [250, 208, 170], [196, 222, 170], [222, 190, 240],
];
function mix(a, b, k) { return [lerp(a[0], b[0], k), lerp(a[1], b[1], k), lerp(a[2], b[2], k)]; }
function rgba(c, a) {
return 'rgba(' + Math.round(clamp(c[0], 0, 255)) + ',' + Math.round(clamp(c[1], 0, 255)) + ',' + Math.round(clamp(c[2], 0, 255)) + ',' + clamp(a, 0, 1).toFixed(3) + ')';
}
// 장면 시계(초)·판 반복 번호·시간표 — 시간표는 (시각, 할 일) 목록이고 시각이 지나면 한 번씩 부른다
let sceneT = 0;
let lap = 0;
let script = [];
let evAt = 0;
// 겹침 한 번 풀기 — 두 원의 중심 거리 d 가 반지름 합에 gap 을 더한 값보다 작으면 모자란 만큼(o)을 두 원의 Size 비율로 나눠 서로 밀어낸다(작은 원이 더 많이 움직인다)
function relaxPass(bs, gap) {
for (let i = 0; i < bs.length; i += 1) {
for (let j = i + 1; j < bs.length; j += 1) {
const a = bs[i];
const b = bs[j];
let dx = b.x - a.x;
let dy = b.y - a.y;
let d = Math.sqrt(dx * dx + dy * dy);
const need = a.r + b.r + gap;
if (d >= need) {
continue;
}
if (d < 1e-6) {
dx = Math.cos(i * 2.399 + j * 1.131);
dy = Math.sin(i * 2.399 + j * 1.131);
d = 1;
}
const o = need - d;
const ux = dx / d;
const uy = dy / d;
const sa = b.r / (a.r + b.r);
const sb = a.r / (a.r + b.r);
a.x -= ux * o * sa;
a.y -= uy * o * sa;
b.x += ux * o * sb;
b.y += uy * o * sb;
}
}
}
// 판 안에 가두기 — 원 전체가 사각형 안에 있게 중심을 자른다
function keepIn(bs, R) {
for (const b of bs) {
b.x = clamp(b.x, R.x + b.r, R.x + R.w - b.r);
b.y = clamp(b.y, R.y + b.r, R.y + R.h - b.r);
}
}
// 겹침 합 — 모든 원 쌍에서 (반지름 합 - 중심 거리) 가 양수인 만큼을 더한 값. 0 이면 겹침이 없다
function overlapOf(bs) {
let s = 0;
for (let i = 0; i < bs.length; i += 1) {
for (let j = i + 1; j < bs.length; j += 1) {
const d = Math.hypot(bs[j].x - bs[i].x, bs[j].y - bs[i].y);
const o = bs[i].r + bs[j].r - d;
if (o > 0) {
s += o;
}
}
}
return s;
}
// 반복해서 풀기 — passes 번 겹침을 밀고, 매번 판 중심으로 pull 만큼 끌어당긴 뒤 판 안으로 자른다. 끝난 뒤 남은 겹침 합을 돌려준다
function relax(bs, R, passes, gap, pull) {
const cx = R.x + R.w / 2;
const cy = R.y + R.h / 2;
for (let p = 0; p < passes; p += 1) {
relaxPass(bs, gap);
if (pull > 0) {
for (const b of bs) {
b.x += (cx - b.x) * pull;
b.y += (cy - b.y) * pull;
}
}
keepIn(bs, R);
}
return overlapOf(bs);
}
function sumOf(vals) { let s = 0; for (const v of vals) {
s += v;
} return s; }
function r1(v) { return String(Math.round(v * 10) / 10); }
// ── 자체 가상 데이터 ──────────────────────────────────────
const NAMES = [
'Butter', 'Cookie', 'Milk', 'Tea', 'Honey', 'Jam', 'Bread', 'Noodle', 'Rice', 'Nori', 'Bean', 'Citrus',
'Pear', 'Chestnut', 'Sesame', 'Adzuki', 'Grain', 'Salt', 'Vinegar', 'Tofu', 'Kelp', 'Squash', 'Persimmon', 'Mugwort',
];
// ── 글자 폭 어림 ──────────────────────────────────────────
// 한글·한자·가나는 글자 크기만큼, 로마자는 0.56 배로 어림한다 — 실제 폭을 재지 않고 문자 수에서 곧바로 구한다
function glyphW(s, px) {
let w = 0;
for (let i = 0; i < s.length; i += 1) {
w += (s.charCodeAt(i) >= 0x2e80 ? 1 : 0.56) * px;
}
return w;
}
// 문구 틀의 {a}·{b} 자리에 값을 끼운다 — 화면 문구는 늘 이 틀 한 줄로 두고 로케일 사전이 통째로 바꾼다
function fill(s, a, b) { return s.replace('{a}', a).replace('{b}', b === undefined ? '' : b); }
const canvasEl = root.querySelector('[data-role="canvas"]');
const padEl = root.querySelector('[data-role="pad"]');
const pauseEl = root.querySelector('[data-role="pause"]');
const statusEl = root.querySelector('[data-role="status"]');
const stepEl = root.querySelector('[data-role="step"]');
const doneEl = root.querySelector('[data-role="done"]');
const ctxRaw = canvasEl ? canvasEl.getContext('2d') : null;
if (!canvasEl || !ctxRaw || !pauseEl || !padEl || !stepEl || !doneEl) {
return;
}
const cv = canvasEl;
const ctx = ctxRaw;
const pauseBtn = pauseEl;
const stepBtn = stepEl;
const doneP = doneEl;
const pad = padEl;
// 외부 웹폰트는 부르지 않는다 — 기기에 있는 글꼴 목록만
const FONT_STACK = 'system-ui, -apple-system, "Segoe UI", "Noto Sans KR", sans-serif';
let dpr = 1;
function fitCanvas() {
// 배율은 2 에서 자른다 — 배율 3 기기에서 화소가 2.25배로 늘지 않게
dpr = Math.min(window.devicePixelRatio || 1, 2);
cv.width = Math.round(W * dpr);
cv.height = Math.round(H * dpr);
ctx.setTransform(dpr, 0, 0, dpr, 0, 0);
}
function skyFill(top, bot) {
const g = ctx.createLinearGradient(0, 0, 0, H);
g.addColorStop(0, rgba(top, 1));
g.addColorStop(1, rgba(bot, 1));
ctx.fillStyle = g;
ctx.fillRect(0, 0, W, H);
}
function disc(x, y, r, c, a) {
if (r <= 0.2 || a <= 0) {
return;
}
ctx.beginPath();
ctx.arc(x, y, r, 0, TAU);
ctx.fillStyle = rgba(c, a);
ctx.fill();
}
function box(x, y, w, h, r, c, a) {
if (w <= 0.2 || h <= 0.2 || a <= 0) {
return;
}
ctx.beginPath();
ctx.roundRect(x, y, w, h, Math.max(0, Math.min(r, w / 2, h / 2)));
ctx.fillStyle = rgba(c, a);
ctx.fill();
}
function outline(x, y, w, h, r, width, c, a) {
if (w <= 0.2 || h <= 0.2 || a <= 0) {
return;
}
ctx.beginPath();
ctx.roundRect(x, y, w, h, Math.max(0, Math.min(r, w / 2, h / 2)));
ctx.lineWidth = width;
ctx.strokeStyle = rgba(c, a);
ctx.stroke();
}
function text(s, x, y, c, a, px, weight, align) {
ctx.font = weight + ' ' + px + 'px ' + FONT_STACK;
ctx.textAlign = align;
ctx.textBaseline = 'middle';
ctx.fillStyle = rgba(c, a);
ctx.fillText(s, x, y);
}
// 글자 이름표 — 바탕 알약 위에 글자
function tag(s, x, y, bg, fg, px, align) {
ctx.font = '700 ' + px + 'px ' + FONT_STACK;
const w = ctx.measureText(s).width + px * 1.1;
const left = align === 'center' ? x - w / 2 : (align === 'right' ? x - w : x);
box(left, y - px * 0.82, w, px * 1.64, px * 0.82, bg, 0.92);
text(s, left + w / 2, y + 0.5, fg, 1, px, 700, 'center');
}
// 판 자리 — 왼쪽 판·오른쪽 판(대비판)·한 판짜리 히어로. 위쪽은 상태 줄·버튼 자리
const PANEL_L = { x: 12, y: 78, w: 222, h: 208 };
const PANEL_R = { x: 246, y: 78, w: 222, h: 208 };
const PANEL_ONE = { x: 12, y: 60, w: 456, h: 228 };
// 판 바닥 — 칸 사이 틈으로 비치는 연보라
function bed(R) {
box(R.x - 3, R.y - 3, R.w + 6, R.h + 6, 10, BED, 1);
}
function panelTags(a, b) {
tag(a, PANEL_L.x + PANEL_L.w / 2, 66, INK, PAPER, 10, 'center');
tag(b, PANEL_R.x + PANEL_R.w / 2, 66, PAPER, INK, 10, 'center');
}
// 거품 한 개 — 면, 왼쪽 위 하이라이트, 옅은 윤곽
function orb(x, y, r, c, a) {
if (r <= 0.3 || a <= 0) {
return;
}
disc(x, y, r, c, a);
if (r > 5) {
disc(x - r * 0.28, y - r * 0.32, r * 0.42, [255, 255, 255], 0.3 * a);
}
ctx.beginPath();
ctx.arc(x, y, r, 0, TAU);
ctx.lineWidth = 1;
ctx.strokeStyle = rgba(mix(c, INK, 0.28), 0.55 * a);
ctx.stroke();
}
function line(x0, y0, x1, y1, width, c, a) {
if (a <= 0) {
return;
}
ctx.beginPath();
ctx.moveTo(x0, y0);
ctx.lineTo(x1, y1);
ctx.lineWidth = width;
ctx.strokeStyle = rgba(c, a);
ctx.stroke();
}
function ring(x, y, r, width, c, a) {
if (r <= 0.3 || a <= 0) {
return;
}
ctx.beginPath();
ctx.arc(x, y, r, 0, TAU);
ctx.lineWidth = width;
ctx.strokeStyle = rgba(c, a);
ctx.stroke();
}
function ballHit(b, label) {
return { x: b.x - b.r, y: b.y - b.r, w: b.r * 2, h: b.r * 2, label: label };
}
let shownStatus = '';
function pushStatus(s) {
if (!statusEl || s === shownStatus) {
return;
}
shownStatus = s;
statusEl.textContent = s;
}
let paused = false;
const reduceQuery = window.matchMedia('(prefers-reduced-motion: reduce)');
// 페이지를 연 채 움직임 줄이기 설정을 바꿔도 change 리스너가 다시 읽는다
let still = reduceQuery.matches;
// 자동 시연 표시 — 사람이 처음 손대면 떼고 상태 줄을 polite 로 켠다
let demo = root.classList.contains('is-demo');
const off = new AbortController();
// 사람이 직접 하는 중이면 시간표는 멈추고 애니메이션만 흐른다
let manual = false;
// curOn 이면 키보드 칸 고르기가 켜진 것 — ki 가 hits() 안 번호
let curOn = false;
let ki = 0;
function wake() {
if (!demo) {
return;
}
demo = false;
root.classList.remove('is-demo');
if (statusEl) {
statusEl.setAttribute('aria-live', 'polite');
}
}
function takeOver() {
if (manual) {
return;
}
manual = true;
onTake();
wake();
if (!curOn) {
curOn = true;
ki = 0;
}
}
// 한 판 시연이 끝났음을 스크린리더에 한 번만 알린다 — 판이 되풀이돼도 다시 읽지 않는다
let doneSaid = false;
function checkDone() {
if (!manual && !doneSaid && sceneT >= LAP_S - 0.6) {
doneSaid = true;
doneP.textContent = statusText();
}
}
function advance(dt) {
sceneT += dt;
if (!manual) {
while (evAt < script.length && script[evAt].t <= sceneT) {
const ev = script[evAt];
evAt += 1;
ev.f();
}
if (sceneT >= LAP_S) {
lap += 1;
begin();
return;
}
}
update(dt);
}
// 첫 판은 START_S 만큼 앞서 시작한다 — 칸이 이미 움직이는 중인 장면에서 보인다
function runTo(t) {
while (sceneT < t - 1e-6) {
advance(Math.min(1 / 30, t - sceneT));
}
}
function begin() {
sceneT = 0;
evAt = 0;
script = [];
build();
if (lap === 0 && !still) {
runTo(START_S);
}
}
const DT_MAX = 0.05;
const SETTLE_FRAMES = 8;
const SETTLE_DT = 0.04;
function drawCursor() {
if (!curOn) {
return;
}
const hs = hits();
if (hs.length === 0) {
return;
}
const h = hs[clamp(ki, 0, hs.length - 1)];
outline(h.x + 1, h.y + 1, h.w - 2, h.h - 2, 5, 3, INK, 1);
outline(h.x - 1, h.y - 1, h.w + 2, h.h + 2, 6, 1.5, PAPER, 0.9);
}
function cursorLabel() {
const hs = hits();
return hs.length === 0 ? statusText() : hs[clamp(ki, 0, hs.length - 1)].label;
}
function showNow() {
draw();
drawCursor();
pushStatus(curOn ? cursorLabel() : statusText());
checkDone();
}
let rafId = 0;
let lastTs = -1;
function frame(ts) {
if (still || paused) {
rafId = 0;
return;
}
if (lastTs < 0) {
lastTs = ts;
}
const dt = Math.min((ts - lastTs) / 1000, DT_MAX);
lastTs = ts;
if (dt > 0) {
advance(dt);
}
showNow();
rafId = window.requestAnimationFrame(frame);
}
function startLoop() {
if (rafId) {
return;
}
// 멈췄던 사이의 시간을 첫 프레임 dt 로 넘기지 않는다
lastTs = -1;
rafId = window.requestAnimationFrame(frame);
}
function stopLoop() {
if (rafId) {
window.cancelAnimationFrame(rafId);
rafId = 0;
}
}
// 움직임 줄이기 — 루프 없이 배치가 끝난 정지 장면 한 장
function showRest() {
stopLoop();
lap = 0;
sceneT = 0;
evAt = 0;
script = [];
build();
runTo(REST_S);
showNow();
}
// 움직임 줄이기이거나 멈춘 채 입력이 들어오면 트윈 없이 곧바로 끝 배치로 — 시간을 3초 흘려 스프링·애니메이션을 다 끝낸다
function settleStill() {
for (let k = 0; k < 90; k += 1) {
sceneT += 1 / 30;
update(1 / 30);
}
}
function play() {
begin();
showNow();
if (!paused) {
startLoop();
}
}
function togglePause() {
paused = !paused;
pauseBtn.setAttribute('aria-pressed', paused ? 'true' : 'false');
wake();
if (paused) {
stopLoop();
}
else if (!still) {
startLoop();
}
}
function restart() {
manual = false;
curOn = false;
doneSaid = false;
lap += 1;
begin();
for (let k = 0; k < SETTLE_FRAMES; k += 1) {
update(SETTLE_DT);
}
showNow();
}
// Step — 멈춘 채 시간표의 다음 일 하나를 부른다. 더 부를 일이 없거나 직접 하던 중이면 다음 판을 연다
function stepOnce() {
wake();
if (!paused) {
paused = true;
pauseBtn.setAttribute('aria-pressed', 'true');
stopLoop();
}
if (manual || evAt >= script.length) {
restart();
return;
}
sceneT = Math.max(sceneT, script[evAt].t);
advance(0);
for (let k = 0; k < SETTLE_FRAMES; k += 1) {
sceneT += SETTLE_DT;
update(SETTLE_DT);
}
showNow();
}
function moveCur(d) {
const n = hits().length;
if (n === 0) {
return;
}
ki = (ki + d + n) % n;
}
function actCur(i) {
onAct(i);
// 멈춘 채·움직임 줄이기에서도 입력이 화면에 바로 반영되게 한다
if (still || paused) {
settleStill();
}
}
pauseBtn.addEventListener('click', togglePause, { signal: off.signal });
stepBtn.addEventListener('click', stepOnce, { signal: off.signal });
// 키보드 — 무대에 포커스가 있을 때만. 방향키는 칸 이동, Enter·Space 는 칸 고르기, P 는 Pause, N 은 Step, R 은 다시
pad.addEventListener('keydown', function (e) {
if (e.altKey || e.ctrlKey || e.metaKey) {
return;
}
const k = e.key;
if (k === 'ArrowLeft' || k === 'ArrowUp') {
e.preventDefault();
takeOver();
moveCur(-1);
showNow();
}
else if (k === 'ArrowRight' || k === 'ArrowDown') {
e.preventDefault();
takeOver();
moveCur(1);
showNow();
}
else if (k === 'Enter' || k === ' ') {
e.preventDefault();
takeOver();
actCur(ki);
showNow();
}
else if (k === 'p' || k === 'P') {
togglePause();
}
else if (k === 'n' || k === 'N') {
stepOnce();
}
else if (k === 'r' || k === 'R') {
restart();
}
}, { signal: off.signal });
// 마우스·터치 — 누른 자리의 칸을 고른다
pad.addEventListener('click', function (e) {
const rect = cv.getBoundingClientRect();
const px = (e.clientX - rect.left) / rect.width * W;
const py = (e.clientY - rect.top) / rect.height * H;
const hs = hits();
let at = -1;
for (let i = 0; i < hs.length; i += 1) {
if (px >= hs[i].x && px <= hs[i].x + hs[i].w && py >= hs[i].y && py <= hs[i].y + hs[i].h) {
at = i;
}
}
if (at < 0) {
return;
}
takeOver();
ki = at;
actCur(at);
showNow();
}, { signal: off.signal });
// 탭이 숨으면 멈추고, 돌아오면 시계를 다시 맞춰 시작 — 숨은 동안의 몇 초가 한 프레임에 몰리지 않게
document.addEventListener('visibilitychange', function () {
if (document.hidden) {
stopLoop();
}
else if (!paused && !still) {
startLoop();
}
}, { signal: off.signal });
// 설정이 바뀌면 — 켜지면 배치가 끝난 한 장, 꺼지면 다시 움직인다
reduceQuery.addEventListener('change', function () {
still = reduceQuery.matches;
if (still) {
showRest();
}
else {
lap = 0;
play();
}
}, { signal: off.signal });
window.addEventListener('resize', function () {
fitCanvas();
showNow();
}, { signal: off.signal });
// 07 — 시점마다 주어진 가로·세로·크기를 시점 사이에서 곡선(splineStep)으로 매끈하게 이어 거품이 미끄러지게 한다. 지나온 자리는 TRAIL_LEN 개의 옅은 점으로 남기고, 시점 슬라이더는 시간표가 대신 민다
const TRAIL_LEN = 16;
const TRAIL_S = 0.07;
const KEYS = 6;
const N = 8;
const YEAR0 = 2018;
const LAP_S = 10;
const START_S = 1.6;
const REST_S = 6.0;
const PLOT = { x: 56, y: 72, w: 396, h: 166 };
const TRACK_Y = 266;
let data = [];
let trails = [];
let yearPos = 0;
let yTgt = 0;
let manualYear = false;
let acc = 0;
// 네 점(앞 · 시작 · 끝 · 뒤)을 지나 두 시점 사이를 잇는 3Tea 곡선 — pos 는 0 부터 KEYS - 1 까지의 소수 위치
function splineStep(a, pos) {
const i = Math.min(Math.floor(pos), a.length - 2);
const u = pos - i;
const p0 = a[Math.max(i - 1, 0)];
const p1 = a[i];
const p2 = a[i + 1];
const p3 = a[Math.min(i + 2, a.length - 1)];
return 0.5 * ((2 * p1) + (-p0 + p2) * u + (2 * p0 - 5 * p1 + 4 * p2 - p3) * u * u + (-p0 + 3 * p1 - 3 * p2 + p3) * u * u * u);
}
// 시간표 → 시점 위치 — 0.5초에서 7.6초까지 부드럽게 한 번 지나간다
function yearAt(t) { return (KEYS - 1) * ease((t - 0.5) / 7.1); }
function build() {
const rnd = seeded(71 + (lap % 3) * 23);
data = [];
for (let i = 0; i < N; i += 1) {
const d = { xs: [], ys: [], ss: [] };
const x0 = 12 + rnd() * 60;
const y0 = 12 + rnd() * 70;
const s0 = 8 + rnd() * 30;
const dx = (rnd() - 0.25) * 14;
const dy = (rnd() - 0.4) * 12;
const ds = (rnd() - 0.3) * 8;
for (let k = 0; k < KEYS; k += 1) {
d.xs.push(clamp(x0 + dx * k + 7 * Math.sin(k * 1.3 + i), 4, 96));
d.ys.push(clamp(y0 + dy * k + 6 * Math.cos(k * 1.1 + i * 2), 4, 96));
d.ss.push(Math.max(4, s0 + ds * k));
}
data.push(d);
}
trails = data.map(function () { return []; });
yearPos = 0;
yTgt = 0;
manualYear = false;
acc = 0;
}
function sx(v) { return PLOT.x + PLOT.w * v / 100; }
function sy(v) { return PLOT.y + PLOT.h - PLOT.h * v / 100; }
function rOf(s) { return 3.6 * Math.sqrt(Math.max(s, 1)); }
function pose(i, pos) {
return [sx(splineStep(data[i].xs, pos)), sy(splineStep(data[i].ys, pos)), rOf(splineStep(data[i].ss, pos))];
}
function update(dt) {
if (dt <= 0) {
return;
}
if (manualYear) {
yearPos += (yTgt - yearPos) * (1 - Math.exp(-4 * dt));
}
else {
yearPos = yearAt(sceneT);
}
yearPos = clamp(yearPos, 0, KEYS - 1);
acc += dt;
while (acc >= TRAIL_S) {
acc -= TRAIL_S;
for (let i = 0; i < N; i += 1) {
trails[i].push(pose(i, yearPos));
if (trails[i].length > TRAIL_LEN) {
trails[i].shift();
}
}
}
}
function fastest() {
let best = 0;
let bd = -1;
for (let i = 0; i < N; i += 1) {
const a = pose(i, yearPos);
const b = pose(i, Math.max(0, yearPos - 0.3));
const d = Math.hypot(a[0] - b[0], a[1] - b[1]);
if (d > bd) {
bd = d;
best = i;
}
}
return best;
}
function draw() {
skyFill(BG_TOP, BG_BOT);
bed(PANEL_ONE);
box(PLOT.x, PLOT.y, PLOT.w, PLOT.h, 6, PAPER, 0.7);
for (let v = 0; v <= 100; v += 25) {
line(sx(v), PLOT.y, sx(v), PLOT.y + PLOT.h, 1, INK2, 0.14);
line(PLOT.x, sy(v), PLOT.x + PLOT.w, sy(v), 1, INK2, 0.14);
text(String(v), sx(v), PLOT.y + PLOT.h + 9, INK2, 1, 9, 700, 'center');
text(String(v), PLOT.x - 6, sy(v), INK2, 1, 9, 700, 'right');
}
// 이동 꼬리 — 오래된 점일수록 작고 옅다
for (let i = 0; i < N; i += 1) {
const tr = trails[i];
for (let k = 0; k < tr.length; k += 1) {
const f = (k + 1) / (tr.length + 1);
if (k > 0) {
line(tr[k - 1][0], tr[k - 1][1], tr[k][0], tr[k][1], 1.5, TILES[i % 8], 0.5 * f);
}
disc(tr[k][0], tr[k][1], Math.max(1.5, tr[k][2] * 0.5 * f), mix(TILES[i % 8], INK, 0.2), 0.5 * f);
}
}
const fi = fastest();
for (let i = 0; i < N; i += 1) {
const p = pose(i, yearPos);
orb(p[0], p[1], p[2], TILES[i % 8], 0.95);
text(NAMES[i], p[0] + p[2] + 3, p[1], INK, 1, 10, 700, 'left');
}
const pf = pose(fi, yearPos);
ring(pf[0], pf[1], pf[2] + 3, 2, INK, 0.9);
// 시점 슬라이더 — 시간표가 민다. 칸은 시점마다 하나
line(PLOT.x, TRACK_Y, PLOT.x + PLOT.w, TRACK_Y, 4, BED, 1);
line(PLOT.x, TRACK_Y, PLOT.x + PLOT.w * yearPos / (KEYS - 1), TRACK_Y, 4, INK2, 1);
for (let k = 0; k < KEYS; k += 1) {
const tx = PLOT.x + PLOT.w * k / (KEYS - 1);
disc(tx, TRACK_Y, 3, INK2, 1);
text(String(YEAR0 + k), tx, TRACK_Y + 12, INK2, 1, 9, 700, 'center');
}
const kx = PLOT.x + PLOT.w * yearPos / (KEYS - 1);
disc(kx, TRACK_Y, 7, INK, 1);
disc(kx, TRACK_Y, 3, PAPER, 1);
}
function statusText() {
return '{a} · fastest moving bubble {b}'.replace('{a}', String(YEAR0 + Math.round(yearPos))).replace('{b}', NAMES[fastest()]);
}
function hits() {
return data.map(function (_d, i) {
const p = pose(i, yearPos);
const pos = clamp(yearPos, 0, KEYS - 1);
return ballHit({ x: p[0], y: p[1], r: p[2], v: 0, g: i }, '{n} · {y} x {x} · y {v} · size {s}'.replace('{n}', NAMES[i]).replace('{y}', String(YEAR0 + Math.round(pos))).replace('{x}', String(Math.round(splineStep(data[i].xs, pos)))).replace('{v}', String(Math.round(splineStep(data[i].ys, pos)))).replace('{s}', String(Math.round(splineStep(data[i].ss, pos)))));
});
}
// 직접 고르면 시점을 한 칸 앞으로 — 끝이면 처음으로
function onAct(_i) { yTgt = (Math.round(yTgt) + 1) % KEYS; }
function onTake() { manualYear = true; yTgt = Math.round(yearPos); }
fitCanvas();
if (still) {
showRest();
}
else {
play();
}
return function () {
stopLoop();
off.abort();
};
})();// YearStepMotionTrailInterp - 같은 항목 vanilla index.html 의 React 판. 같은 계산을 useEffect 안에서 돌린다
import { useEffect, useRef } from "react";
import styles from "./YearStepMotionTrailInterp.module.scss";
const cx = (s: string): string => s.split(" ").map((n) => styles[n] ?? n).join(" ");
export default function YearStepMotionTrailInterp() {
const rootRef = useRef<HTMLDivElement | null>(null);
useEffect(() => {
const rootEl = rootRef.current;
if (!rootEl) return;
const root: HTMLElement = rootEl;
type RGB = [number, number, number];
type RGBA = [number, number, number, number];
// 무대 좌표 — 캔버스 안 계산은 늘 480×300. 화면에 보이는 크기와 상관없다
const W = 480;
const H = 300;
const TAU = Math.PI * 2;
function clamp(v: number, lo: number, hi: number): number { return v < lo ? lo : (v > hi ? hi : v); }
function lerp(a: number, b: number, k: number): number { return a + (b - a) * k; }
function ease(x: number): number { const c = clamp(x, 0, 1); return c * c * (3 - 2 * c); }
// 끝에서 한 번 넘쳤다 돌아오는 곡선 — 거품이 자리에 튀어 나올 때
function backOut(x: number): number {
const c = clamp(x, 0, 1) - 1;
return 1 + 2.70158 * c * c * c + 1.70158 * c * c;
}
// 시드 고정 난수 — 선형 합동 생성기(곱 1664525, 더함 1013904223). 같은 시드면 같은 수열
function seeded(seed: number): () => number {
let s = (seed >>> 0) || 1;
return function (): number {
s = (Math.imul(s, 1664525) + 1013904223) >>> 0;
return s / 4294967296;
};
}
// 파스텔 팔레트 — 거품은 연한 면, 글자는 늘 진한 잉크
const BG_TOP: RGB = [248, 244, 252];
const BG_BOT: RGB = [228, 234, 250];
const BED: RGB = [226, 220, 242];
const INK: RGB = [40, 36, 54];
const INK2: RGB = [66, 60, 90];
const PAPER: RGB = [250, 246, 240];
const ROSE: RGB = [244, 162, 186];
const MINT: RGB = [148, 212, 182];
const TILES: RGB[] = [
[200, 190, 244], [168, 222, 200], [250, 228, 150], [246, 184, 200],
[172, 208, 246], [250, 208, 170], [196, 222, 170], [222, 190, 240],
];
function mix(a: RGB, b: RGB, k: number): RGB { return [lerp(a[0], b[0], k), lerp(a[1], b[1], k), lerp(a[2], b[2], k)]; }
function rgba(c: RGB, a: number): string {
return 'rgba(' + Math.round(clamp(c[0], 0, 255)) + ',' + Math.round(clamp(c[1], 0, 255)) + ',' + Math.round(clamp(c[2], 0, 255)) + ',' + clamp(a, 0, 1).toFixed(3) + ')';
}
// 장면 시계(초)·판 반복 번호·시간표 — 시간표는 (시각, 할 일) 목록이고 시각이 지나면 한 번씩 부른다
let sceneT = 0;
let lap = 0;
type Ev = { t: number; f: () => void };
let script: Ev[] = [];
let evAt = 0;
type Rect = { x: number; y: number; w: number; h: number };
// 키보드·클릭 대상 — 거품 하나의 사각형(캔버스 좌표)과 읽어 줄 문장
type Hit = { x: number; y: number; w: number; h: number; label: string };
// ── 거품 계산 ─────────────────────────────────────────────
// 거품 하나 — 중심 (x, y), 반지름 r, 값 v, 묶음 번호 g
type Ball = { x: number; y: number; r: number; v: number; g: number };
// 겹침 한 번 풀기 — 두 원의 중심 거리 d 가 반지름 합에 gap 을 더한 값보다 작으면 모자란 만큼(o)을 두 원의 크기 비율로 나눠 서로 밀어낸다(작은 원이 더 많이 움직인다)
function relaxPass(bs: Ball[], gap: number): void {
for (let i = 0; i < bs.length; i += 1) {
for (let j = i + 1; j < bs.length; j += 1) {
const a = bs[i];
const b = bs[j];
let dx = b.x - a.x;
let dy = b.y - a.y;
let d = Math.sqrt(dx * dx + dy * dy);
const need = a.r + b.r + gap;
if (d >= need) { continue; }
if (d < 1e-6) { dx = Math.cos(i * 2.399 + j * 1.131); dy = Math.sin(i * 2.399 + j * 1.131); d = 1; }
const o = need - d;
const ux = dx / d;
const uy = dy / d;
const sa = b.r / (a.r + b.r);
const sb = a.r / (a.r + b.r);
a.x -= ux * o * sa;
a.y -= uy * o * sa;
b.x += ux * o * sb;
b.y += uy * o * sb;
}
}
}
// 판 안에 가두기 — 원 전체가 사각형 안에 있게 중심을 자른다
function keepIn(bs: Ball[], R: Rect): void {
for (const b of bs) {
b.x = clamp(b.x, R.x + b.r, R.x + R.w - b.r);
b.y = clamp(b.y, R.y + b.r, R.y + R.h - b.r);
}
}
// 겹침 합 — 모든 원 쌍에서 (반지름 합 - 중심 거리) 가 양수인 만큼을 더한 값. 0 이면 겹침이 없다
function overlapOf(bs: Ball[]): number {
let s = 0;
for (let i = 0; i < bs.length; i += 1) {
for (let j = i + 1; j < bs.length; j += 1) {
const d = Math.hypot(bs[j].x - bs[i].x, bs[j].y - bs[i].y);
const o = bs[i].r + bs[j].r - d;
if (o > 0) { s += o; }
}
}
return s;
}
// 반복해서 풀기 — passes 번 겹침을 밀고, 매번 판 중심으로 pull 만큼 끌어당긴 뒤 판 안으로 자른다. 끝난 뒤 남은 겹침 합을 돌려준다
function relax(bs: Ball[], R: Rect, passes: number, gap: number, pull: number): number {
const cx = R.x + R.w / 2;
const cy = R.y + R.h / 2;
for (let p = 0; p < passes; p += 1) {
relaxPass(bs, gap);
if (pull > 0) {
for (const b of bs) { b.x += (cx - b.x) * pull; b.y += (cy - b.y) * pull; }
}
keepIn(bs, R);
}
return overlapOf(bs);
}
function sumOf(vals: number[]): number { let s = 0; for (const v of vals) { s += v; } return s; }
function r1(v: number): string { return String(Math.round(v * 10) / 10); }
// ── 자체 가상 데이터 ──────────────────────────────────────
const NAMES: string[] = [
'버터', '쿠키', '우유', '차', '꿀', '잼', '빵', '국수', '밥', '김', '콩', '귤',
'배', '밤', '깨', '팥', '쌀', '소금', '식초', '두부', '미역', '호박', '감', '쑥',
];
// ── 글자 폭 어림 ──────────────────────────────────────────
// 한글·한자·가나는 글자 크기만큼, 로마자는 0.56 배로 어림한다 — 실제 폭을 재지 않고 문자 수에서 곧바로 구한다
function glyphW(s: string, px: number): number {
let w = 0;
for (let i = 0; i < s.length; i += 1) { w += (s.charCodeAt(i) >= 0x2e80 ? 1 : 0.56) * px; }
return w;
}
// 문구 틀의 {a}·{b} 자리에 값을 끼운다 — 화면 문구는 늘 이 틀 한 줄로 두고 로케일 사전이 통째로 바꾼다
function fill(s: string, a: string, b?: string): string { return s.replace('{a}', a).replace('{b}', b === undefined ? '' : b); }
const canvasEl = root.querySelector('[data-role="canvas"]') as HTMLCanvasElement | null;
const padEl = root.querySelector('[data-role="pad"]') as HTMLElement | null;
const pauseEl = root.querySelector('[data-role="pause"]') as HTMLButtonElement | null;
const statusEl = root.querySelector('[data-role="status"]') as HTMLElement | null;
const stepEl = root.querySelector('[data-role="step"]') as HTMLButtonElement | null;
const doneEl = root.querySelector('[data-role="done"]') as HTMLElement | null;
const ctxRaw = canvasEl ? canvasEl.getContext('2d') : null;
if (!canvasEl || !ctxRaw || !pauseEl || !padEl || !stepEl || !doneEl) { return; }
const cv: HTMLCanvasElement = canvasEl;
const ctx: CanvasRenderingContext2D = ctxRaw;
const pauseBtn: HTMLButtonElement = pauseEl;
const stepBtn: HTMLButtonElement = stepEl;
const doneP: HTMLElement = doneEl;
const pad: HTMLElement = padEl;
// 외부 웹폰트는 부르지 않는다 — 기기에 있는 글꼴 목록만
const FONT_STACK = 'system-ui, -apple-system, "Segoe UI", "Noto Sans KR", sans-serif';
let dpr = 1;
function fitCanvas(): void {
// 배율은 2 에서 자른다 — 배율 3 기기에서 화소가 2.25배로 늘지 않게
dpr = Math.min(window.devicePixelRatio || 1, 2);
cv.width = Math.round(W * dpr);
cv.height = Math.round(H * dpr);
ctx.setTransform(dpr, 0, 0, dpr, 0, 0);
}
function skyFill(top: RGB, bot: RGB): void {
const g = ctx.createLinearGradient(0, 0, 0, H);
g.addColorStop(0, rgba(top, 1));
g.addColorStop(1, rgba(bot, 1));
ctx.fillStyle = g;
ctx.fillRect(0, 0, W, H);
}
function disc(x: number, y: number, r: number, c: RGB, a: number): void {
if (r <= 0.2 || a <= 0) { return; }
ctx.beginPath();
ctx.arc(x, y, r, 0, TAU);
ctx.fillStyle = rgba(c, a);
ctx.fill();
}
function box(x: number, y: number, w: number, h: number, r: number, c: RGB, a: number): void {
if (w <= 0.2 || h <= 0.2 || a <= 0) { return; }
ctx.beginPath();
ctx.roundRect(x, y, w, h, Math.max(0, Math.min(r, w / 2, h / 2)));
ctx.fillStyle = rgba(c, a);
ctx.fill();
}
function outline(x: number, y: number, w: number, h: number, r: number, width: number, c: RGB, a: number): void {
if (w <= 0.2 || h <= 0.2 || a <= 0) { return; }
ctx.beginPath();
ctx.roundRect(x, y, w, h, Math.max(0, Math.min(r, w / 2, h / 2)));
ctx.lineWidth = width;
ctx.strokeStyle = rgba(c, a);
ctx.stroke();
}
function text(s: string, x: number, y: number, c: RGB, a: number, px: number, weight: number, align: CanvasTextAlign): void {
ctx.font = weight + ' ' + px + 'px ' + FONT_STACK;
ctx.textAlign = align;
ctx.textBaseline = 'middle';
ctx.fillStyle = rgba(c, a);
ctx.fillText(s, x, y);
}
// 글자 이름표 — 바탕 알약 위에 글자
function tag(s: string, x: number, y: number, bg: RGB, fg: RGB, px: number, align: CanvasTextAlign): void {
ctx.font = '700 ' + px + 'px ' + FONT_STACK;
const w = ctx.measureText(s).width + px * 1.1;
const left = align === 'center' ? x - w / 2 : (align === 'right' ? x - w : x);
box(left, y - px * 0.82, w, px * 1.64, px * 0.82, bg, 0.92);
text(s, left + w / 2, y + 0.5, fg, 1, px, 700, 'center');
}
// 판 자리 — 왼쪽 판·오른쪽 판(대비판)·한 판짜리 히어로. 위쪽은 상태 줄·버튼 자리
const PANEL_L: Rect = { x: 12, y: 78, w: 222, h: 208 };
const PANEL_R: Rect = { x: 246, y: 78, w: 222, h: 208 };
const PANEL_ONE: Rect = { x: 12, y: 60, w: 456, h: 228 };
// 판 바닥 — 칸 사이 틈으로 비치는 연보라
function bed(R: Rect): void {
box(R.x - 3, R.y - 3, R.w + 6, R.h + 6, 10, BED, 1);
}
function panelTags(a: string, b: string): void {
tag(a, PANEL_L.x + PANEL_L.w / 2, 66, INK, PAPER, 10, 'center');
tag(b, PANEL_R.x + PANEL_R.w / 2, 66, PAPER, INK, 10, 'center');
}
// 거품 한 개 — 면, 왼쪽 위 하이라이트, 옅은 윤곽
function orb(x: number, y: number, r: number, c: RGB, a: number): void {
if (r <= 0.3 || a <= 0) { return; }
disc(x, y, r, c, a);
if (r > 5) { disc(x - r * 0.28, y - r * 0.32, r * 0.42, [255, 255, 255], 0.3 * a); }
ctx.beginPath();
ctx.arc(x, y, r, 0, TAU);
ctx.lineWidth = 1;
ctx.strokeStyle = rgba(mix(c, INK, 0.28), 0.55 * a);
ctx.stroke();
}
function line(x0: number, y0: number, x1: number, y1: number, width: number, c: RGB, a: number): void {
if (a <= 0) { return; }
ctx.beginPath();
ctx.moveTo(x0, y0);
ctx.lineTo(x1, y1);
ctx.lineWidth = width;
ctx.strokeStyle = rgba(c, a);
ctx.stroke();
}
function ring(x: number, y: number, r: number, width: number, c: RGB, a: number): void {
if (r <= 0.3 || a <= 0) { return; }
ctx.beginPath();
ctx.arc(x, y, r, 0, TAU);
ctx.lineWidth = width;
ctx.strokeStyle = rgba(c, a);
ctx.stroke();
}
function ballHit(b: Ball, label: string): Hit {
return { x: b.x - b.r, y: b.y - b.r, w: b.r * 2, h: b.r * 2, label: label };
}
let shownStatus = '';
function pushStatus(s: string): void {
if (!statusEl || s === shownStatus) { return; }
shownStatus = s;
statusEl.textContent = s;
}
let paused = false;
const reduceQuery = window.matchMedia('(prefers-reduced-motion: reduce)');
// 페이지를 연 채 움직임 줄이기 설정을 바꿔도 change 리스너가 다시 읽는다
let still = reduceQuery.matches;
// 자동 시연 표시 — 사람이 처음 손대면 떼고 상태 줄을 polite 로 켠다
let demo = root.classList.contains('is-demo');
const off = new AbortController();
// 사람이 직접 하는 중이면 시간표는 멈추고 애니메이션만 흐른다
let manual = false;
// curOn 이면 키보드 칸 고르기가 켜진 것 — ki 가 hits() 안 번호
let curOn = false;
let ki = 0;
function wake(): void {
if (!demo) { return; }
demo = false;
root.classList.remove('is-demo');
if (statusEl) { statusEl.setAttribute('aria-live', 'polite'); }
}
function takeOver(): void {
if (manual) { return; }
manual = true;
onTake();
wake();
if (!curOn) { curOn = true; ki = 0; }
}
// 한 판 시연이 끝났음을 스크린리더에 한 번만 알린다 — 판이 되풀이돼도 다시 읽지 않는다
let doneSaid = false;
function checkDone(): void {
if (!manual && !doneSaid && sceneT >= LAP_S - 0.6) {
doneSaid = true;
doneP.textContent = statusText();
}
}
function advance(dt: number): void {
sceneT += dt;
if (!manual) {
while (evAt < script.length && script[evAt].t <= sceneT) {
const ev = script[evAt];
evAt += 1;
ev.f();
}
if (sceneT >= LAP_S) { lap += 1; begin(); return; }
}
update(dt);
}
// 첫 판은 START_S 만큼 앞서 시작한다 — 칸이 이미 움직이는 중인 장면에서 보인다
function runTo(t: number): void {
while (sceneT < t - 1e-6) { advance(Math.min(1 / 30, t - sceneT)); }
}
function begin(): void {
sceneT = 0;
evAt = 0;
script = [];
build();
if (lap === 0 && !still) { runTo(START_S); }
}
const DT_MAX = 0.05;
const SETTLE_FRAMES = 8;
const SETTLE_DT = 0.04;
function drawCursor(): void {
if (!curOn) { return; }
const hs = hits();
if (hs.length === 0) { return; }
const h = hs[clamp(ki, 0, hs.length - 1)];
outline(h.x + 1, h.y + 1, h.w - 2, h.h - 2, 5, 3, INK, 1);
outline(h.x - 1, h.y - 1, h.w + 2, h.h + 2, 6, 1.5, PAPER, 0.9);
}
function cursorLabel(): string {
const hs = hits();
return hs.length === 0 ? statusText() : hs[clamp(ki, 0, hs.length - 1)].label;
}
function showNow(): void {
draw();
drawCursor();
pushStatus(curOn ? cursorLabel() : statusText());
checkDone();
}
let rafId = 0;
let lastTs = -1;
function frame(ts: number): void {
if (still || paused) { rafId = 0; return; }
if (lastTs < 0) { lastTs = ts; }
const dt = Math.min((ts - lastTs) / 1000, DT_MAX);
lastTs = ts;
if (dt > 0) { advance(dt); }
showNow();
rafId = window.requestAnimationFrame(frame);
}
function startLoop(): void {
if (rafId) { return; }
// 멈췄던 사이의 시간을 첫 프레임 dt 로 넘기지 않는다
lastTs = -1;
rafId = window.requestAnimationFrame(frame);
}
function stopLoop(): void {
if (rafId) { window.cancelAnimationFrame(rafId); rafId = 0; }
}
// 움직임 줄이기 — 루프 없이 배치가 끝난 정지 장면 한 장
function showRest(): void {
stopLoop();
lap = 0;
sceneT = 0;
evAt = 0;
script = [];
build();
runTo(REST_S);
showNow();
}
// 움직임 줄이기이거나 멈춘 채 입력이 들어오면 트윈 없이 곧바로 끝 배치로 — 시간을 3초 흘려 스프링·애니메이션을 다 끝낸다
function settleStill(): void {
for (let k = 0; k < 90; k += 1) { sceneT += 1 / 30; update(1 / 30); }
}
function play(): void {
begin();
showNow();
if (!paused) { startLoop(); }
}
function togglePause(): void {
paused = !paused;
pauseBtn.setAttribute('aria-pressed', paused ? 'true' : 'false');
wake();
if (paused) { stopLoop(); } else if (!still) { startLoop(); }
}
function restart(): void {
manual = false;
curOn = false;
doneSaid = false;
lap += 1;
begin();
for (let k = 0; k < SETTLE_FRAMES; k += 1) { update(SETTLE_DT); }
showNow();
}
// 한 걸음 — 멈춘 채 시간표의 다음 일 하나를 부른다. 더 부를 일이 없거나 직접 하던 중이면 다음 판을 연다
function stepOnce(): void {
wake();
if (!paused) {
paused = true;
pauseBtn.setAttribute('aria-pressed', 'true');
stopLoop();
}
if (manual || evAt >= script.length) {
restart();
return;
}
sceneT = Math.max(sceneT, script[evAt].t);
advance(0);
for (let k = 0; k < SETTLE_FRAMES; k += 1) { sceneT += SETTLE_DT; update(SETTLE_DT); }
showNow();
}
function moveCur(d: number): void {
const n = hits().length;
if (n === 0) { return; }
ki = (ki + d + n) % n;
}
function actCur(i: number): void {
onAct(i);
// 멈춘 채·움직임 줄이기에서도 입력이 화면에 바로 반영되게 한다
if (still || paused) { settleStill(); }
}
pauseBtn.addEventListener('click', togglePause, { signal: off.signal });
stepBtn.addEventListener('click', stepOnce, { signal: off.signal });
// 키보드 — 무대에 포커스가 있을 때만. 방향키는 칸 이동, Enter·Space 는 칸 고르기, P 는 일시정지, N 은 한 걸음, R 은 다시
pad.addEventListener('keydown', function (e: KeyboardEvent): void {
if (e.altKey || e.ctrlKey || e.metaKey) { return; }
const k = e.key;
if (k === 'ArrowLeft' || k === 'ArrowUp') {
e.preventDefault();
takeOver();
moveCur(-1);
showNow();
} else if (k === 'ArrowRight' || k === 'ArrowDown') {
e.preventDefault();
takeOver();
moveCur(1);
showNow();
} else if (k === 'Enter' || k === ' ') {
e.preventDefault();
takeOver();
actCur(ki);
showNow();
} else if (k === 'p' || k === 'P') {
togglePause();
} else if (k === 'n' || k === 'N') {
stepOnce();
} else if (k === 'r' || k === 'R') {
restart();
}
}, { signal: off.signal });
// 마우스·터치 — 누른 자리의 칸을 고른다
pad.addEventListener('click', function (e: MouseEvent): void {
const rect = cv.getBoundingClientRect();
const px = (e.clientX - rect.left) / rect.width * W;
const py = (e.clientY - rect.top) / rect.height * H;
const hs = hits();
let at = -1;
for (let i = 0; i < hs.length; i += 1) {
if (px >= hs[i].x && px <= hs[i].x + hs[i].w && py >= hs[i].y && py <= hs[i].y + hs[i].h) { at = i; }
}
if (at < 0) { return; }
takeOver();
ki = at;
actCur(at);
showNow();
}, { signal: off.signal });
// 탭이 숨으면 멈추고, 돌아오면 시계를 다시 맞춰 시작 — 숨은 동안의 몇 초가 한 프레임에 몰리지 않게
document.addEventListener('visibilitychange', function (): void {
if (document.hidden) { stopLoop(); } else if (!paused && !still) { startLoop(); }
}, { signal: off.signal });
// 설정이 바뀌면 — 켜지면 배치가 끝난 한 장, 꺼지면 다시 움직인다
reduceQuery.addEventListener('change', function (): void {
still = reduceQuery.matches;
if (still) { showRest(); } else { lap = 0; play(); }
}, { signal: off.signal });
window.addEventListener('resize', function (): void {
fitCanvas();
showNow();
}, { signal: off.signal });
// 07 — 시점마다 주어진 가로·세로·크기를 시점 사이에서 곡선(splineStep)으로 매끈하게 이어 거품이 미끄러지게 한다. 지나온 자리는 TRAIL_LEN 개의 옅은 점으로 남기고, 시점 슬라이더는 시간표가 대신 민다
const TRAIL_LEN = 16;
const TRAIL_S = 0.07;
const KEYS = 6;
const N = 8;
const YEAR0 = 2018;
const LAP_S = 10;
const START_S = 1.6;
const REST_S = 6.0;
const PLOT: Rect = { x: 56, y: 72, w: 396, h: 166 };
const TRACK_Y = 266;
type Series = { xs: number[]; ys: number[]; ss: number[] };
let data: Series[] = [];
let trails: number[][][] = [];
let yearPos = 0;
let yTgt = 0;
let manualYear = false;
let acc = 0;
// 네 점(앞 · 시작 · 끝 · 뒤)을 지나 두 시점 사이를 잇는 3차 곡선 — pos 는 0 부터 KEYS - 1 까지의 소수 위치
function splineStep(a: number[], pos: number): number {
const i = Math.min(Math.floor(pos), a.length - 2);
const u = pos - i;
const p0 = a[Math.max(i - 1, 0)];
const p1 = a[i];
const p2 = a[i + 1];
const p3 = a[Math.min(i + 2, a.length - 1)];
return 0.5 * ((2 * p1) + (-p0 + p2) * u + (2 * p0 - 5 * p1 + 4 * p2 - p3) * u * u + (-p0 + 3 * p1 - 3 * p2 + p3) * u * u * u);
}
// 시간표 → 시점 위치 — 0.5초에서 7.6초까지 부드럽게 한 번 지나간다
function yearAt(t: number): number { return (KEYS - 1) * ease((t - 0.5) / 7.1); }
function build(): void {
const rnd = seeded(71 + (lap % 3) * 23);
data = [];
for (let i = 0; i < N; i += 1) {
const d: Series = { xs: [], ys: [], ss: [] };
const x0 = 12 + rnd() * 60;
const y0 = 12 + rnd() * 70;
const s0 = 8 + rnd() * 30;
const dx = (rnd() - 0.25) * 14;
const dy = (rnd() - 0.4) * 12;
const ds = (rnd() - 0.3) * 8;
for (let k = 0; k < KEYS; k += 1) {
d.xs.push(clamp(x0 + dx * k + 7 * Math.sin(k * 1.3 + i), 4, 96));
d.ys.push(clamp(y0 + dy * k + 6 * Math.cos(k * 1.1 + i * 2), 4, 96));
d.ss.push(Math.max(4, s0 + ds * k));
}
data.push(d);
}
trails = data.map(function (): number[][] { return []; });
yearPos = 0;
yTgt = 0;
manualYear = false;
acc = 0;
}
function sx(v: number): number { return PLOT.x + PLOT.w * v / 100; }
function sy(v: number): number { return PLOT.y + PLOT.h - PLOT.h * v / 100; }
function rOf(s: number): number { return 3.6 * Math.sqrt(Math.max(s, 1)); }
function pose(i: number, pos: number): number[] {
return [sx(splineStep(data[i].xs, pos)), sy(splineStep(data[i].ys, pos)), rOf(splineStep(data[i].ss, pos))];
}
function update(dt: number): void {
if (dt <= 0) { return; }
if (manualYear) { yearPos += (yTgt - yearPos) * (1 - Math.exp(-4 * dt)); } else { yearPos = yearAt(sceneT); }
yearPos = clamp(yearPos, 0, KEYS - 1);
acc += dt;
while (acc >= TRAIL_S) {
acc -= TRAIL_S;
for (let i = 0; i < N; i += 1) {
trails[i].push(pose(i, yearPos));
if (trails[i].length > TRAIL_LEN) { trails[i].shift(); }
}
}
}
function fastest(): number {
let best = 0;
let bd = -1;
for (let i = 0; i < N; i += 1) {
const a = pose(i, yearPos);
const b = pose(i, Math.max(0, yearPos - 0.3));
const d = Math.hypot(a[0] - b[0], a[1] - b[1]);
if (d > bd) { bd = d; best = i; }
}
return best;
}
function draw(): void {
skyFill(BG_TOP, BG_BOT);
bed(PANEL_ONE);
box(PLOT.x, PLOT.y, PLOT.w, PLOT.h, 6, PAPER, 0.7);
for (let v = 0; v <= 100; v += 25) {
line(sx(v), PLOT.y, sx(v), PLOT.y + PLOT.h, 1, INK2, 0.14);
line(PLOT.x, sy(v), PLOT.x + PLOT.w, sy(v), 1, INK2, 0.14);
text(String(v), sx(v), PLOT.y + PLOT.h + 9, INK2, 1, 9, 700, 'center');
text(String(v), PLOT.x - 6, sy(v), INK2, 1, 9, 700, 'right');
}
// 이동 꼬리 — 오래된 점일수록 작고 옅다
for (let i = 0; i < N; i += 1) {
const tr = trails[i];
for (let k = 0; k < tr.length; k += 1) {
const f = (k + 1) / (tr.length + 1);
if (k > 0) { line(tr[k - 1][0], tr[k - 1][1], tr[k][0], tr[k][1], 1.5, TILES[i % 8], 0.5 * f); }
disc(tr[k][0], tr[k][1], Math.max(1.5, tr[k][2] * 0.5 * f), mix(TILES[i % 8], INK, 0.2), 0.5 * f);
}
}
const fi = fastest();
for (let i = 0; i < N; i += 1) {
const p = pose(i, yearPos);
orb(p[0], p[1], p[2], TILES[i % 8], 0.95);
text(NAMES[i], p[0] + p[2] + 3, p[1], INK, 1, 10, 700, 'left');
}
const pf = pose(fi, yearPos);
ring(pf[0], pf[1], pf[2] + 3, 2, INK, 0.9);
// 시점 슬라이더 — 시간표가 민다. 칸은 시점마다 하나
line(PLOT.x, TRACK_Y, PLOT.x + PLOT.w, TRACK_Y, 4, BED, 1);
line(PLOT.x, TRACK_Y, PLOT.x + PLOT.w * yearPos / (KEYS - 1), TRACK_Y, 4, INK2, 1);
for (let k = 0; k < KEYS; k += 1) {
const tx = PLOT.x + PLOT.w * k / (KEYS - 1);
disc(tx, TRACK_Y, 3, INK2, 1);
text(String(YEAR0 + k), tx, TRACK_Y + 12, INK2, 1, 9, 700, 'center');
}
const kx = PLOT.x + PLOT.w * yearPos / (KEYS - 1);
disc(kx, TRACK_Y, 7, INK, 1);
disc(kx, TRACK_Y, 3, PAPER, 1);
}
function statusText(): string {
return '{a}년 · 가장 빠르게 움직이는 거품 {b}'.replace('{a}', String(YEAR0 + Math.round(yearPos))).replace('{b}', NAMES[fastest()]);
}
function hits(): Hit[] {
return data.map(function (_d: Series, i: number): Hit {
const p = pose(i, yearPos);
const pos = clamp(yearPos, 0, KEYS - 1);
return ballHit({ x: p[0], y: p[1], r: p[2], v: 0, g: i }, '{n} · {y}년 가로 {x} · 세로 {v} · 크기 {s}'.replace('{n}', NAMES[i]).replace('{y}', String(YEAR0 + Math.round(pos))).replace('{x}', String(Math.round(splineStep(data[i].xs, pos)))).replace('{v}', String(Math.round(splineStep(data[i].ys, pos)))).replace('{s}', String(Math.round(splineStep(data[i].ss, pos)))));
});
}
// 직접 고르면 시점을 한 칸 앞으로 — 끝이면 처음으로
function onAct(_i: number): void { yTgt = (Math.round(yTgt) + 1) % KEYS; }
function onTake(): void { manualYear = true; yTgt = Math.round(yearPos); }
fitCanvas();
if (still) { showRest(); } else { play(); }
return function (): void {
stopLoop();
off.abort();
};
}, []);
return (
<div className={cx("vj") + " is-demo"} ref={rootRef}>
<div className={cx("vj__pad")} data-role="pad" tabIndex={0} role="application" aria-label={'버블 차트 시연 무대 — 방향키로 거품 이동, Enter 로 고르기, P 로 일시정지, N 으로 한 걸음, R 로 다시'}>
<canvas className={cx("vj__canvas")} data-role="canvas" width={480} height={300} role="img" aria-label={'거품 여덟 개가 여섯 시점의 가로·세로·크기를 곡선으로 이어 미끄러지며 지나온 자리에 열여섯 개의 옅은 점 꼬리를 남긴다. 가장 빠르게 움직이는 거품에 윤곽이 붙고, 아래 시점 슬라이더는 시간표가 대신 밀어 2018 부터 2023 까지 지나간다'}></canvas>
</div>
<p className={cx("vj__status")} data-role="status" aria-live="off">{'버블 차트 시연'}</p>
<div className={cx("vj__ctrl")}>
<button className={cx("vj__pause")} data-role="pause" type="button" aria-pressed="false">{'일시정지'}</button>
<button className={cx("vj__step")} data-role="step" type="button">{'한 걸음'}</button>
</div>
<p className={cx("vj__done")} data-role="done" role="status" aria-live="polite"></p>
</div>
);
}07 A Motion Trail Joining Time Steps — Measured area 14.902% · moving frames 23/23Original by GODRICH · SCSS and React ship in the zip · Bubble Chart: 9 Canvas Scenes
The post this demo lives in
 Bubble Chart: 9 Canvas ScenesHow does a bubble chart turn one row of data into a circle? 01 uses the square root of the value as radius, 02 pushes ov See all demos in this post