05Gauge Comparing How Far Each Method Drifts in Energy
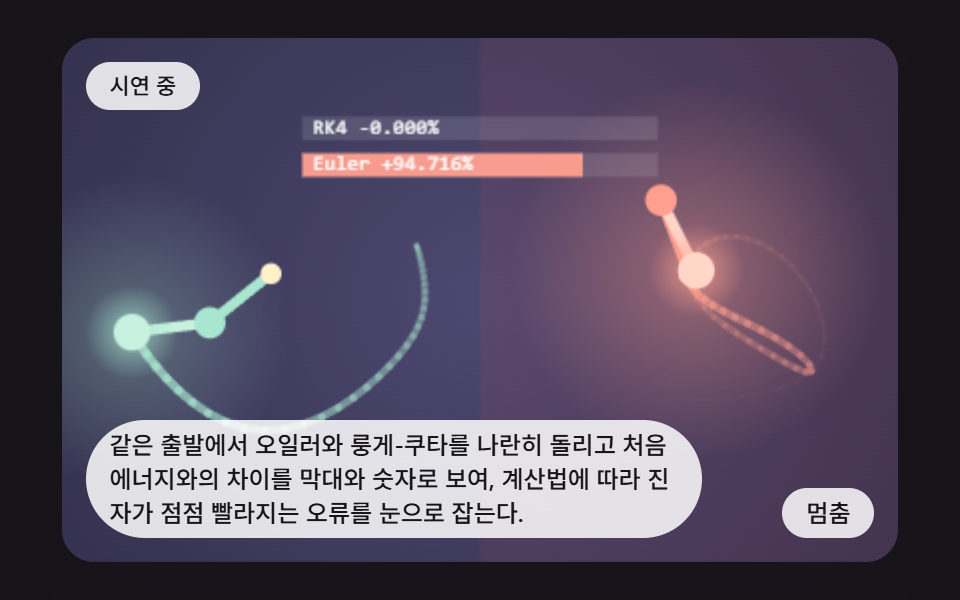
It runs Euler and Runge-Kutta side by side from the same start and shows the gap from the initial energy as bars and numbers, so the error that speeds a pendulum up shows by eye.
Best forChecking whether a simulation is correct
EULER_LIMIT_PCTBAR_FULL_PCTeulerSteptotalEnergydrift
<main class="stage">
<div class="bp is-demo" id="bpRoot">
  <canvas class="bp__canvas" id="bpCanvas" width="480" height="300" tabindex="0" aria-label="It runs Euler and Runge-Kutta side by side from the same start and shows the gap from the initial energy as bars and numbers, so the error that speeds a pendulum up shows by eye."></canvas>
  <p class="bp__status" id="bpStatus" aria-live="polite">Demo running</p>
  <button class="bp__btn" id="bpBtn" type="button">Pause</button>
  <p class="bp__caption">It runs Euler and Runge-Kutta side by side from the same start and shows the gap from the initial energy as bars and numbers, so the error that speeds a pendulum up shows by eye.</p>
</div>
</main>
@use "../../../../site/static/demo-tokens" as *;
@include stage($stage-ink);
.bp {
position: relative;
width: min(92vw, calc(160vh - 12.8vw));
aspect-ratio: 480 / 300;
margin: 0 auto;
border-radius: $r-card;
overflow: hidden;
box-shadow: $shadow-raised;
background: $stage-ink;
}
.bp__canvas {
display: block;
width: 100%;
height: 100%;
touch-action: none;
}
.bp__canvas:focus-visible {
outline: 2px solid rgba(255, 255, 255, .85);
outline-offset: -6px;
}
.bp__status {
position: absolute;
left: $sp-3;
top: $sp-3;
max-width: 70%;
margin: 0;
padding: $sp-1 $sp-3;
border-radius: $r-pill;
background: rgba(255, 255, 255, .85);
color: $subject-ink;
font-weight: 500;
font-size: 11px;
line-height: 1.4;
pointer-events: none;
}
.bp__btn {
position: absolute;
right: $sp-3;
bottom: $sp-3;
margin: 0;
padding: $sp-1 $sp-3;
border: 0;
border-radius: $r-pill;
background: rgba(255, 255, 255, .85);
color: $subject-ink;
font: inherit;
font-weight: 500;
font-size: 12px;
line-height: 1.4;
cursor: pointer;
}
.bp__btn:focus-visible {
outline: 2px solid #ffffff;
outline-offset: 2px;
}
.bp__caption {
position: absolute;
left: $sp-3;
bottom: $sp-3;
max-width: 68%;
margin: 0;
padding: $sp-1 $sp-3;
border-radius: $r-pill;
background: rgba(255, 255, 255, .85);
color: $subject-ink;
font-weight: 500;
font-size: 12px;
line-height: 1.4;
pointer-events: none;
}
@media (max-width: 340px) {
.bp__caption, .bp__btn { font-size: 10px; padding: $sp-1 $sp-2; }
.bp__status { font-size: 10px; }
}
@media (prefers-reduced-motion: reduce) {
.bp { cursor: default; }
}html, body {
margin: 0;
overflow: hidden;
}
.stage {
box-sizing: border-box;
min-height: 100vh;
display: grid;
place-items: center;
margin: 0;
background: #17141a;
font-family: -apple-system, "Segoe UI", "Noto Sans KR", sans-serif;
padding: clamp(8px, 4vw, 24px);
}
.bp {
position: relative;
width: min(92vw, 160vh - 12.8vw);
aspect-ratio: 480/300;
margin: 0 auto;
border-radius: 16px;
overflow: hidden;
box-shadow: 0 14px 24px rgba(23, 20, 26, 0.32);
background: #17141a;
}
.bp__canvas {
display: block;
width: 100%;
height: 100%;
touch-action: none;
}
.bp__canvas:focus-visible {
outline: 2px solid rgba(255, 255, 255, 0.85);
outline-offset: -6px;
}
.bp__status {
position: absolute;
left: 12px;
top: 12px;
max-width: 70%;
margin: 0;
padding: 4px 12px;
border-radius: 999px;
background: rgba(255, 255, 255, 0.85);
color: #17141a;
font-weight: 500;
font-size: 11px;
line-height: 1.4;
pointer-events: none;
}
.bp__btn {
position: absolute;
right: 12px;
bottom: 12px;
margin: 0;
padding: 4px 12px;
border: 0;
border-radius: 999px;
background: rgba(255, 255, 255, 0.85);
color: #17141a;
font: inherit;
font-weight: 500;
font-size: 12px;
line-height: 1.4;
cursor: pointer;
}
.bp__btn:focus-visible {
outline: 2px solid #ffffff;
outline-offset: 2px;
}
.bp__caption {
position: absolute;
left: 12px;
bottom: 12px;
max-width: 68%;
margin: 0;
padding: 4px 12px;
border-radius: 999px;
background: rgba(255, 255, 255, 0.85);
color: #17141a;
font-weight: 500;
font-size: 12px;
line-height: 1.4;
pointer-events: none;
}
@media (max-width: 340px) {
.bp__caption, .bp__btn {
font-size: 10px;
padding: 4px 8px;
}
.bp__status {
font-size: 10px;
}
}
@media (prefers-reduced-motion: reduce) {
.bp {
cursor: default;
}
}(function () {
var root = document.getElementById('bpRoot');
var canvas = document.getElementById('bpCanvas');
var statusEl = document.getElementById('bpStatus');
var btnEl = document.getElementById('bpBtn');
"use strict";
function main(root, canvas, statusEl, btnEl) {
var ctx0 = canvas.getContext('2d');
if (!ctx0) {
return function () { return; };
}
var ctx = ctx0;
var wrap = canvas.parentElement ? canvas.parentElement : root;
var CALC_W = 320, CALC_H = 200;
var FIXED_DT = 16;
var REDUCE_STEP_FRAMES = 40;
var reduce = window.matchMedia('(prefers-reduced-motion: reduce)').matches;
var demo = !reduce;
if (!demo)
root.classList.remove('is-demo');
function stopDemo() { demo = false; root.classList.remove('is-demo'); }
var paused = false;
var ownInput = false;
var cw = 480, ch = 300, sc = 1.5, elapsed = 0, rafId = 0;
var cleaners = [];
function listen(target, type, fn) {
target.addEventListener(type, fn);
cleaners.push(function () { target.removeEventListener(type, fn); });
}
function clamp(v, lo, hi) { return v < lo ? lo : (v > hi ? hi : v); }
function setStatus(msg) { statusEl.textContent = msg; }
function hsl(h, s, l, a) {
return 'hsla(' + (h % 360) + ',' + s + '%,' + l + '%,' + a + ')';
}
function canvasPoint(e) {
var r = canvas.getBoundingClientRect();
return { x: (e.clientX - r.left) / r.width * CALC_W, y: (e.clientY - r.top) / r.height * CALC_H };
}
// 배경 — 어두운 잉크색 위에 방사형 빛무리를 (gx, gy) 에 깐다
function beginDraw(inner, outer, gx, gy) {
ctx.setTransform(1, 0, 0, 1, 0, 0);
ctx.fillStyle = '#1d1a2b';
ctx.fillRect(0, 0, cw, ch);
ctx.setTransform(sc, 0, 0, sc, 0, 0);
var g = ctx.createRadialGradient(gx, gy, 8, gx, gy, 230);
g.addColorStop(0, inner);
g.addColorStop(1, outer);
ctx.fillStyle = g;
ctx.fillRect(0, 0, CALC_W, CALC_H);
}
function seg(x1, y1, x2, y2, w, col) {
ctx.beginPath();
ctx.moveTo(x1, y1);
ctx.lineTo(x2, y2);
ctx.lineCap = 'round';
ctx.lineWidth = w;
ctx.strokeStyle = col;
ctx.stroke();
}
function disc(x, y, r, col) {
ctx.beginPath();
ctx.arc(x, y, r, 0, 6.2832);
ctx.fillStyle = col;
ctx.fill();
}
function glow(x, y, r, rgb, a) {
var g = ctx.createRadialGradient(x, y, 0, x, y, r);
g.addColorStop(0, 'rgba(' + rgb + ',' + a + ')');
g.addColorStop(1, 'rgba(' + rgb + ',0)');
ctx.fillStyle = g;
ctx.fillRect(x - r, y - r, r * 2, r * 2);
}
function drawTrail(arr, rgb, w, alpha) {
ctx.lineCap = 'round';
for (var i = 1; i < arr.length; i += 1) {
var f = i / arr.length;
ctx.beginPath();
ctx.moveTo(arr[i - 1].x, arr[i - 1].y);
ctx.lineTo(arr[i].x, arr[i].y);
ctx.strokeStyle = 'rgba(' + rgb + ',' + (alpha * f * f) + ')';
ctx.lineWidth = w * (0.3 + 0.7 * f);
ctx.stroke();
}
}
function pushTrail(arr, x, y, max) {
arr.push({ x: x, y: y });
if (arr.length > max) {
arr.shift();
}
}
function defaultToggle() {
if (reduce) {
for (var i = 0; i < REDUCE_STEP_FRAMES; i += 1) {
elapsed += FIXED_DT;
stepFrame();
}
draw();
setStatus('Stepping one scene at a time');
return;
}
paused = !paused;
btnEl.textContent = paused ? 'Play' : 'Pause';
setStatus(paused ? 'Paused' : 'Demo running');
}
var onButton = defaultToggle;
// 기법: 같은 출발에서 오일러와 룽게-쿠타를 나란히 돌리고, 둘 다 같은 totalEnergy 식으로 처음 에너지와의 차이를 잰다
var DT = 0.01;
var SUBSTEPS = 3;
var START_T1 = 2.0;
var START_T2 = 1.6;
var EULER_LIMIT_PCT = 240;
var BAR_FULL_PCT = 120;
var SIM_RESET_FRAMES = 330;
var L1 = 1.0;
var L2 = 1.0;
var M1 = 1.0;
var M2 = 1.0;
var G = 9.81;
var UNIT = 30, PIVOT_L = 80, PIVOT_R = 240, PIVOT_Y = 90;
var PREROLL_FRAMES = 60;
// 라그랑주 운동방정식 — 각도는 아래 방향이 0, 시계 방향이 양수
function accTheta1(t1, t2, w1, w2) {
var d = t1 - t2;
var den = L1 * (2 * M1 + M2 - M2 * Math.cos(2 * d));
return (-G * (2 * M1 + M2) * Math.sin(t1) - M2 * G * Math.sin(t1 - 2 * t2)
- 2 * Math.sin(d) * M2 * (w2 * w2 * L2 + w1 * w1 * L1 * Math.cos(d))) / den;
}
function accTheta2(t1, t2, w1, w2) {
var d = t1 - t2;
var den = L2 * (2 * M1 + M2 - M2 * Math.cos(2 * d));
return (2 * Math.sin(d) * (w1 * w1 * L1 * (M1 + M2) + G * (M1 + M2) * Math.cos(t1)
+ w2 * w2 * L2 * M2 * Math.cos(d))) / den;
}
// 룽게-쿠타 4단계 — 한 걸음을 네 번 기울기로 평균 낸다 (s = [t1, t2, w1, w2])
function rk4Step(s, h) {
var t1 = s[0], t2 = s[1], w1 = s[2], w2 = s[3];
var h2 = h * 0.5;
var k1a = w1, k1b = w2, k1c = accTheta1(t1, t2, w1, w2), k1d = accTheta2(t1, t2, w1, w2);
var u1 = t1 + h2 * k1a, u2 = t2 + h2 * k1b, u3 = w1 + h2 * k1c, u4 = w2 + h2 * k1d;
var k2a = u3, k2b = u4, k2c = accTheta1(u1, u2, u3, u4), k2d = accTheta2(u1, u2, u3, u4);
u1 = t1 + h2 * k2a;
u2 = t2 + h2 * k2b;
u3 = w1 + h2 * k2c;
u4 = w2 + h2 * k2d;
var k3a = u3, k3b = u4, k3c = accTheta1(u1, u2, u3, u4), k3d = accTheta2(u1, u2, u3, u4);
u1 = t1 + h * k3a;
u2 = t2 + h * k3b;
u3 = w1 + h * k3c;
u4 = w2 + h * k3d;
var k4a = u3, k4b = u4, k4c = accTheta1(u1, u2, u3, u4), k4d = accTheta2(u1, u2, u3, u4);
s[0] = t1 + h / 6 * (k1a + 2 * k2a + 2 * k3a + k4a);
s[1] = t2 + h / 6 * (k1b + 2 * k2b + 2 * k3b + k4b);
s[2] = w1 + h / 6 * (k1c + 2 * k2c + 2 * k3c + k4c);
s[3] = w2 + h / 6 * (k1d + 2 * k2d + 2 * k3d + k4d);
}
function bobOne(s, ox, oy) {
return { x: ox + UNIT * L1 * Math.sin(s[0]), y: oy + UNIT * L1 * Math.cos(s[0]) };
}
function bobTwo(s, ox, oy) {
var a = bobOne(s, ox, oy);
return { x: a.x + UNIT * L2 * Math.sin(s[1]), y: a.y + UNIT * L2 * Math.cos(s[1]) };
}
function drawArms(s, ox, oy, c1, c2, w) {
var a = bobOne(s, ox, oy), b = bobTwo(s, ox, oy);
seg(ox, oy, a.x, a.y, w, c1);
seg(a.x, a.y, b.x, b.y, w, c2);
}
function eulerStep(s, h) {
var a1 = accTheta1(s[0], s[1], s[2], s[3]);
var a2 = accTheta2(s[0], s[1], s[2], s[3]);
s[0] += h * s[2];
s[1] += h * s[3];
s[2] += h * a1;
s[3] += h * a2;
}
// 전체 에너지 = 운동 + 위치 (아래 방향이 기준 0 이 되도록 높이를 잰다)
function totalEnergy(s) {
var t1 = s[0], t2 = s[1], w1 = s[2], w2 = s[3];
var kinetic = 0.5 * (M1 + M2) * L1 * L1 * w1 * w1 + 0.5 * M2 * L2 * L2 * w2 * w2
+ M2 * L1 * L2 * w1 * w2 * Math.cos(t1 - t2);
var potential = -(M1 + M2) * G * L1 * Math.cos(t1) - M2 * G * L2 * Math.cos(t2);
return kinetic + potential;
}
var simR = [START_T1, START_T2, 0, 0];
var simE = [START_T1, START_T2, 0, 0];
var energyZero = totalEnergy(simR);
var driftR = 0, driftE = 0;
var frameCount = 0;
var trailR = [];
var trailE = [];
function drift(s) {
var d = (totalEnergy(s) - energyZero) / Math.abs(energyZero) * 100;
return isFinite(d) ? d : 9999;
}
function restart() {
simR = [START_T1, START_T2, 0, 0];
simE = [START_T1, START_T2, 0, 0];
trailR = [];
trailE = [];
frameCount = 0;
}
function stepFrame() {
for (var i = 0; i < SUBSTEPS; i += 1) {
rk4Step(simR, DT);
eulerStep(simE, DT);
}
driftR = drift(simR);
driftE = drift(simE);
var pr = bobTwo(simR, PIVOT_L, PIVOT_Y), pe = bobTwo(simE, PIVOT_R, PIVOT_Y);
pushTrail(trailR, pr.x, pr.y, 70);
pushTrail(trailE, pe.x, pe.y, 70);
frameCount += 1;
if (Math.abs(driftE) > EULER_LIMIT_PCT || frameCount >= SIM_RESET_FRAMES) {
restart();
}
}
function bar(y, pct, rgb, label) {
var x0 = 92, wid = 136;
ctx.fillStyle = 'rgba(255,255,255,0.12)';
ctx.fillRect(x0, y, wid, 9);
ctx.fillStyle = 'rgba(' + rgb + ',0.95)';
ctx.fillRect(x0, y, clamp(Math.abs(pct) / BAR_FULL_PCT, 0, 1) * wid, 9);
ctx.font = '8px monospace';
ctx.fillStyle = '#ffffff';
ctx.textBaseline = 'middle';
ctx.fillText(label + ' ' + (pct >= 0 ? '+' : '-') + Math.abs(pct).toFixed(3) + '%', x0 + 4, y + 4.5);
}
function draw() {
var pr = bobTwo(simR, PIVOT_L, PIVOT_Y), pe = bobTwo(simE, PIVOT_R, PIVOT_Y);
var heat = clamp(Math.abs(driftE) / EULER_LIMIT_PCT, 0, 1);
beginDraw(heat > 0.5 ? '#54405f' : '#463e68', '#28223f', 160, 100);
ctx.fillStyle = 'rgba(168,230,207,0.05)';
ctx.fillRect(0, 0, 160, CALC_H);
ctx.fillStyle = 'rgba(255,159,143,' + (0.04 + 0.16 * heat) + ')';
ctx.fillRect(160, 0, 160, CALC_H);
glow(pr.x, pr.y, 60, '168,230,207', 0.3);
glow(pe.x, pe.y, 60 + 30 * heat, '255,159,143', 0.3 + 0.3 * heat);
drawTrail(trailR, '168,230,207', 3.5, 0.8);
drawTrail(trailE, '255,159,143', 3.5, 0.8);
drawArms(simR, PIVOT_L, PIVOT_Y, '#a8e6cf', '#c9f1e0', 4);
drawArms(simE, PIVOT_R, PIVOT_Y, '#ff9f8f', '#ffd6c8', 4);
var ar = bobOne(simR, PIVOT_L, PIVOT_Y), ae = bobOne(simE, PIVOT_R, PIVOT_Y);
disc(PIVOT_L, PIVOT_Y, 4, '#fff1c9');
disc(PIVOT_R, PIVOT_Y, 4, '#fff1c9');
disc(ar.x, ar.y, 6, '#a8e6cf');
disc(ae.x, ae.y, 6, '#ff9f8f');
glow(pr.x, pr.y, 18, '168,230,207', 0.7);
disc(pr.x, pr.y, 7, '#c9f1e0');
glow(pe.x, pe.y, 18, '255,159,143', 0.7);
disc(pe.x, pe.y, 7, '#ffd6c8');
bar(30, driftR, '168,230,207', 'RK4');
bar(44, driftE, '255,159,143', 'Euler');
}
function fit() {
var r = wrap.getBoundingClientRect();
cw = Math.max(1, Math.round(r.width));
ch = Math.max(1, Math.round(r.height));
canvas.width = cw;
canvas.height = ch;
sc = cw / CALC_W;
draw();
}
var lastTs = null;
var accMs = 0;
function tick(ts) {
if (lastTs === null) {
lastTs = ts;
}
var frameDt = Math.min(ts - lastTs, 48);
lastTs = ts;
if (!paused) {
accMs += frameDt;
while (accMs >= FIXED_DT) {
elapsed += FIXED_DT;
stepFrame();
accMs -= FIXED_DT;
}
}
draw();
rafId = requestAnimationFrame(tick);
}
for (var w0 = 0; w0 < PREROLL_FRAMES; w0 += 1) {
elapsed += FIXED_DT;
stepFrame();
}
fit();
listen(window, 'resize', fit);
listen(btnEl, 'click', function () { onButton(); });
if (!ownInput) {
listen(canvas, 'pointerdown', function () { onButton(); });
listen(canvas, 'keydown', function (e) {
var k = e.key;
if (k === 'Enter' || k === ' ') {
e.preventDefault();
onButton();
}
});
}
if (reduce) {
if (!ownInput) {
btnEl.textContent = 'Next scene';
setStatus('Stepping one scene at a time');
}
}
else {
rafId = requestAnimationFrame(tick);
}
function destroy() {
cancelAnimationFrame(rafId);
for (var i = 0; i < cleaners.length; i += 1) {
cleaners[i]();
}
}
return destroy;
}
main(root, canvas, statusEl, btnEl);
})();import { useEffect, useRef } from "react";
import styles from "./DpEnergyDriftMeterEulerVsRk4.module.scss";
function main(root: HTMLDivElement, canvas: HTMLCanvasElement, statusEl: HTMLElement, btnEl: HTMLButtonElement): () => void {
type Pt = { x: number; y: number };
var ctx0 = canvas.getContext('2d');
if (!ctx0) { return function (): void { return; }; }
var ctx: CanvasRenderingContext2D = ctx0;
var wrap: HTMLElement = canvas.parentElement ? canvas.parentElement : root;
var CALC_W = 320, CALC_H = 200;
var FIXED_DT = 16;
var REDUCE_STEP_FRAMES = 40;
var reduce = window.matchMedia('(prefers-reduced-motion: reduce)').matches;
var demo = !reduce;
if (!demo) root.classList.remove('is-demo');
function stopDemo(): void { demo = false; root.classList.remove('is-demo'); }
var paused = false;
var ownInput = false;
var cw = 480, ch = 300, sc = 1.5, elapsed = 0, rafId = 0;
var cleaners: Array<() => void> = [];
function listen(target: EventTarget, type: string, fn: (e: Event) => void): void {
target.addEventListener(type, fn);
cleaners.push(function (): void { target.removeEventListener(type, fn); });
}
function clamp(v: number, lo: number, hi: number): number { return v < lo ? lo : (v > hi ? hi : v); }
function setStatus(msg: string): void { statusEl.textContent = msg; }
function hsl(h: number, s: number, l: number, a: number): string {
return 'hsla(' + (h % 360) + ',' + s + '%,' + l + '%,' + a + ')';
}
function canvasPoint(e: PointerEvent): Pt {
var r = canvas.getBoundingClientRect();
return { x: (e.clientX - r.left) / r.width * CALC_W, y: (e.clientY - r.top) / r.height * CALC_H };
}
// 배경 — 어두운 잉크색 위에 방사형 빛무리를 (gx, gy) 에 깐다
function beginDraw(inner: string, outer: string, gx: number, gy: number): void {
ctx.setTransform(1, 0, 0, 1, 0, 0);
ctx.fillStyle = '#1d1a2b';
ctx.fillRect(0, 0, cw, ch);
ctx.setTransform(sc, 0, 0, sc, 0, 0);
var g = ctx.createRadialGradient(gx, gy, 8, gx, gy, 230);
g.addColorStop(0, inner);
g.addColorStop(1, outer);
ctx.fillStyle = g;
ctx.fillRect(0, 0, CALC_W, CALC_H);
}
function seg(x1: number, y1: number, x2: number, y2: number, w: number, col: string): void {
ctx.beginPath();
ctx.moveTo(x1, y1);
ctx.lineTo(x2, y2);
ctx.lineCap = 'round';
ctx.lineWidth = w;
ctx.strokeStyle = col;
ctx.stroke();
}
function disc(x: number, y: number, r: number, col: string): void {
ctx.beginPath();
ctx.arc(x, y, r, 0, 6.2832);
ctx.fillStyle = col;
ctx.fill();
}
function glow(x: number, y: number, r: number, rgb: string, a: number): void {
var g = ctx.createRadialGradient(x, y, 0, x, y, r);
g.addColorStop(0, 'rgba(' + rgb + ',' + a + ')');
g.addColorStop(1, 'rgba(' + rgb + ',0)');
ctx.fillStyle = g;
ctx.fillRect(x - r, y - r, r * 2, r * 2);
}
function drawTrail(arr: Pt[], rgb: string, w: number, alpha: number): void {
ctx.lineCap = 'round';
for (var i = 1; i < arr.length; i += 1) {
var f = i / arr.length;
ctx.beginPath();
ctx.moveTo(arr[i - 1].x, arr[i - 1].y);
ctx.lineTo(arr[i].x, arr[i].y);
ctx.strokeStyle = 'rgba(' + rgb + ',' + (alpha * f * f) + ')';
ctx.lineWidth = w * (0.3 + 0.7 * f);
ctx.stroke();
}
}
function pushTrail(arr: Pt[], x: number, y: number, max: number): void {
arr.push({ x: x, y: y });
if (arr.length > max) { arr.shift(); }
}
function defaultToggle(): void {
if (reduce) {
for (var i = 0; i < REDUCE_STEP_FRAMES; i += 1) { elapsed += FIXED_DT; stepFrame(); }
draw();
setStatus('한 장면씩 넘기는 중');
return;
}
paused = !paused;
btnEl.textContent = paused ? '재생' : '멈춤';
setStatus(paused ? '일시정지됨' : '시연 중');
}
var onButton: () => void = defaultToggle;
// 기법: 같은 출발에서 오일러와 룽게-쿠타를 나란히 돌리고, 둘 다 같은 totalEnergy 식으로 처음 에너지와의 차이를 잰다
var DT = 0.01;
var SUBSTEPS = 3;
var START_T1 = 2.0;
var START_T2 = 1.6;
var EULER_LIMIT_PCT = 240;
var BAR_FULL_PCT = 120;
var SIM_RESET_FRAMES = 330;
var L1 = 1.0;
var L2 = 1.0;
var M1 = 1.0;
var M2 = 1.0;
var G = 9.81;
var UNIT = 30, PIVOT_L = 80, PIVOT_R = 240, PIVOT_Y = 90;
var PREROLL_FRAMES = 60;
// 라그랑주 운동방정식 — 각도는 아래 방향이 0, 시계 방향이 양수
function accTheta1(t1: number, t2: number, w1: number, w2: number): number {
var d = t1 - t2;
var den = L1 * (2 * M1 + M2 - M2 * Math.cos(2 * d));
return (-G * (2 * M1 + M2) * Math.sin(t1) - M2 * G * Math.sin(t1 - 2 * t2)
- 2 * Math.sin(d) * M2 * (w2 * w2 * L2 + w1 * w1 * L1 * Math.cos(d))) / den;
}
function accTheta2(t1: number, t2: number, w1: number, w2: number): number {
var d = t1 - t2;
var den = L2 * (2 * M1 + M2 - M2 * Math.cos(2 * d));
return (2 * Math.sin(d) * (w1 * w1 * L1 * (M1 + M2) + G * (M1 + M2) * Math.cos(t1)
+ w2 * w2 * L2 * M2 * Math.cos(d))) / den;
}
// 룽게-쿠타 4단계 — 한 걸음을 네 번 기울기로 평균 낸다 (s = [t1, t2, w1, w2])
function rk4Step(s: number[], h: number): void {
var t1 = s[0], t2 = s[1], w1 = s[2], w2 = s[3];
var h2 = h * 0.5;
var k1a = w1, k1b = w2, k1c = accTheta1(t1, t2, w1, w2), k1d = accTheta2(t1, t2, w1, w2);
var u1 = t1 + h2 * k1a, u2 = t2 + h2 * k1b, u3 = w1 + h2 * k1c, u4 = w2 + h2 * k1d;
var k2a = u3, k2b = u4, k2c = accTheta1(u1, u2, u3, u4), k2d = accTheta2(u1, u2, u3, u4);
u1 = t1 + h2 * k2a; u2 = t2 + h2 * k2b; u3 = w1 + h2 * k2c; u4 = w2 + h2 * k2d;
var k3a = u3, k3b = u4, k3c = accTheta1(u1, u2, u3, u4), k3d = accTheta2(u1, u2, u3, u4);
u1 = t1 + h * k3a; u2 = t2 + h * k3b; u3 = w1 + h * k3c; u4 = w2 + h * k3d;
var k4a = u3, k4b = u4, k4c = accTheta1(u1, u2, u3, u4), k4d = accTheta2(u1, u2, u3, u4);
s[0] = t1 + h / 6 * (k1a + 2 * k2a + 2 * k3a + k4a);
s[1] = t2 + h / 6 * (k1b + 2 * k2b + 2 * k3b + k4b);
s[2] = w1 + h / 6 * (k1c + 2 * k2c + 2 * k3c + k4c);
s[3] = w2 + h / 6 * (k1d + 2 * k2d + 2 * k3d + k4d);
}
function bobOne(s: number[], ox: number, oy: number): Pt {
return { x: ox + UNIT * L1 * Math.sin(s[0]), y: oy + UNIT * L1 * Math.cos(s[0]) };
}
function bobTwo(s: number[], ox: number, oy: number): Pt {
var a = bobOne(s, ox, oy);
return { x: a.x + UNIT * L2 * Math.sin(s[1]), y: a.y + UNIT * L2 * Math.cos(s[1]) };
}
function drawArms(s: number[], ox: number, oy: number, c1: string, c2: string, w: number): void {
var a = bobOne(s, ox, oy), b = bobTwo(s, ox, oy);
seg(ox, oy, a.x, a.y, w, c1);
seg(a.x, a.y, b.x, b.y, w, c2);
}
function eulerStep(s: number[], h: number): void {
var a1 = accTheta1(s[0], s[1], s[2], s[3]);
var a2 = accTheta2(s[0], s[1], s[2], s[3]);
s[0] += h * s[2];
s[1] += h * s[3];
s[2] += h * a1;
s[3] += h * a2;
}
// 전체 에너지 = 운동 + 위치 (아래 방향이 기준 0 이 되도록 높이를 잰다)
function totalEnergy(s: number[]): number {
var t1 = s[0], t2 = s[1], w1 = s[2], w2 = s[3];
var kinetic = 0.5 * (M1 + M2) * L1 * L1 * w1 * w1 + 0.5 * M2 * L2 * L2 * w2 * w2
+ M2 * L1 * L2 * w1 * w2 * Math.cos(t1 - t2);
var potential = -(M1 + M2) * G * L1 * Math.cos(t1) - M2 * G * L2 * Math.cos(t2);
return kinetic + potential;
}
var simR: number[] = [START_T1, START_T2, 0, 0];
var simE: number[] = [START_T1, START_T2, 0, 0];
var energyZero = totalEnergy(simR);
var driftR = 0, driftE = 0;
var frameCount = 0;
var trailR: Pt[] = [];
var trailE: Pt[] = [];
function drift(s: number[]): number {
var d = (totalEnergy(s) - energyZero) / Math.abs(energyZero) * 100;
return isFinite(d) ? d : 9999;
}
function restart(): void {
simR = [START_T1, START_T2, 0, 0];
simE = [START_T1, START_T2, 0, 0];
trailR = [];
trailE = [];
frameCount = 0;
}
function stepFrame(): void {
for (var i = 0; i < SUBSTEPS; i += 1) { rk4Step(simR, DT); eulerStep(simE, DT); }
driftR = drift(simR);
driftE = drift(simE);
var pr = bobTwo(simR, PIVOT_L, PIVOT_Y), pe = bobTwo(simE, PIVOT_R, PIVOT_Y);
pushTrail(trailR, pr.x, pr.y, 70);
pushTrail(trailE, pe.x, pe.y, 70);
frameCount += 1;
if (Math.abs(driftE) > EULER_LIMIT_PCT || frameCount >= SIM_RESET_FRAMES) { restart(); }
}
function bar(y: number, pct: number, rgb: string, label: string): void {
var x0 = 92, wid = 136;
ctx.fillStyle = 'rgba(255,255,255,0.12)';
ctx.fillRect(x0, y, wid, 9);
ctx.fillStyle = 'rgba(' + rgb + ',0.95)';
ctx.fillRect(x0, y, clamp(Math.abs(pct) / BAR_FULL_PCT, 0, 1) * wid, 9);
ctx.font = '8px monospace';
ctx.fillStyle = '#ffffff';
ctx.textBaseline = 'middle';
ctx.fillText(label + ' ' + (pct >= 0 ? '+' : '-') + Math.abs(pct).toFixed(3) + '%', x0 + 4, y + 4.5);
}
function draw(): void {
var pr = bobTwo(simR, PIVOT_L, PIVOT_Y), pe = bobTwo(simE, PIVOT_R, PIVOT_Y);
var heat = clamp(Math.abs(driftE) / EULER_LIMIT_PCT, 0, 1);
beginDraw(heat > 0.5 ? '#54405f' : '#463e68', '#28223f', 160, 100);
ctx.fillStyle = 'rgba(168,230,207,0.05)';
ctx.fillRect(0, 0, 160, CALC_H);
ctx.fillStyle = 'rgba(255,159,143,' + (0.04 + 0.16 * heat) + ')';
ctx.fillRect(160, 0, 160, CALC_H);
glow(pr.x, pr.y, 60, '168,230,207', 0.3);
glow(pe.x, pe.y, 60 + 30 * heat, '255,159,143', 0.3 + 0.3 * heat);
drawTrail(trailR, '168,230,207', 3.5, 0.8);
drawTrail(trailE, '255,159,143', 3.5, 0.8);
drawArms(simR, PIVOT_L, PIVOT_Y, '#a8e6cf', '#c9f1e0', 4);
drawArms(simE, PIVOT_R, PIVOT_Y, '#ff9f8f', '#ffd6c8', 4);
var ar = bobOne(simR, PIVOT_L, PIVOT_Y), ae = bobOne(simE, PIVOT_R, PIVOT_Y);
disc(PIVOT_L, PIVOT_Y, 4, '#fff1c9');
disc(PIVOT_R, PIVOT_Y, 4, '#fff1c9');
disc(ar.x, ar.y, 6, '#a8e6cf');
disc(ae.x, ae.y, 6, '#ff9f8f');
glow(pr.x, pr.y, 18, '168,230,207', 0.7);
disc(pr.x, pr.y, 7, '#c9f1e0');
glow(pe.x, pe.y, 18, '255,159,143', 0.7);
disc(pe.x, pe.y, 7, '#ffd6c8');
bar(30, driftR, '168,230,207', 'RK4');
bar(44, driftE, '255,159,143', 'Euler');
}
function fit(): void {
var r = wrap.getBoundingClientRect();
cw = Math.max(1, Math.round(r.width));
ch = Math.max(1, Math.round(r.height));
canvas.width = cw;
canvas.height = ch;
sc = cw / CALC_W;
draw();
}
var lastTs: number | null = null;
var accMs = 0;
function tick(ts: number): void {
if (lastTs === null) { lastTs = ts; }
var frameDt = Math.min(ts - lastTs, 48);
lastTs = ts;
if (!paused) {
accMs += frameDt;
while (accMs >= FIXED_DT) { elapsed += FIXED_DT; stepFrame(); accMs -= FIXED_DT; }
}
draw();
rafId = requestAnimationFrame(tick);
}
for (var w0 = 0; w0 < PREROLL_FRAMES; w0 += 1) { elapsed += FIXED_DT; stepFrame(); }
fit();
listen(window, 'resize', fit);
listen(btnEl, 'click', function (): void { onButton(); });
if (!ownInput) {
listen(canvas, 'pointerdown', function (): void { onButton(); });
listen(canvas, 'keydown', function (e: Event): void {
var k = (e as KeyboardEvent).key;
if (k === 'Enter' || k === ' ') { e.preventDefault(); onButton(); }
});
}
if (reduce) {
if (!ownInput) { btnEl.textContent = '다음 장면'; setStatus('한 장면씩 넘기는 중'); }
} else {
rafId = requestAnimationFrame(tick);
}
function destroy(): void {
cancelAnimationFrame(rafId);
for (var i = 0; i < cleaners.length; i += 1) { cleaners[i](); }
}
return destroy;
}
export default function DpEnergyDriftMeterEulerVsRk4() {
const rootRef = useRef<HTMLDivElement | null>(null);
const canvasRef = useRef<HTMLCanvasElement | null>(null);
const statusRef = useRef<HTMLParagraphElement | null>(null);
const btnRef = useRef<HTMLButtonElement | null>(null);
useEffect(() => {
const root = rootRef.current;
const canvas = canvasRef.current;
const statusEl = statusRef.current;
const btnEl = btnRef.current;
if (!root || !canvas || !statusEl || !btnEl) return;
return main(root, canvas, statusEl, btnEl);
}, []);
return (
<main className={styles.stage}>
<div className={`${styles.bp} is-demo`} ref={rootRef}>
<canvas className={styles.bp__canvas} ref={canvasRef} width={480} height={300} tabIndex={0} aria-label="같은 출발에서 오일러와 룽게-쿠타를 나란히 돌리고 처음 에너지와의 차이를 막대와 숫자로 보여, 계산법에 따라 진자가 점점 빨라지는 오류를 눈으로 잡는다." />
<p className={styles.bp__status} ref={statusRef} aria-live="polite">시연 중</p>
<button className={styles.bp__btn} ref={btnRef} type="button">멈춤</button>
<p className={styles.bp__caption}>같은 출발에서 오일러와 룽게-쿠타를 나란히 돌리고 처음 에너지와의 차이를 막대와 숫자로 보여, 계산법에 따라 진자가 점점 빨라지는 오류를 눈으로 잡는다.</p>
</div>
</main>
);
}05 Gauge Comparing How Far Each Method Drifts in Energy — Measured area 53.567% · moving frames 23/23Original by GODRICH · SCSS and React ship in the zip · Double Pendulum Simulation: 9 Chaos Scenes
The post this demo lives in
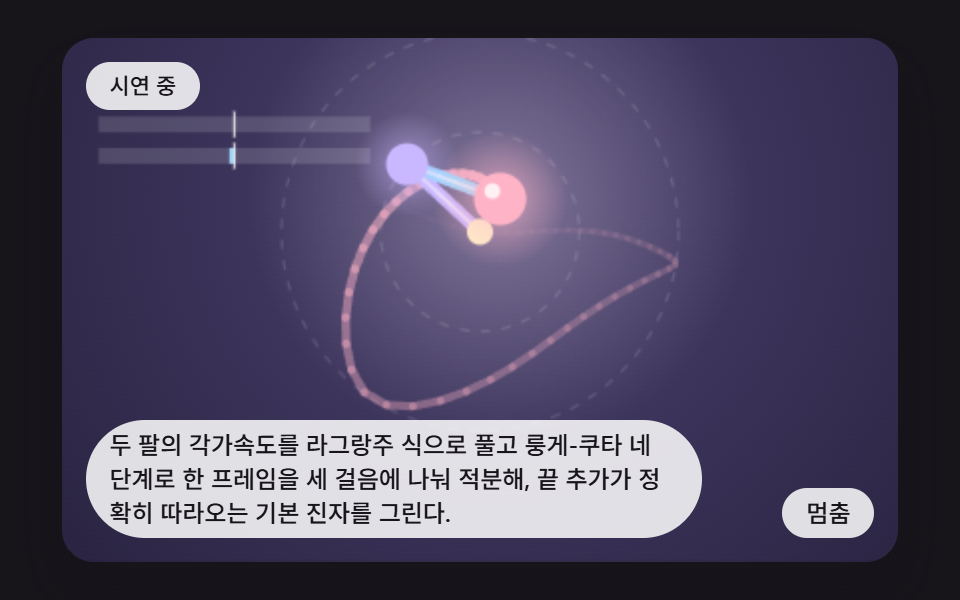 Double Pendulum Simulation: 9 Chaos ScenesChange the start angle by one millionth of a radian and the tip draws a completely different path — scene 03 stacks two See all demos in this post
If you like this effect - similar demos
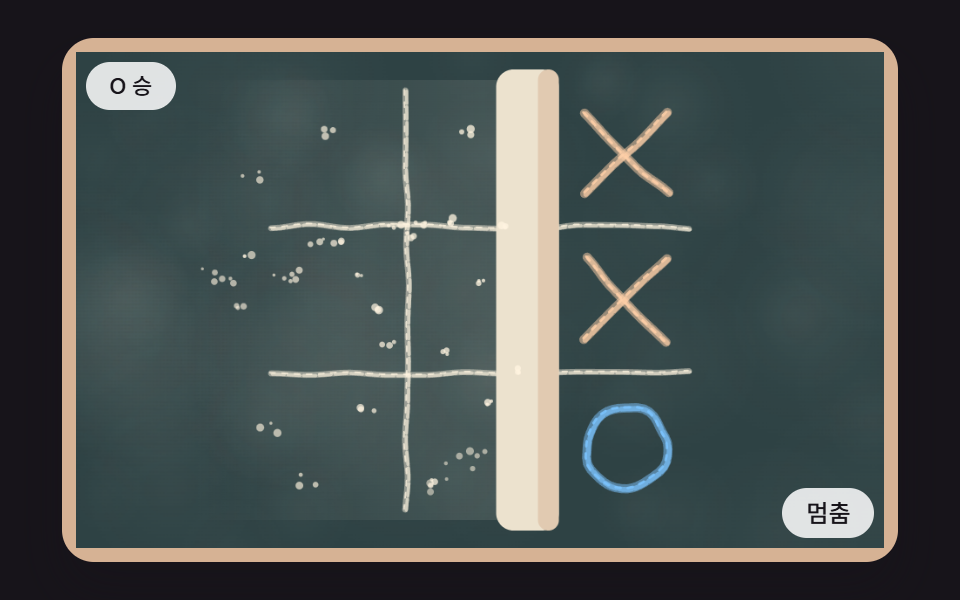 game09 A Hero Where Two AIs Play Each Other on a Chalk-Textured Board, Dust Drifts, and an Eraser Wipes It CleanCSS Tic Tac Toe: 9 Boards That Count Ahead
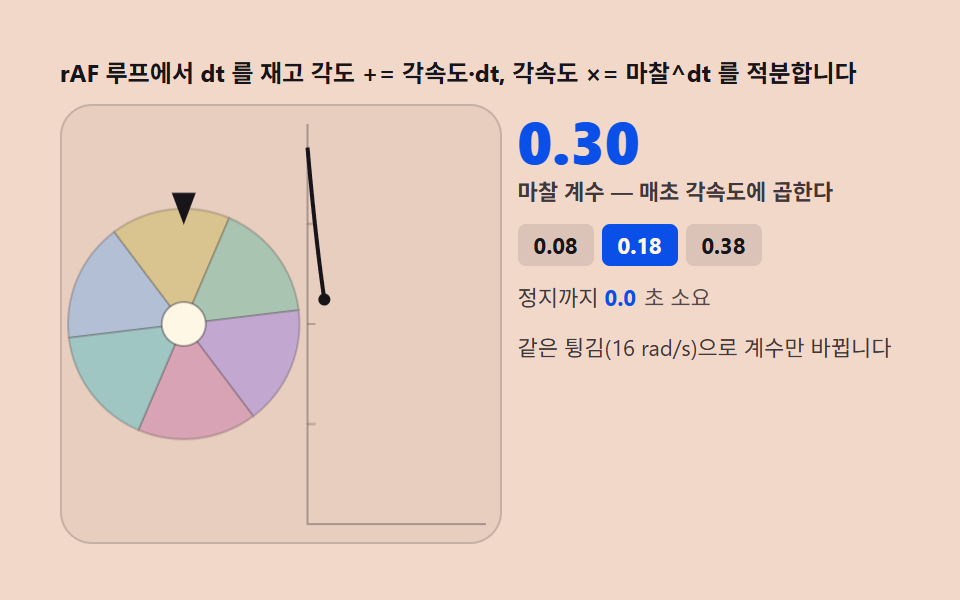 game03 Friction decay — a disc that integrates each frame to a stopSpin Wheel: 9 Canvas Roulettes, Flick to Stop
 game03 Brick Row Whose Score Rises on Each CollisionBrick Breaker Game JavaScript — 9 Physics Patterns