07Workload Leveling That Trims Days Over the Daily Capacity
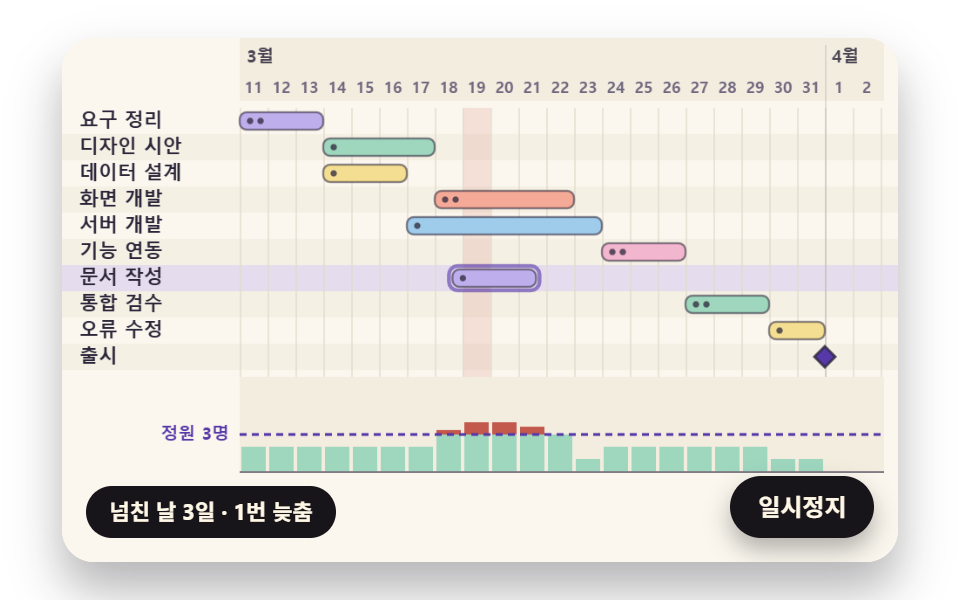
The lower bar chart adds up each day's workload to find the first day over the capacity line, then delays the task with the most slack among those starting that day by one day, repeating until no day overflows while the bars re-flow on springs.
Best forTeam staffing plan
DAY_CAPACITYLEVEL_MAX_STEPSLEVEL_STEP_MS
<main class="stage">
<div class="cf is-demo" id="cf">
  <canvas class="cf__canvas" data-role="canvas" width="480" height="300" role="img" aria-label="Workload leveling that finds days over capacity in the lower chart and delays the task with the most slack one day at a time."></canvas>
  <table class="cf__sr" data-role="table"></table>
  <p class="cf__status" data-role="status" aria-live="off">Checking daily capacity</p>
  <button class="cf__pause" data-role="pause" type="button" aria-pressed="false">Pause</button>
</div>
</main>
@use "../../../../site/static/demo-tokens" as *;
@include stage($stage-paper);
.cf {
position: relative;
width: min(92vw, calc(160vh - 12.8vw));
aspect-ratio: 480 / 300;
margin: 0 auto;
border-radius: $r-card;
overflow: hidden;
box-shadow: $shadow-raised;
background: $subject-cream;
}
.cf__canvas {
position: absolute;
inset: 0;
display: block;
width: 100%;
height: 100%;
}
.cf__pause {
position: absolute;
right: $sp-3;
bottom: $sp-3;
padding: $sp-1 $sp-3;
border: 2px solid $subject-ink;
border-radius: $r-pill;
background: $subject-ink;
color: $subject-cream;
font-family: inherit;
font-weight: 700;
font-size: 12px;
line-height: 1.6;
cursor: pointer;
box-shadow: $shadow-press;
transition: transform $dur-quick $ease-spring;
}
// 눌린 상태(멈춤) — 바탕과 글자색을 뒤집어 aria-pressed 가 눈에도 보이게
.cf__pause[aria-pressed="true"] {
background: $subject-cream;
color: $subject-ink;
}
.cf__pause:hover {
transform: translateY(-2px);
}
.cf__pause:active {
transform: translateY(1px);
}
.cf__pause:focus-visible {
outline: 3px solid $subject-ink;
outline-offset: 3px;
}
// 상태 줄 — 지금 일정에 무슨 일이 일어났는지 글자로. 시연 중에는 aria-live off, 사람이 처음 손대면 polite
.cf__status {
position: absolute;
left: $sp-3;
bottom: $sp-3;
max-width: calc(100% - 120px);
margin: 0;
padding: $sp-1 $sp-3;
border-radius: $r-pill;
background: $subject-ink;
color: $subject-cream;
font-weight: 700;
font-size: 11px;
line-height: 1.6;
white-space: nowrap;
overflow: hidden;
text-overflow: ellipsis;
pointer-events: none;
}
// 숨김 표 — 화면에서는 1px 로 접어 두고 화면 읽기 도구만 읽는다
.cf__sr {
position: absolute;
width: 1px;
height: 1px;
margin: -1px;
padding: 0;
overflow: hidden;
clip: rect(0 0 0 0);
clip-path: inset(50%);
white-space: nowrap;
border: 0;
}
@media (max-width: 340px) {
.cf__pause,
.cf__status { font-size: 10px; padding: $sp-1 $sp-2; }
}
// 동작 줄이기 — 장면은 스크립트가 최종 배치 한 장으로 멈춘다. 버튼도 떠오르지 않게
@media (prefers-reduced-motion: reduce) {
.cf__pause { transition: none !important; }
.cf__pause:hover,
.cf__pause:active { transform: none !important; }
}html, body {
margin: 0;
overflow: hidden;
}
.stage {
box-sizing: border-box;
min-height: 100vh;
display: grid;
place-items: center;
margin: 0;
background: #ffffff;
font-family: -apple-system, "Segoe UI", "Noto Sans KR", sans-serif;
padding: clamp(8px, 4vw, 24px);
}
.cf {
position: relative;
width: min(92vw, 160vh - 12.8vw);
aspect-ratio: 480/300;
margin: 0 auto;
border-radius: 16px;
overflow: hidden;
box-shadow: 0 14px 24px rgba(23, 20, 26, 0.32);
background: #fff7e6;
}
.cf__canvas {
position: absolute;
inset: 0;
display: block;
width: 100%;
height: 100%;
}
.cf__pause {
position: absolute;
right: 12px;
bottom: 12px;
padding: 4px 12px;
border: 2px solid #17141a;
border-radius: 999px;
background: #17141a;
color: #fff7e6;
font-family: inherit;
font-weight: 700;
font-size: 12px;
line-height: 1.6;
cursor: pointer;
box-shadow: 0 6px 12px rgba(23, 20, 26, 0.32);
transition: transform 220ms cubic-bezier(0.2, 0.8, 0.2, 1);
}
.cf__pause[aria-pressed=true] {
background: #fff7e6;
color: #17141a;
}
.cf__pause:hover {
transform: translateY(-2px);
}
.cf__pause:active {
transform: translateY(1px);
}
.cf__pause:focus-visible {
outline: 3px solid #17141a;
outline-offset: 3px;
}
.cf__status {
position: absolute;
left: 12px;
bottom: 12px;
max-width: calc(100% - 120px);
margin: 0;
padding: 4px 12px;
border-radius: 999px;
background: #17141a;
color: #fff7e6;
font-weight: 700;
font-size: 11px;
line-height: 1.6;
white-space: nowrap;
overflow: hidden;
text-overflow: ellipsis;
pointer-events: none;
}
.cf__sr {
position: absolute;
width: 1px;
height: 1px;
margin: -1px;
padding: 0;
overflow: hidden;
clip: rect(0 0 0 0);
clip-path: inset(50%);
white-space: nowrap;
border: 0;
}
@media (max-width: 340px) {
.cf__pause,
.cf__status {
font-size: 10px;
padding: 4px 8px;
}
}
@media (prefers-reduced-motion: reduce) {
.cf__pause {
transition: none !important;
}
.cf__pause:hover,
.cf__pause:active {
transform: none !important;
}
}(function () {
const root = document.getElementById("cf");
if (!root) return;
// 판 좌표 — 캔버스 안은 늘 480×300. 화면에 보이는 크기와 상관없이 계산은 이 좌표로 한다
const W = 480;
const H = 300;
const TAU = Math.PI * 2;
function clamp(v, lo, hi) { return v < lo ? lo : (v > hi ? hi : v); }
function lerp(a, b, k) { return a + (b - a) * k; }
function smooth(x) { const c = clamp(x, 0, 1); return c * c * (3 - 2 * c); }
// 따라가기 비율 — 1 − e^(−rate·dt). 프레임 시간이 달라도 1초에 같은 만큼 다가간다
function follow(rate, dt) { return 1 - Math.exp(-rate * dt); }
// 시드 고정 난수 — 같은 시드면 같은 일정이 다시 나온다 (32비트 정수 섞기)
function makeRng(seed) {
let s = seed >>> 0;
return function () {
s = (s + 0x6d2b79f5) >>> 0;
let t = s;
t = Math.imul(t ^ (t >>> 15), t | 1);
t ^= t + Math.imul(t ^ (t >>> 7), t | 61);
return ((t ^ (t >>> 14)) >>> 0) / 4294967296;
};
}
function makeSpring(x) { return { x: x, v: 0, to: x }; }
const SPRING_SUBSTEP = 1 / 240;
function stepSpring(s, stiffness, damping, dt) {
let left = dt;
while (left > 1e-9) {
const h = Math.min(SPRING_SUBSTEP, left);
s.v += (stiffness * (s.to - s.x) - damping * s.v) * h;
s.x += s.v * h;
left -= h;
}
}
function snapSpring(s, x) { s.x = x; s.v = 0; s.to = x; }
// ── 날짜 = 정수 일수 ─────────────────────────────────────────
// 날짜 객체를 쓰지 않는다. 기준일을 0 으로 세는 정수 일수(day index)만 다루고, 화면의 월·일 숫자는 아래 월 길이 표로 산수해 만든다
const MONTH_DAYS = [31, 28, 31, 30, 31, 30, 31, 31, 30, 31, 30, 31];
const YEAR_DAYS = 365;
// 기준일(일수 0) = 한 해의 70번째 날 → 표로 세면 3월 11일
const DAY_ZERO_OF_YEAR = 69;
function calendarOf(day) {
let r = ((day + DAY_ZERO_OF_YEAR) % YEAR_DAYS + YEAR_DAYS) % YEAR_DAYS;
let m = 0;
while (r >= MONTH_DAYS[m]) {
r -= MONTH_DAYS[m];
m += 1;
}
return [m + 1, r + 1];
}
const DAY_FMT = 'Day {n}';
const WEEK_FMT = 'Week {n}';
const MONTH_FMT = 'Month {n}';
const SLACK_FMT = '{n}d';
function dayText(day) { return DAY_FMT.replace('{n}', String(day + 1)); }
// 하루 차 계산의 함정 — 시각(시간 단위)끼리 빼서 24 로 나누면, 시계가 한 시간 당겨진 날이 끼었을 때 정수가 아니다(23시간짜리 하루).
// 그래서 바깥에서 들어온 시각은 반올림으로 정수 일수에 붙이고, 그다음부터는 정수끼리만 더하고 뺀다
const HOURS_PER_DAY = 24;
const CLOCK_SHIFT_HOURS = 1;
function hoursToDayIndex(hours) { return Math.round(hours / HOURS_PER_DAY); }
const BASE_TASKS = [
{ name: 'Requirements', dur: 3, deps: [], load: 2 },
{ name: 'Design draft', dur: 4, deps: [0], load: 1 },
{ name: 'Data design', dur: 3, deps: [0], load: 1 },
{ name: 'UI build', dur: 5, deps: [1], load: 2 },
{ name: 'Server build', dur: 7, deps: [2], load: 1 },
{ name: 'Integration', dur: 3, deps: [3, 4], load: 2 },
{ name: 'Docs', dur: 3, deps: [1], load: 1 },
{ name: 'QA review', dur: 3, deps: [5], load: 2 },
{ name: 'Bug fixes', dur: 2, deps: [7], load: 1 },
{ name: 'Launch', dur: 0, deps: [8, 6], load: 0 }
];
function copyTasks(ts) { return ts.map(function (t) { return { name: t.name, dur: t.dur, deps: t.deps.slice(), load: t.load }; }); }
function successorsOf(tasks) {
const out = tasks.map(function () { return []; });
tasks.forEach(function (t, i) { t.deps.forEach(function (p) { out[p].push(i); }); });
return out;
}
function sortByDeps(tasks) {
const succ = successorsOf(tasks);
const waiting = tasks.map(function (t) { return t.deps.length; });
const ready = [];
waiting.forEach(function (w, i) { if (w === 0) {
ready.push(i);
} });
const order = [];
while (ready.length) {
ready.sort(function (a, b) { return a - b; });
const i = ready.shift();
order.push(i);
succ[i].forEach(function (j) { waiting[j] -= 1; if (waiting[j] === 0) {
ready.push(j);
} });
}
const stuck = [];
waiting.forEach(function (w, i) { if (w > 0) {
stuck.push(i);
} });
return { order: order, stuck: stuck };
}
function sweepBoth(tasks, order, minStart) {
const n = tasks.length;
const es = new Array(n).fill(0);
const ef = new Array(n).fill(0);
for (const i of order) {
let s = minStart ? minStart[i] : 0;
for (const p of tasks[i].deps) {
s = Math.max(s, ef[p]);
}
es[i] = s;
ef[i] = s + tasks[i].dur;
}
let end = 0;
for (const i of order) {
end = Math.max(end, ef[i]);
}
const succ = successorsOf(tasks);
const ls = new Array(n).fill(0);
const lf = new Array(n).fill(0);
for (let k = order.length - 1; k >= 0; k -= 1) {
const i = order[k];
let f = end;
for (const j of succ[i]) {
f = Math.min(f, ls[j]);
}
lf[i] = f;
ls[i] = f - tasks[i].dur;
}
const slack = es.map(function (s, i) { return ls[i] - s; });
return { es: es, ef: ef, ls: ls, lf: lf, slack: slack, end: end };
}
function pushFrom(tasks, starts, from) {
const succ = successorsOf(tasks);
const out = starts.slice();
const depth = tasks.map(function () { return -1; });
depth[from] = 0;
const queue = [from];
let head = 0;
// 고리가 있어도 끝나도록 꺼내는 횟수에 상한을 둔다
const limit = tasks.length * tasks.length + 1;
while (head < queue.length && head < limit) {
const i = queue[head];
head += 1;
for (const j of succ[i]) {
let need = 0;
for (const p of tasks[j].deps) {
need = Math.max(need, out[p] + tasks[p].dur);
}
if (need > out[j]) {
out[j] = need;
depth[j] = Math.max(depth[j], depth[i] + 1);
queue.push(j);
}
}
}
return { starts: out, depth: depth };
}
// 날마다 걸린 일감 — 작업이 덮는 날(시작 ≤ 날 < 시작 + 일수)마다 사람 수를 더한다
function dailyLoad(tasks, starts, days) {
const load = new Array(days).fill(0);
tasks.forEach(function (t, i) {
for (let d = starts[i]; d < starts[i] + t.dur; d += 1) {
if (d >= 0 && d < days) {
load[d] += t.load;
}
}
});
return load;
}
// ── 직각 경로 ───────────────────────────────────────────────
// 앞 끝(ex, ey)에서 오른쪽으로 ROUTE_STUB 나간 뒤 아래로 꺾는다. 뒤 시작(sx)이 그 꺾인 자리 + ROUTE_STUB 보다 오른쪽이면 곧장 내려가 오른쪽으로 들어가고,
// 아니면 앞 행 바로 아래 통로(gapY)까지 내려가 왼쪽으로 돌아간 다음 뒤 시작보다 ROUTE_STUB 앞에서 내려가 오른쪽으로 들어간다
const ROUTE_STUB = 7;
function elbowRoute(ex, ey, sx, sy, gapY) {
const x1 = ex + ROUTE_STUB;
if (sx - ROUTE_STUB >= x1) {
return [ex, ey, x1, ey, x1, sy, sx, sy];
}
const x2 = sx - ROUTE_STUB;
return [ex, ey, x1, ey, x1, gapY, x2, gapY, x2, sy, sx, sy];
}
function routeLength(pts) {
let s = 0;
for (let i = 2; i < pts.length; i += 2) {
s += Math.hypot(pts[i] - pts[i - 2], pts[i + 1] - pts[i - 1]);
}
return s;
}
// 경로 위 거리 dist 자리의 점과 그 마디의 방향
function pointOnRoute(pts, dist) {
let left = Math.max(0, dist);
for (let i = 2; i < pts.length; i += 2) {
const dx = pts[i] - pts[i - 2];
const dy = pts[i + 1] - pts[i - 1];
const len = Math.hypot(dx, dy);
if (left <= len || i === pts.length - 2) {
const k = len > 0 ? Math.min(1, left / len) : 0;
return [pts[i - 2] + dx * k, pts[i - 1] + dy * k, len > 0 ? dx / len : 1, len > 0 ? dy / len : 0];
}
left -= len;
}
return [pts[0], pts[1], 1, 0];
}
// 경로를 앞에서부터 dist 만큼만 자른 점 목록 — 화살표가 그려져 나가는 장면에 쓴다
function cutRoute(pts, dist) {
const out = [pts[0], pts[1]];
let left = Math.max(0, dist);
for (let i = 2; i < pts.length; i += 2) {
const len = Math.hypot(pts[i] - pts[i - 2], pts[i + 1] - pts[i - 1]);
if (left >= len) {
out.push(pts[i], pts[i + 1]);
left -= len;
continue;
}
const k = len > 0 ? left / len : 0;
out.push(lerp(pts[i - 2], pts[i], k), lerp(pts[i - 1], pts[i + 1], k));
break;
}
return out;
}
// 장면 시계(초)와 상태 줄 글자 — 장면 계산이 고치고, 화면 쪽이 읽어 그린다
let sceneT = 0;
let simStatus = '';
// 파스텔 팔레트 — 크림 바탕 위 라벤더·민트·버터·산호 막대. 가장 긴 경로·오늘 선·글자는 진한 쪽으로 명도 차를 둔다
const PAPER = [251, 247, 238];
const PAPER_DIM = [243, 237, 224];
const GRID = [226, 218, 204];
const INK = [44, 38, 58];
const INK_SOFT = [112, 104, 126];
const CREAM = [255, 251, 242];
const LAVENDER = [190, 174, 236];
const MINT = [158, 214, 190];
const BUTTER = [244, 222, 146];
const CORAL = [244, 170, 150];
const SKY = [160, 204, 236];
const PINK = [242, 182, 206];
const PATH_DEEP = [86, 56, 168];
const TODAY_DEEP = [190, 72, 60];
const BAR_COLORS = [LAVENDER, MINT, BUTTER, CORAL, SKY, PINK];
function rgba(c, a) {
return 'rgba(' + Math.round(clamp(c[0], 0, 255)) + ',' + Math.round(clamp(c[1], 0, 255)) + ',' + Math.round(clamp(c[2], 0, 255)) + ',' + clamp(a, 0, 1).toFixed(3) + ')';
}
function mix(a, b, k) { return [lerp(a[0], b[0], k), lerp(a[1], b[1], k), lerp(a[2], b[2], k)]; }
// 표 한 줄 — 작업·시작·끝·여유. 끝은 그 작업이 덮는 마지막 날(일수 0 짜리는 시작과 같은 날)
function tableRow(name, start, dur, slack) {
return [name, dayText(start), dayText(start + Math.max(0, dur - 1)), SLACK_FMT.replace('{n}', String(slack))];
}
const canvasEl = root.querySelector('[data-role="canvas"]');
const pauseEl = root.querySelector('[data-role="pause"]');
const tableEl = root.querySelector('[data-role="table"]');
const statusEl = root.querySelector('[data-role="status"]');
const ctxRaw = canvasEl ? canvasEl.getContext('2d') : null;
if (!canvasEl || !ctxRaw || !pauseEl) {
return;
}
const cv = canvasEl;
const ctx = ctxRaw;
const pauseBtn = pauseEl;
const FONT_STACK = 'system-ui, -apple-system, "Segoe UI", "Noto Sans KR", sans-serif';
function fitCanvas() {
// 배율은 2 에서 자른다 — 배율 3 기기에서 화소가 2.25배로 늘어 프레임마다 일이 그만큼 커지지 않게
const dpr = Math.min(window.devicePixelRatio || 1, 2);
cv.width = Math.round(W * dpr);
cv.height = Math.round(H * dpr);
ctx.setTransform(dpr, 0, 0, dpr, 0, 0);
}
function clearStage() {
ctx.fillStyle = rgba(PAPER, 1);
ctx.fillRect(0, 0, W, H);
}
function label(s, x, y, c, a, px, weight, align) {
ctx.font = weight + ' ' + px + 'px ' + FONT_STACK;
ctx.textAlign = align;
ctx.textBaseline = 'middle';
ctx.fillStyle = rgba(c, a);
ctx.fillText(s, x, y);
}
function roundRectPath(x, y, w, h, r) {
const rr = Math.max(0, Math.min(r, w / 2, h / 2));
ctx.beginPath();
ctx.moveTo(x + rr, y);
ctx.lineTo(x + w - rr, y);
ctx.arcTo(x + w, y, x + w, y + rr, rr);
ctx.lineTo(x + w, y + h - rr);
ctx.arcTo(x + w, y + h, x + w - rr, y + h, rr);
ctx.lineTo(x + rr, y + h);
ctx.arcTo(x, y + h, x, y + h - rr, rr);
ctx.lineTo(x, y + rr);
ctx.arcTo(x, y, x + rr, y, rr);
ctx.closePath();
}
// 막대 하나 — 둥근 사각형 채움 + 진한 테두리. 폭이 0 이하이면 그리지 않는다
function bar(x, y, w, h, fill, a, line) {
if (w <= 0.2 || a <= 0) {
return;
}
roundRectPath(x, y, w, h, 4);
ctx.fillStyle = rgba(fill, a);
ctx.fill();
if (line > 0) {
ctx.lineWidth = line;
ctx.strokeStyle = rgba(INK, 0.55 * a);
ctx.stroke();
}
}
// 마일스톤 마름모
function diamond(cx, cy, r, fill, a) {
if (r <= 0.2 || a <= 0) {
return;
}
ctx.beginPath();
ctx.moveTo(cx, cy - r);
ctx.lineTo(cx + r, cy);
ctx.lineTo(cx, cy + r);
ctx.lineTo(cx - r, cy);
ctx.closePath();
ctx.fillStyle = rgba(fill, a);
ctx.fill();
ctx.lineWidth = 1.5;
ctx.strokeStyle = rgba(INK, 0.8 * a);
ctx.stroke();
}
function polyline(pts, c, a, width) {
if (pts.length < 4) {
return;
}
ctx.beginPath();
ctx.moveTo(pts[0], pts[1]);
for (let i = 2; i < pts.length; i += 2) {
ctx.lineTo(pts[i], pts[i + 1]);
}
ctx.lineWidth = width;
ctx.lineJoin = 'round';
ctx.lineCap = 'round';
ctx.strokeStyle = rgba(c, a);
ctx.stroke();
}
function arrowHead(x, y, dx, dy, size, c, a) {
ctx.beginPath();
ctx.moveTo(x, y);
ctx.lineTo(x - dx * size - dy * size * 0.6, y - dy * size + dx * size * 0.6);
ctx.lineTo(x - dx * size + dy * size * 0.6, y - dy * size - dx * size * 0.6);
ctx.closePath();
ctx.fillStyle = rgba(c, a);
ctx.fill();
}
// 빗금 — (x, y, w, h) 안에 45° 줄을 spacing 간격으로. 간격이 좁을수록 짙어 보인다
function hatch(x, y, w, h, spacing, c, a) {
if (w <= 0.5 || a <= 0) {
return;
}
ctx.save();
roundRectPath(x, y, w, h, 3);
ctx.clip();
ctx.beginPath();
for (let s = x - h; s < x + w; s += Math.max(2, spacing)) {
ctx.moveTo(s, y + h);
ctx.lineTo(s + h, y);
}
ctx.lineWidth = 1.6;
ctx.strokeStyle = rgba(c, a);
ctx.stroke();
ctx.restore();
}
// 시간 축 — 위 띠는 월 이름, 아래 띠는 일(월 안의 날 숫자)·주(주차) 층. 층마다 불투명도를 따로 받아 겹쳐 흐려지며 바뀌게 한다.
// 세로 격자도 같은 불투명도로 행 영역(top~bottom)에 긋는다. xOf 는 일수 → 화면 x
function timeAxis(xOf, dayW, d0, d1, left, right, top, bottom, ly) {
ctx.save();
ctx.beginPath();
ctx.rect(left, 0, right - left, H);
ctx.clip();
ctx.fillStyle = rgba(PAPER_DIM, 1);
ctx.fillRect(left, 0, right - left, top - 4);
for (let d = Math.floor(d0); d <= Math.ceil(d1); d += 1) {
const x = xOf(d);
const cal = calendarOf(d);
if (ly.day > 0.01) {
ctx.fillStyle = rgba(GRID, 0.7 * ly.day);
ctx.fillRect(x, top, 1, bottom - top);
if (dayW >= 13) {
label(String(cal[1]), x + dayW / 2, top - 11, INK_SOFT, ly.day, 9, 600, 'center');
}
}
// 주 층 — 글자가 겹치지 않을 만큼(36px) 주를 건너뛰며 적는다
const weekStep = 7 * dayW >= 36 ? 1 : (14 * dayW >= 36 ? 2 : 4);
if (ly.week > 0.01 && d % 7 === 0) {
ctx.fillStyle = rgba(GRID, ly.week);
ctx.fillRect(x, top, 1, bottom - top);
if ((d / 7) % weekStep === 0) {
label(WEEK_FMT.replace('{n}', String(d / 7 + 1)), x + 3, top - 11, INK_SOFT, ly.week, 9, 600, 'left');
}
}
if (cal[1] === 1) {
ctx.fillStyle = rgba(INK_SOFT, 0.18 + 0.4 * ly.month);
ctx.fillRect(x, 4, 1, bottom - 4);
label(MONTH_FMT.replace('{n}', String(cal[0])), x + 4, 11, INK, 0.85, 10, 700, 'left');
// 월 층 — 그달 칸 가운데에 그달 일수(월 길이 표에서)를 적는다
const len = MONTH_DAYS[cal[0] - 1];
if (ly.month > 0.01 && len * dayW >= 30) {
label(SLACK_FMT.replace('{n}', String(len)), x + len * dayW / 2, top - 11, INK_SOFT, ly.month, 9, 700, 'center');
}
}
else if (d === Math.floor(d0)) {
// 왼쪽 끝 월 이름 — 바로 오른쪽에 새 달이 시작하면 겹치므로 적지 않는다
const toNext = MONTH_DAYS[cal[0] - 1] - cal[1] + 1;
if (toNext * dayW >= 44) {
label(MONTH_FMT.replace('{n}', String(cal[0])), Math.max(x, left) + 4, 11, INK, 0.85, 10, 700, 'left');
}
}
}
ctx.restore();
}
// 왼쪽 Task 칸
function rowLabel(name, y, a, bold) {
label(name, 10, y, INK, a, 11, bold ? 800 : 600, 'left');
}
function rowStripe(y, h, i, a) {
if (i % 2 === 1) {
ctx.fillStyle = rgba(PAPER_DIM, 0.75 * a);
ctx.fillRect(0, y, W, h);
}
}
// 움직이는 행 빛 — 그 행 막대의 스프링 속도(k = 0~1)만큼 행 전체가 옅은 라벤더로 밝아진다. 막대가 서면 사라진다
function rowGlow(y, h, k) {
if (k <= 0.01) {
return;
}
ctx.fillStyle = rgba(LAVENDER, 0.42 * clamp(k, 0, 1));
ctx.fillRect(0, y, W, h);
}
// 상태 줄 — 바뀔 때만 글자를 고친다
let shownStatus = '';
function pushStatus() {
if (!statusEl || simStatus === shownStatus) {
return;
}
shownStatus = simStatus;
statusEl.textContent = simStatus;
}
// 숨김 표 — 같은 일정을 작업·시작·끝·여유 열로 읽게. 화면에는 안 보이고 화면 읽기 도구가 읽는다
const TABLE_HEAD = ['Task', 'Start', 'End', 'Slack'];
function fillTable(caption, rows) {
if (!tableEl) {
return;
}
const tb = tableEl;
while (tb.firstChild) {
tb.removeChild(tb.firstChild);
}
const cap = document.createElement('caption');
cap.textContent = caption;
tb.appendChild(cap);
const thead = document.createElement('thead');
const hr = document.createElement('tr');
TABLE_HEAD.forEach(function (h) {
const th = document.createElement('th');
th.scope = 'col';
th.textContent = h;
hr.appendChild(th);
});
thead.appendChild(hr);
tb.appendChild(thead);
const body = document.createElement('tbody');
rows.forEach(function (r) {
const tr = document.createElement('tr');
r.forEach(function (c, k) {
const cell = document.createElement(k === 0 ? 'th' : 'td');
if (k === 0) {
cell.scope = 'row';
}
cell.textContent = c;
tr.appendChild(cell);
});
body.appendChild(tr);
});
tb.appendChild(body);
}
// 07 — 인력 부하 평준화. 날마다 걸린 사람 수를 더해 DAY_CAPACITY 를 넘는 첫날을 찾고, 그날 걸린 작업 중 여유가 가장 큰 것을 하루 늦춘다(뒤 작업은 pushFrom 으로 따라 밀림). 넘침이 0 이 되거나 LEVEL_MAX_STEPS 에 닿을 때까지 되풀이
const LABEL_W = 96;
const PLOT_X = LABEL_W + 6;
const PLOT_R = W - 8;
const ROWS_TOP = 40;
const ROW_H = 15;
const BAR_H = 10;
const HIST_BASE = 248;
const HIST_UNIT = 7;
const DAY_CAPACITY = 3;
const LEVEL_MAX_STEPS = 40;
const LEVEL_START_S = 0.3;
const LEVEL_STEP_MS = 150;
// 막대 이동·그래프 높이 스프링
const LEVEL_STIFFNESS = 260;
const LEVEL_DAMPING = 20;
const TABLE_CAPTION = 'Task schedule after fitting the daily capacity';
const STATUS_LEVEL = 'Overbooked days {n} · {m} delays';
const STATUS_DONE = 'Overbooked days 0 · {m} delays · total {a} → {b}';
const tasks07 = BASE_TASKS;
const order07 = sortByDeps(tasks07).order;
const first07 = sweepBoth(tasks07, order07, null);
function overflowDays(load, cap) { return load.filter(function (v) { return v > cap; }).length; }
function levelSteps(tasks, startsIn, cap, maxSteps) {
const steps = [];
let starts = startsIn.slice();
const order = sortByDeps(tasks).order;
for (let s = 0; s < maxSteps; s += 1) {
const span = Math.max.apply(null, starts.map(function (v, i) { return v + tasks[i].dur; })) + 1;
const load = dailyLoad(tasks, starts, span);
const day = load.findIndex(function (v) { return v > cap; });
if (day < 0) {
break;
}
// 지금 배치 기준의 여유 — 정해 둔 시작일을 지키며 앞뒤로 훑는다
const sw = sweepBoth(tasks, order, starts);
let pick = -1;
// 후보는 그날 「시작하는」 작업만 — 이미 시작한 작업은 건드리지 않는다. 첫 넘침 날은 전날보다 일감이 늘어난 날이라 그날 시작하는 작업이 늘 하나 이상 있고,
// 시작한 작업까지 후보로 두면 겹친 작업들이 여유를 주고받으며 번갈아 하루씩 밀려 끝없이 뛰어넘는다(정원 2 에서 40번을 다 쓰고도 넘침 5일)
tasks.forEach(function (t, i) {
if (t.load === 0 || starts[i] !== day) {
return;
}
if (pick < 0 || sw.slack[i] > sw.slack[pick] || (sw.slack[i] === sw.slack[pick] && i > pick)) {
pick = i;
}
});
if (pick < 0) {
break;
}
const nudged = starts.slice();
nudged[pick] += 1;
starts = pushFrom(tasks, nudged, pick).starts;
const after = dailyLoad(tasks, starts, span + 1);
steps.push({ starts: starts.slice(), moved: pick, day: day, over: overflowDays(after, cap) });
}
return steps;
}
const steps07 = levelSteps(tasks07, first07.es, DAY_CAPACITY, LEVEL_MAX_STEPS);
const final07 = steps07.length ? steps07[steps07.length - 1].starts : first07.es;
const endBefore07 = first07.end;
const endAfter07 = Math.max.apply(null, final07.map(function (v, i) { return v + tasks07[i].dur; }));
const SPAN07 = endAfter07 + 1;
const DAY_WIDTH = Math.min(16, (PLOT_R - PLOT_X) / SPAN07);
const LOOP_S = LEVEL_START_S + steps07.length * LEVEL_STEP_MS / 1000 + 3.2;
const startS07 = tasks07.map(function (_, i) { return makeSpring(first07.es[i]); });
const histS07 = new Array(SPAN07).fill(0).map(function () { return makeSpring(0); });
let stepNow07 = 0;
let flash07 = -1;
let flashT07 = 0;
function startsAt(k) { return k <= 0 ? first07.es : steps07[k - 1].starts; }
function setHistTargets(starts, snap) {
const load = dailyLoad(tasks07, starts, SPAN07);
histS07.forEach(function (s, d) { if (snap) {
snapSpring(s, load[d]);
}
else {
s.to = load[d];
} });
}
function reset() {
stepNow07 = 0;
flash07 = -1;
tasks07.forEach(function (_, i) { snapSpring(startS07[i], first07.es[i]); });
setHistTargets(first07.es, true);
}
function statusFor(k) {
const load = dailyLoad(tasks07, startsAt(k), SPAN07);
const over = overflowDays(load, DAY_CAPACITY);
if (over === 0) {
return STATUS_DONE.replace('{m}', String(k)).replace('{a}', SLACK_FMT.replace('{n}', String(endBefore07))).replace('{b}', SLACK_FMT.replace('{n}', String(endAfter07)));
}
return STATUS_LEVEL.replace('{n}', String(over)).replace('{m}', String(k));
}
function update(dt) {
const k = clamp(Math.floor((sceneT - LEVEL_START_S) / (LEVEL_STEP_MS / 1000)) + 1, 0, steps07.length);
if (k !== stepNow07) {
stepNow07 = k;
if (k > 0) {
flash07 = steps07[k - 1].moved;
flashT07 = 0;
}
const st = startsAt(k);
tasks07.forEach(function (_, i) { startS07[i].to = st[i]; });
setHistTargets(st, false);
}
flashT07 += dt;
startS07.forEach(function (s) { stepSpring(s, LEVEL_STIFFNESS, LEVEL_DAMPING, dt); });
histS07.forEach(function (s) { stepSpring(s, LEVEL_STIFFNESS, LEVEL_DAMPING, dt); });
simStatus = statusFor(stepNow07);
}
function restPose() {
stepNow07 = steps07.length;
flash07 = -1;
tasks07.forEach(function (_, i) { snapSpring(startS07[i], final07[i]); });
setHistTargets(final07, true);
simStatus = statusFor(stepNow07);
}
function tableRows() {
const sw = sweepBoth(tasks07, order07, final07);
return tasks07.map(function (t, i) { return tableRow(t.name, final07[i], t.dur, sw.slack[i]); });
}
const CAP_FMT = 'Capacity {n}';
function dayX(d) { return PLOT_X + d * DAY_WIDTH; }
function rowMid(i) { return ROWS_TOP + i * ROW_H + ROW_H / 2; }
function draw() {
clearStage();
const bottom = ROWS_TOP + tasks07.length * ROW_H;
tasks07.forEach(function (_, i) { rowStripe(ROWS_TOP + i * ROW_H, ROW_H, i, 1); rowGlow(ROWS_TOP + i * ROW_H, ROW_H, Math.abs(startS07[i].v) / 8); });
// 지금 살피는 날 — 다음 걸음이 고칠 「넘치는 첫날」 칸을 행부터 그래프까지 세로 띠로
if (stepNow07 < steps07.length && sceneT >= LEVEL_START_S - 0.1) {
const sd = steps07[stepNow07].day;
ctx.fillStyle = rgba(TODAY_DEEP, 0.13);
ctx.fillRect(dayX(sd), ROWS_TOP, DAY_WIDTH, HIST_BASE - ROWS_TOP);
}
timeAxis(dayX, DAY_WIDTH, 0, SPAN07 + 1, PLOT_X, PLOT_R, ROWS_TOP, HIST_BASE, { day: 1, week: 0, month: 0 });
const fl = flash07 >= 0 ? Math.exp(-flashT07 * 5) : 0;
tasks07.forEach(function (t, i) {
const cy = rowMid(i);
rowLabel(t.name, cy, 1, i === flash07 && fl > 0.2);
const x0 = dayX(startS07[i].x);
if (t.dur === 0) {
diamond(x0, cy, 6, PATH_DEEP, 1);
return;
}
bar(x0, cy - BAR_H / 2, t.dur * DAY_WIDTH, BAR_H, BAR_COLORS[i % BAR_COLORS.length], 1, 1.2);
// 사람 수 점 — 막대 안에 한 사람당 점 하나
for (let p = 0; p < t.load; p += 1) {
ctx.beginPath();
ctx.arc(x0 + 6 + p * 6, cy, 1.8, 0, TAU);
ctx.fillStyle = rgba(INK, 0.75);
ctx.fill();
}
if (i === flash07 && fl > 0.01) {
roundRectPath(x0 - 2, cy - BAR_H / 2 - 2, t.dur * DAY_WIDTH + 4, BAR_H + 4, 5);
ctx.lineWidth = 2.2;
ctx.strokeStyle = rgba(PATH_DEEP, fl);
ctx.stroke();
}
});
// 날마다 일감 막대 — 정원을 넘는 몫은 진한 색으로
const capY = HIST_BASE - DAY_CAPACITY * HIST_UNIT;
ctx.fillStyle = rgba(PAPER_DIM, 1);
ctx.fillRect(PLOT_X, bottom + 4, PLOT_R - PLOT_X, HIST_BASE - bottom - 4);
histS07.forEach(function (s, d) {
const v = Math.max(0, s.x);
if (v < 0.02) {
return;
}
const x = dayX(d) + 1;
const w = DAY_WIDTH - 2;
const h = v * HIST_UNIT;
const okH = Math.min(h, DAY_CAPACITY * HIST_UNIT);
ctx.fillStyle = rgba(MINT, 1);
ctx.fillRect(x, HIST_BASE - okH, w, okH);
if (h > okH) {
ctx.fillStyle = rgba(TODAY_DEEP, 0.9);
ctx.fillRect(x, HIST_BASE - h, w, h - okH);
}
});
ctx.fillStyle = rgba(INK, 0.6);
ctx.fillRect(PLOT_X, HIST_BASE, PLOT_R - PLOT_X, 1);
ctx.save();
ctx.setLineDash([4, 3]);
ctx.beginPath();
ctx.moveTo(PLOT_X, capY);
ctx.lineTo(PLOT_R, capY);
ctx.lineWidth = 1.6;
ctx.strokeStyle = rgba(PATH_DEEP, 1);
ctx.stroke();
ctx.restore();
label(CAP_FMT.replace('{n}', String(DAY_CAPACITY)), PLOT_X - 6, capY, PATH_DEEP, 1, 10, 800, 'right');
}
// 한 프레임에 넘기는 시간 상한(초) — 탭을 오래 숨겼다 돌아온 첫 프레임에도 50ms 까지만 계산에 넣는다
const DT_MAX = 0.05;
let paused = false;
const reduceQuery = window.matchMedia('(prefers-reduced-motion: reduce)');
// 페이지를 연 채 동작 줄이기 설정을 바꿔도 change 리스너가 이 값을 다시 읽는다
let still = reduceQuery.matches;
// 자동 시연 중인가 — 사람이 처음 손대면 시연 표시를 떼고 상태 줄을 polite 로 켠다
let demo = root.classList.contains('is-demo');
// 리스너는 한 묶음으로 달고 정리할 때 한 번에 뗀다
const off = new AbortController();
function wake() {
if (!demo) {
return;
}
demo = false;
root.classList.remove('is-demo');
if (statusEl) {
statusEl.setAttribute('aria-live', 'polite');
}
}
// 장면 시계를 dt 만큼 — 한 바퀴(LOOP_S)를 넘으면 처음 배치로 되돌려 다시 시연한다
function advance(dt) {
sceneT += dt;
if (sceneT >= LOOP_S) {
sceneT -= LOOP_S;
reset();
}
update(dt);
}
let rafId = 0;
let lastTs = -1;
function frame(ts) {
if (still || paused) {
rafId = 0;
return;
}
if (lastTs < 0) {
lastTs = ts;
}
const dt = Math.min((ts - lastTs) / 1000, DT_MAX);
lastTs = ts;
if (dt > 0) {
advance(dt);
}
draw();
pushStatus();
rafId = window.requestAnimationFrame(frame);
}
function startLoop() {
if (rafId) {
return;
}
// 시계 다시 맞추기 — 멈췄던 사이의 시간을 첫 프레임 dt 로 넘기지 않는다
lastTs = -1;
rafId = window.requestAnimationFrame(frame);
}
function stopLoop() {
if (rafId) {
window.cancelAnimationFrame(rafId);
rafId = 0;
}
}
// 동작 줄이기 — 루프를 돌리지 않고 시연이 끝난 최종 배치 한 장만 그린다
function showRest() {
stopLoop();
sceneT = 0;
reset();
restPose();
draw();
pushStatus();
}
function play() {
sceneT = 0;
reset();
draw();
pushStatus();
if (!paused) {
startLoop();
}
}
pauseBtn.addEventListener('click', function () {
paused = !paused;
pauseBtn.setAttribute('aria-pressed', paused ? 'true' : 'false');
wake();
if (paused) {
stopLoop();
}
else if (!still) {
startLoop();
}
}, { signal: off.signal });
// 탭이 숨으면 루프를 멈추고, 돌아오면 시계를 다시 맞춰 시작한다 — 숨은 동안의 몇 초가 한 프레임에 몰리지 않게
document.addEventListener('visibilitychange', function () {
if (document.hidden) {
stopLoop();
}
else if (!paused && !still) {
startLoop();
}
}, { signal: off.signal });
// 설정이 페이지를 연 채 바뀌면 — 켜지면 최종 배치로 멈추고, 꺼지면 시연을 처음부터
reduceQuery.addEventListener('change', function () {
still = reduceQuery.matches;
if (still) {
showRest();
}
else {
play();
}
}, { signal: off.signal });
window.addEventListener('resize', function () {
fitCanvas();
draw();
}, { signal: off.signal });
fitCanvas();
fillTable(TABLE_CAPTION, tableRows());
if (still) {
showRest();
}
else {
play();
}
return function () {
stopLoop();
off.abort();
};
})();// WorkloadLevelReflow - 같은 항목 vanilla 판 index.html 의 React 포트. 같은 계산을 useEffect 안에서 돌린다.
import { useEffect, useRef } from "react";
import styles from "./WorkloadLevelReflow.module.scss";
const cx = (s: string): string => s.split(" ").map((n) => styles[n] ?? n).join(" ");
export default function WorkloadLevelReflow() {
const rootRef = useRef<HTMLDivElement | null>(null);
useEffect(() => {
const rootEl = rootRef.current;
if (!rootEl) return;
const root: HTMLElement = rootEl;
type RGB = [number, number, number];
type Pt = [number, number];
// 판 좌표 — 캔버스 안은 늘 480×300. 화면에 보이는 크기와 상관없이 계산은 이 좌표로 한다
const W = 480;
const H = 300;
const TAU = Math.PI * 2;
function clamp(v: number, lo: number, hi: number): number { return v < lo ? lo : (v > hi ? hi : v); }
function lerp(a: number, b: number, k: number): number { return a + (b - a) * k; }
function smooth(x: number): number { const c = clamp(x, 0, 1); return c * c * (3 - 2 * c); }
// 따라가기 비율 — 1 − e^(−rate·dt). 프레임 시간이 달라도 1초에 같은 만큼 다가간다
function follow(rate: number, dt: number): number { return 1 - Math.exp(-rate * dt); }
// 시드 고정 난수 — 같은 시드면 같은 일정이 다시 나온다 (32비트 정수 섞기)
function makeRng(seed: number): () => number {
let s = seed >>> 0;
return function (): number {
s = (s + 0x6d2b79f5) >>> 0;
let t = s;
t = Math.imul(t ^ (t >>> 15), t | 1);
t ^= t + Math.imul(t ^ (t >>> 7), t | 61);
return ((t ^ (t >>> 14)) >>> 0) / 4294967296;
};
}
// ── 감쇠 스프링 ──────────────────────────────────────────────
// 가속 = 단단함 × (목표 − 위치) − 감쇠 × 속도. 속도를 먼저 고친 뒤 위치를 옮기는 적분을 1/240초 잔걸음으로 나눠 돌린다
type Spring = { x: number; v: number; to: number };
function makeSpring(x: number): Spring { return { x: x, v: 0, to: x }; }
const SPRING_SUBSTEP = 1 / 240;
function stepSpring(s: Spring, stiffness: number, damping: number, dt: number): void {
let left = dt;
while (left > 1e-9) {
const h = Math.min(SPRING_SUBSTEP, left);
s.v += (stiffness * (s.to - s.x) - damping * s.v) * h;
s.x += s.v * h;
left -= h;
}
}
function snapSpring(s: Spring, x: number): void { s.x = x; s.v = 0; s.to = x; }
// ── 날짜 = 정수 일수 ─────────────────────────────────────────
// 날짜 객체를 쓰지 않는다. 기준일을 0 으로 세는 정수 일수(day index)만 다루고, 화면의 월·일 숫자는 아래 월 길이 표로 산수해 만든다
const MONTH_DAYS = [31, 28, 31, 30, 31, 30, 31, 31, 30, 31, 30, 31];
const YEAR_DAYS = 365;
// 기준일(일수 0) = 한 해의 70번째 날 → 표로 세면 3월 11일
const DAY_ZERO_OF_YEAR = 69;
function calendarOf(day: number): [number, number] {
let r = ((day + DAY_ZERO_OF_YEAR) % YEAR_DAYS + YEAR_DAYS) % YEAR_DAYS;
let m = 0;
while (r >= MONTH_DAYS[m]) { r -= MONTH_DAYS[m]; m += 1; }
return [m + 1, r + 1];
}
const DAY_FMT = '{n}일차';
const WEEK_FMT = '{n}주차';
const MONTH_FMT = '{n}월';
const SLACK_FMT = '{n}일';
function dayText(day: number): string { return DAY_FMT.replace('{n}', String(day + 1)); }
// 하루 차 계산의 함정 — 시각(시간 단위)끼리 빼서 24 로 나누면, 시계가 한 시간 당겨진 날이 끼었을 때 정수가 아니다(23시간짜리 하루).
// 그래서 바깥에서 들어온 시각은 반올림으로 정수 일수에 붙이고, 그다음부터는 정수끼리만 더하고 뺀다
const HOURS_PER_DAY = 24;
const CLOCK_SHIFT_HOURS = 1;
function hoursToDayIndex(hours: number): number { return Math.round(hours / HOURS_PER_DAY); }
// ── 작업과 의존 ──────────────────────────────────────────────
// dur 는 일수(0 이면 마일스톤), deps 는 끝나야 시작할 수 있는 앞 작업 번호, load 는 그 작업에 붙는 사람 수
type Task = { name: string; dur: number; deps: number[]; load: number };
const BASE_TASKS: Task[] = [
{ name: '요구 정리', dur: 3, deps: [], load: 2 },
{ name: '디자인 시안', dur: 4, deps: [0], load: 1 },
{ name: '데이터 설계', dur: 3, deps: [0], load: 1 },
{ name: '화면 개발', dur: 5, deps: [1], load: 2 },
{ name: '서버 개발', dur: 7, deps: [2], load: 1 },
{ name: '기능 연동', dur: 3, deps: [3, 4], load: 2 },
{ name: '문서 작성', dur: 3, deps: [1], load: 1 },
{ name: '통합 검수', dur: 3, deps: [5], load: 2 },
{ name: '오류 수정', dur: 2, deps: [7], load: 1 },
{ name: '출시', dur: 0, deps: [8, 6], load: 0 }
];
function copyTasks(ts: Task[]): Task[] { return ts.map(function (t: Task): Task { return { name: t.name, dur: t.dur, deps: t.deps.slice(), load: t.load }; }); }
function successorsOf(tasks: Task[]): number[][] {
const out: number[][] = tasks.map(function (): number[] { return []; });
tasks.forEach(function (t: Task, i: number): void { t.deps.forEach(function (p: number): void { out[p].push(i); }); });
return out;
}
// 선후 순서로 줄 세우기 — 앞 작업이 하나도 안 남은(들어오는 화살표 0) 작업부터 꺼내고, 꺼낼 때마다 뒤 작업의 남은 수를 하나 줄인다.
// 꺼낼 것이 사라졌는데 남은 작업이 있으면 그 작업들은 서로를 기다리는 고리(순환 의존)에 걸렸거나 그 뒤에 매달린 것이다 → stuck
type Order = { order: number[]; stuck: number[] };
function sortByDeps(tasks: Task[]): Order {
const succ = successorsOf(tasks);
const waiting = tasks.map(function (t: Task): number { return t.deps.length; });
const ready: number[] = [];
waiting.forEach(function (w: number, i: number): void { if (w === 0) { ready.push(i); } });
const order: number[] = [];
while (ready.length) {
ready.sort(function (a: number, b: number): number { return a - b; });
const i = ready.shift() as number;
order.push(i);
succ[i].forEach(function (j: number): void { waiting[j] -= 1; if (waiting[j] === 0) { ready.push(j); } });
}
const stuck: number[] = [];
waiting.forEach(function (w: number, i: number): void { if (w > 0) { stuck.push(i); } });
return { order: order, stuck: stuck };
}
// 앞뒤 두 번 훑기 — 앞에서: 가장 이른 시작 = 앞 작업 끝 중 가장 늦은 날(과 정해 둔 시작일 중 늦은 쪽).
// 뒤에서: 가장 늦은 끝 = 뒤 작업의 가장 늦은 시작 중 가장 이른 날(뒤 작업이 없으면 전체 끝). 여유 = 가장 늦은 시작 − 가장 이른 시작
type Layers = { day: number; week: number; month: number };
type Sweep = { es: number[]; ef: number[]; ls: number[]; lf: number[]; slack: number[]; end: number };
function sweepBoth(tasks: Task[], order: number[], minStart: number[] | null): Sweep {
const n = tasks.length;
const es: number[] = new Array(n).fill(0);
const ef: number[] = new Array(n).fill(0);
for (const i of order) {
let s = minStart ? minStart[i] : 0;
for (const p of tasks[i].deps) { s = Math.max(s, ef[p]); }
es[i] = s;
ef[i] = s + tasks[i].dur;
}
let end = 0;
for (const i of order) { end = Math.max(end, ef[i]); }
const succ = successorsOf(tasks);
const ls: number[] = new Array(n).fill(0);
const lf: number[] = new Array(n).fill(0);
for (let k = order.length - 1; k >= 0; k -= 1) {
const i = order[k];
let f = end;
for (const j of succ[i]) { f = Math.min(f, ls[j]); }
lf[i] = f;
ls[i] = f - tasks[i].dur;
}
const slack = es.map(function (s: number, i: number): number { return ls[i] - s; });
return { es: es, ef: ef, ls: ls, lf: lf, slack: slack, end: end };
}
// 밀기 전파 — 밀린 작업에서 가까운 뒤 작업부터 너비 우선으로 훑으며, 새 시작 = 앞 작업 끝 중 가장 늦은 날(지금보다 늦을 때만).
// depth 는 밀린 작업에서 몇 단계 뒤인지(-1 이면 여유가 흡수해 안 밀림). 시작이 바뀐 작업만 다시 큐에 넣는다
type Push = { starts: number[]; depth: number[] };
function pushFrom(tasks: Task[], starts: number[], from: number): Push {
const succ = successorsOf(tasks);
const out = starts.slice();
const depth: number[] = tasks.map(function (): number { return -1; });
depth[from] = 0;
const queue: number[] = [from];
let head = 0;
// 고리가 있어도 끝나도록 꺼내는 횟수에 상한을 둔다
const limit = tasks.length * tasks.length + 1;
while (head < queue.length && head < limit) {
const i = queue[head];
head += 1;
for (const j of succ[i]) {
let need = 0;
for (const p of tasks[j].deps) { need = Math.max(need, out[p] + tasks[p].dur); }
if (need > out[j]) {
out[j] = need;
depth[j] = Math.max(depth[j], depth[i] + 1);
queue.push(j);
}
}
}
return { starts: out, depth: depth };
}
// 날마다 걸린 일감 — 작업이 덮는 날(시작 ≤ 날 < 시작 + 일수)마다 사람 수를 더한다
function dailyLoad(tasks: Task[], starts: number[], days: number): number[] {
const load: number[] = new Array(days).fill(0);
tasks.forEach(function (t: Task, i: number): void {
for (let d = starts[i]; d < starts[i] + t.dur; d += 1) { if (d >= 0 && d < days) { load[d] += t.load; } }
});
return load;
}
// ── 직각 경로 ───────────────────────────────────────────────
// 앞 끝(ex, ey)에서 오른쪽으로 ROUTE_STUB 나간 뒤 아래로 꺾는다. 뒤 시작(sx)이 그 꺾인 자리 + ROUTE_STUB 보다 오른쪽이면 곧장 내려가 오른쪽으로 들어가고,
// 아니면 앞 행 바로 아래 통로(gapY)까지 내려가 왼쪽으로 돌아간 다음 뒤 시작보다 ROUTE_STUB 앞에서 내려가 오른쪽으로 들어간다
const ROUTE_STUB = 7;
function elbowRoute(ex: number, ey: number, sx: number, sy: number, gapY: number): number[] {
const x1 = ex + ROUTE_STUB;
if (sx - ROUTE_STUB >= x1) { return [ex, ey, x1, ey, x1, sy, sx, sy]; }
const x2 = sx - ROUTE_STUB;
return [ex, ey, x1, ey, x1, gapY, x2, gapY, x2, sy, sx, sy];
}
function routeLength(pts: number[]): number {
let s = 0;
for (let i = 2; i < pts.length; i += 2) { s += Math.hypot(pts[i] - pts[i - 2], pts[i + 1] - pts[i - 1]); }
return s;
}
// 경로 위 거리 dist 자리의 점과 그 마디의 방향
function pointOnRoute(pts: number[], dist: number): [number, number, number, number] {
let left = Math.max(0, dist);
for (let i = 2; i < pts.length; i += 2) {
const dx = pts[i] - pts[i - 2];
const dy = pts[i + 1] - pts[i - 1];
const len = Math.hypot(dx, dy);
if (left <= len || i === pts.length - 2) {
const k = len > 0 ? Math.min(1, left / len) : 0;
return [pts[i - 2] + dx * k, pts[i - 1] + dy * k, len > 0 ? dx / len : 1, len > 0 ? dy / len : 0];
}
left -= len;
}
return [pts[0], pts[1], 1, 0];
}
// 경로를 앞에서부터 dist 만큼만 자른 점 목록 — 화살표가 그려져 나가는 장면에 쓴다
function cutRoute(pts: number[], dist: number): number[] {
const out: number[] = [pts[0], pts[1]];
let left = Math.max(0, dist);
for (let i = 2; i < pts.length; i += 2) {
const len = Math.hypot(pts[i] - pts[i - 2], pts[i + 1] - pts[i - 1]);
if (left >= len) { out.push(pts[i], pts[i + 1]); left -= len; continue; }
const k = len > 0 ? left / len : 0;
out.push(lerp(pts[i - 2], pts[i], k), lerp(pts[i - 1], pts[i + 1], k));
break;
}
return out;
}
// 장면 시계(초)와 상태 줄 글자 — 장면 계산이 고치고, 화면 쪽이 읽어 그린다
let sceneT = 0;
let simStatus = '';
// 파스텔 팔레트 — 크림 바탕 위 라벤더·민트·버터·산호 막대. 가장 긴 경로·오늘 선·글자는 진한 쪽으로 명도 차를 둔다
const PAPER: RGB = [251, 247, 238];
const PAPER_DIM: RGB = [243, 237, 224];
const GRID: RGB = [226, 218, 204];
const INK: RGB = [44, 38, 58];
const INK_SOFT: RGB = [112, 104, 126];
const CREAM: RGB = [255, 251, 242];
const LAVENDER: RGB = [190, 174, 236];
const MINT: RGB = [158, 214, 190];
const BUTTER: RGB = [244, 222, 146];
const CORAL: RGB = [244, 170, 150];
const SKY: RGB = [160, 204, 236];
const PINK: RGB = [242, 182, 206];
const PATH_DEEP: RGB = [86, 56, 168];
const TODAY_DEEP: RGB = [190, 72, 60];
const BAR_COLORS: RGB[] = [LAVENDER, MINT, BUTTER, CORAL, SKY, PINK];
function rgba(c: RGB, a: number): string {
return 'rgba(' + Math.round(clamp(c[0], 0, 255)) + ',' + Math.round(clamp(c[1], 0, 255)) + ',' + Math.round(clamp(c[2], 0, 255)) + ',' + clamp(a, 0, 1).toFixed(3) + ')';
}
function mix(a: RGB, b: RGB, k: number): RGB { return [lerp(a[0], b[0], k), lerp(a[1], b[1], k), lerp(a[2], b[2], k)]; }
// 표 한 줄 — 작업·시작·끝·여유. 끝은 그 작업이 덮는 마지막 날(일수 0 짜리는 시작과 같은 날)
function tableRow(name: string, start: number, dur: number, slack: number): string[] {
return [name, dayText(start), dayText(start + Math.max(0, dur - 1)), SLACK_FMT.replace('{n}', String(slack))];
}
const canvasEl = root.querySelector('[data-role="canvas"]') as HTMLCanvasElement | null;
const pauseEl = root.querySelector('[data-role="pause"]') as HTMLButtonElement | null;
const tableEl = root.querySelector('[data-role="table"]') as HTMLTableElement | null;
const statusEl = root.querySelector('[data-role="status"]') as HTMLElement | null;
const ctxRaw = canvasEl ? canvasEl.getContext('2d') : null;
if (!canvasEl || !ctxRaw || !pauseEl) { return; }
const cv: HTMLCanvasElement = canvasEl;
const ctx: CanvasRenderingContext2D = ctxRaw;
const pauseBtn: HTMLButtonElement = pauseEl;
const FONT_STACK = 'system-ui, -apple-system, "Segoe UI", "Noto Sans KR", sans-serif';
function fitCanvas(): void {
// 배율은 2 에서 자른다 — 배율 3 기기에서 화소가 2.25배로 늘어 프레임마다 일이 그만큼 커지지 않게
const dpr = Math.min(window.devicePixelRatio || 1, 2);
cv.width = Math.round(W * dpr);
cv.height = Math.round(H * dpr);
ctx.setTransform(dpr, 0, 0, dpr, 0, 0);
}
function clearStage(): void {
ctx.fillStyle = rgba(PAPER, 1);
ctx.fillRect(0, 0, W, H);
}
function label(s: string, x: number, y: number, c: RGB, a: number, px: number, weight: number, align: CanvasTextAlign): void {
ctx.font = weight + ' ' + px + 'px ' + FONT_STACK;
ctx.textAlign = align;
ctx.textBaseline = 'middle';
ctx.fillStyle = rgba(c, a);
ctx.fillText(s, x, y);
}
function roundRectPath(x: number, y: number, w: number, h: number, r: number): void {
const rr = Math.max(0, Math.min(r, w / 2, h / 2));
ctx.beginPath();
ctx.moveTo(x + rr, y);
ctx.lineTo(x + w - rr, y);
ctx.arcTo(x + w, y, x + w, y + rr, rr);
ctx.lineTo(x + w, y + h - rr);
ctx.arcTo(x + w, y + h, x + w - rr, y + h, rr);
ctx.lineTo(x + rr, y + h);
ctx.arcTo(x, y + h, x, y + h - rr, rr);
ctx.lineTo(x, y + rr);
ctx.arcTo(x, y, x + rr, y, rr);
ctx.closePath();
}
// 막대 하나 — 둥근 사각형 채움 + 진한 테두리. 폭이 0 이하이면 그리지 않는다
function bar(x: number, y: number, w: number, h: number, fill: RGB, a: number, line: number): void {
if (w <= 0.2 || a <= 0) { return; }
roundRectPath(x, y, w, h, 4);
ctx.fillStyle = rgba(fill, a);
ctx.fill();
if (line > 0) {
ctx.lineWidth = line;
ctx.strokeStyle = rgba(INK, 0.55 * a);
ctx.stroke();
}
}
// 마일스톤 마름모
function diamond(cx: number, cy: number, r: number, fill: RGB, a: number): void {
if (r <= 0.2 || a <= 0) { return; }
ctx.beginPath();
ctx.moveTo(cx, cy - r);
ctx.lineTo(cx + r, cy);
ctx.lineTo(cx, cy + r);
ctx.lineTo(cx - r, cy);
ctx.closePath();
ctx.fillStyle = rgba(fill, a);
ctx.fill();
ctx.lineWidth = 1.5;
ctx.strokeStyle = rgba(INK, 0.8 * a);
ctx.stroke();
}
function polyline(pts: number[], c: RGB, a: number, width: number): void {
if (pts.length < 4) { return; }
ctx.beginPath();
ctx.moveTo(pts[0], pts[1]);
for (let i = 2; i < pts.length; i += 2) { ctx.lineTo(pts[i], pts[i + 1]); }
ctx.lineWidth = width;
ctx.lineJoin = 'round';
ctx.lineCap = 'round';
ctx.strokeStyle = rgba(c, a);
ctx.stroke();
}
function arrowHead(x: number, y: number, dx: number, dy: number, size: number, c: RGB, a: number): void {
ctx.beginPath();
ctx.moveTo(x, y);
ctx.lineTo(x - dx * size - dy * size * 0.6, y - dy * size + dx * size * 0.6);
ctx.lineTo(x - dx * size + dy * size * 0.6, y - dy * size - dx * size * 0.6);
ctx.closePath();
ctx.fillStyle = rgba(c, a);
ctx.fill();
}
// 빗금 — (x, y, w, h) 안에 45° 줄을 spacing 간격으로. 간격이 좁을수록 짙어 보인다
function hatch(x: number, y: number, w: number, h: number, spacing: number, c: RGB, a: number): void {
if (w <= 0.5 || a <= 0) { return; }
ctx.save();
roundRectPath(x, y, w, h, 3);
ctx.clip();
ctx.beginPath();
for (let s = x - h; s < x + w; s += Math.max(2, spacing)) {
ctx.moveTo(s, y + h);
ctx.lineTo(s + h, y);
}
ctx.lineWidth = 1.6;
ctx.strokeStyle = rgba(c, a);
ctx.stroke();
ctx.restore();
}
// 시간 축 — 위 띠는 월 이름, 아래 띠는 일(월 안의 날 숫자)·주(주차) 층. 층마다 불투명도를 따로 받아 겹쳐 흐려지며 바뀌게 한다.
// 세로 격자도 같은 불투명도로 행 영역(top~bottom)에 긋는다. xOf 는 일수 → 화면 x
function timeAxis(xOf: (d: number) => number, dayW: number, d0: number, d1: number, left: number, right: number, top: number, bottom: number, ly: Layers): void {
ctx.save();
ctx.beginPath();
ctx.rect(left, 0, right - left, H);
ctx.clip();
ctx.fillStyle = rgba(PAPER_DIM, 1);
ctx.fillRect(left, 0, right - left, top - 4);
for (let d = Math.floor(d0); d <= Math.ceil(d1); d += 1) {
const x = xOf(d);
const cal = calendarOf(d);
if (ly.day > 0.01) {
ctx.fillStyle = rgba(GRID, 0.7 * ly.day);
ctx.fillRect(x, top, 1, bottom - top);
if (dayW >= 13) { label(String(cal[1]), x + dayW / 2, top - 11, INK_SOFT, ly.day, 9, 600, 'center'); }
}
// 주 층 — 글자가 겹치지 않을 만큼(36px) 주를 건너뛰며 적는다
const weekStep = 7 * dayW >= 36 ? 1 : (14 * dayW >= 36 ? 2 : 4);
if (ly.week > 0.01 && d % 7 === 0) {
ctx.fillStyle = rgba(GRID, ly.week);
ctx.fillRect(x, top, 1, bottom - top);
if ((d / 7) % weekStep === 0) { label(WEEK_FMT.replace('{n}', String(d / 7 + 1)), x + 3, top - 11, INK_SOFT, ly.week, 9, 600, 'left'); }
}
if (cal[1] === 1) {
ctx.fillStyle = rgba(INK_SOFT, 0.18 + 0.4 * ly.month);
ctx.fillRect(x, 4, 1, bottom - 4);
label(MONTH_FMT.replace('{n}', String(cal[0])), x + 4, 11, INK, 0.85, 10, 700, 'left');
// 월 층 — 그달 칸 가운데에 그달 일수(월 길이 표에서)를 적는다
const len = MONTH_DAYS[cal[0] - 1];
if (ly.month > 0.01 && len * dayW >= 30) { label(SLACK_FMT.replace('{n}', String(len)), x + len * dayW / 2, top - 11, INK_SOFT, ly.month, 9, 700, 'center'); }
} else if (d === Math.floor(d0)) {
// 왼쪽 끝 월 이름 — 바로 오른쪽에 새 달이 시작하면 겹치므로 적지 않는다
const toNext = MONTH_DAYS[cal[0] - 1] - cal[1] + 1;
if (toNext * dayW >= 44) { label(MONTH_FMT.replace('{n}', String(cal[0])), Math.max(x, left) + 4, 11, INK, 0.85, 10, 700, 'left'); }
}
}
ctx.restore();
}
// 왼쪽 작업 이름 칸
function rowLabel(name: string, y: number, a: number, bold: boolean): void {
label(name, 10, y, INK, a, 11, bold ? 800 : 600, 'left');
}
function rowStripe(y: number, h: number, i: number, a: number): void {
if (i % 2 === 1) {
ctx.fillStyle = rgba(PAPER_DIM, 0.75 * a);
ctx.fillRect(0, y, W, h);
}
}
// 움직이는 행 빛 — 그 행 막대의 스프링 속도(k = 0~1)만큼 행 전체가 옅은 라벤더로 밝아진다. 막대가 서면 사라진다
function rowGlow(y: number, h: number, k: number): void {
if (k <= 0.01) { return; }
ctx.fillStyle = rgba(LAVENDER, 0.42 * clamp(k, 0, 1));
ctx.fillRect(0, y, W, h);
}
// 상태 줄 — 바뀔 때만 글자를 고친다
let shownStatus = '';
function pushStatus(): void {
if (!statusEl || simStatus === shownStatus) { return; }
shownStatus = simStatus;
statusEl.textContent = simStatus;
}
// 숨김 표 — 같은 일정을 작업·시작·끝·여유 열로 읽게. 화면에는 안 보이고 화면 읽기 도구가 읽는다
const TABLE_HEAD = ['작업 이름', '시작일', '끝나는 날', '여유 일수'];
function fillTable(caption: string, rows: string[][]): void {
if (!tableEl) { return; }
const tb = tableEl;
while (tb.firstChild) { tb.removeChild(tb.firstChild); }
const cap = document.createElement('caption');
cap.textContent = caption;
tb.appendChild(cap);
const thead = document.createElement('thead');
const hr = document.createElement('tr');
TABLE_HEAD.forEach(function (h: string): void {
const th = document.createElement('th');
th.scope = 'col';
th.textContent = h;
hr.appendChild(th);
});
thead.appendChild(hr);
tb.appendChild(thead);
const body = document.createElement('tbody');
rows.forEach(function (r: string[]): void {
const tr = document.createElement('tr');
r.forEach(function (c: string, k: number): void {
const cell = document.createElement(k === 0 ? 'th' : 'td');
if (k === 0) { (cell as HTMLTableCellElement).scope = 'row'; }
cell.textContent = c;
tr.appendChild(cell);
});
body.appendChild(tr);
});
tb.appendChild(body);
}
// 07 — 인력 부하 평준화. 날마다 걸린 사람 수를 더해 DAY_CAPACITY 를 넘는 첫날을 찾고, 그날 걸린 작업 중 여유가 가장 큰 것을 하루 늦춘다(뒤 작업은 pushFrom 으로 따라 밀림). 넘침이 0 이 되거나 LEVEL_MAX_STEPS 에 닿을 때까지 되풀이
const LABEL_W = 96;
const PLOT_X = LABEL_W + 6;
const PLOT_R = W - 8;
const ROWS_TOP = 40;
const ROW_H = 15;
const BAR_H = 10;
const HIST_BASE = 248;
const HIST_UNIT = 7;
const DAY_CAPACITY = 3;
const LEVEL_MAX_STEPS = 40;
const LEVEL_START_S = 0.3;
const LEVEL_STEP_MS = 150;
// 막대 이동·그래프 높이 스프링
const LEVEL_STIFFNESS = 260;
const LEVEL_DAMPING = 20;
const TABLE_CAPTION = '작업 일정표 — 하루 정원에 맞춘 뒤';
const STATUS_LEVEL = '넘친 날 {n}일 · {m}번 늦춤';
const STATUS_DONE = '넘친 날 0일 · {m}번 늦춤 · 전체 {a} → {b}';
const tasks07 = BASE_TASKS;
const order07 = sortByDeps(tasks07).order;
const first07 = sweepBoth(tasks07, order07, null);
type LevelStep = { starts: number[]; moved: number; day: number; over: number };
function overflowDays(load: number[], cap: number): number { return load.filter(function (v: number): boolean { return v > cap; }).length; }
function levelSteps(tasks: Task[], startsIn: number[], cap: number, maxSteps: number): LevelStep[] {
const steps: LevelStep[] = [];
let starts = startsIn.slice();
const order = sortByDeps(tasks).order;
for (let s = 0; s < maxSteps; s += 1) {
const span = Math.max.apply(null, starts.map(function (v: number, i: number): number { return v + tasks[i].dur; })) + 1;
const load = dailyLoad(tasks, starts, span);
const day = load.findIndex(function (v: number): boolean { return v > cap; });
if (day < 0) { break; }
// 지금 배치 기준의 여유 — 정해 둔 시작일을 지키며 앞뒤로 훑는다
const sw = sweepBoth(tasks, order, starts);
let pick = -1;
// 후보는 그날 「시작하는」 작업만 — 이미 시작한 작업은 건드리지 않는다. 첫 넘침 날은 전날보다 일감이 늘어난 날이라 그날 시작하는 작업이 늘 하나 이상 있고,
// 시작한 작업까지 후보로 두면 겹친 작업들이 여유를 주고받으며 번갈아 하루씩 밀려 끝없이 뛰어넘는다(정원 2 에서 40번을 다 쓰고도 넘침 5일)
tasks.forEach(function (t: Task, i: number): void {
if (t.load === 0 || starts[i] !== day) { return; }
if (pick < 0 || sw.slack[i] > sw.slack[pick] || (sw.slack[i] === sw.slack[pick] && i > pick)) { pick = i; }
});
if (pick < 0) { break; }
const nudged = starts.slice();
nudged[pick] += 1;
starts = pushFrom(tasks, nudged, pick).starts;
const after = dailyLoad(tasks, starts, span + 1);
steps.push({ starts: starts.slice(), moved: pick, day: day, over: overflowDays(after, cap) });
}
return steps;
}
const steps07 = levelSteps(tasks07, first07.es, DAY_CAPACITY, LEVEL_MAX_STEPS);
const final07 = steps07.length ? steps07[steps07.length - 1].starts : first07.es;
const endBefore07 = first07.end;
const endAfter07 = Math.max.apply(null, final07.map(function (v: number, i: number): number { return v + tasks07[i].dur; }));
const SPAN07 = endAfter07 + 1;
const DAY_WIDTH = Math.min(16, (PLOT_R - PLOT_X) / SPAN07);
const LOOP_S = LEVEL_START_S + steps07.length * LEVEL_STEP_MS / 1000 + 3.2;
const startS07: Spring[] = tasks07.map(function (_: Task, i: number): Spring { return makeSpring(first07.es[i]); });
const histS07: Spring[] = new Array(SPAN07).fill(0).map(function (): Spring { return makeSpring(0); });
let stepNow07 = 0;
let flash07 = -1;
let flashT07 = 0;
function startsAt(k: number): number[] { return k <= 0 ? first07.es : steps07[k - 1].starts; }
function setHistTargets(starts: number[], snap: boolean): void {
const load = dailyLoad(tasks07, starts, SPAN07);
histS07.forEach(function (s: Spring, d: number): void { if (snap) { snapSpring(s, load[d]); } else { s.to = load[d]; } });
}
function reset(): void {
stepNow07 = 0;
flash07 = -1;
tasks07.forEach(function (_: Task, i: number): void { snapSpring(startS07[i], first07.es[i]); });
setHistTargets(first07.es, true);
}
function statusFor(k: number): string {
const load = dailyLoad(tasks07, startsAt(k), SPAN07);
const over = overflowDays(load, DAY_CAPACITY);
if (over === 0) { return STATUS_DONE.replace('{m}', String(k)).replace('{a}', SLACK_FMT.replace('{n}', String(endBefore07))).replace('{b}', SLACK_FMT.replace('{n}', String(endAfter07))); }
return STATUS_LEVEL.replace('{n}', String(over)).replace('{m}', String(k));
}
function update(dt: number): void {
const k = clamp(Math.floor((sceneT - LEVEL_START_S) / (LEVEL_STEP_MS / 1000)) + 1, 0, steps07.length);
if (k !== stepNow07) {
stepNow07 = k;
if (k > 0) { flash07 = steps07[k - 1].moved; flashT07 = 0; }
const st = startsAt(k);
tasks07.forEach(function (_: Task, i: number): void { startS07[i].to = st[i]; });
setHistTargets(st, false);
}
flashT07 += dt;
startS07.forEach(function (s: Spring): void { stepSpring(s, LEVEL_STIFFNESS, LEVEL_DAMPING, dt); });
histS07.forEach(function (s: Spring): void { stepSpring(s, LEVEL_STIFFNESS, LEVEL_DAMPING, dt); });
simStatus = statusFor(stepNow07);
}
function restPose(): void {
stepNow07 = steps07.length;
flash07 = -1;
tasks07.forEach(function (_: Task, i: number): void { snapSpring(startS07[i], final07[i]); });
setHistTargets(final07, true);
simStatus = statusFor(stepNow07);
}
function tableRows(): string[][] {
const sw = sweepBoth(tasks07, order07, final07);
return tasks07.map(function (t: Task, i: number): string[] { return tableRow(t.name, final07[i], t.dur, sw.slack[i]); });
}
const CAP_FMT = '정원 {n}명';
function dayX(d: number): number { return PLOT_X + d * DAY_WIDTH; }
function rowMid(i: number): number { return ROWS_TOP + i * ROW_H + ROW_H / 2; }
function draw(): void {
clearStage();
const bottom = ROWS_TOP + tasks07.length * ROW_H;
tasks07.forEach(function (_: Task, i: number): void { rowStripe(ROWS_TOP + i * ROW_H, ROW_H, i, 1); rowGlow(ROWS_TOP + i * ROW_H, ROW_H, Math.abs(startS07[i].v) / 8); });
// 지금 살피는 날 — 다음 걸음이 고칠 「넘치는 첫날」 칸을 행부터 그래프까지 세로 띠로
if (stepNow07 < steps07.length && sceneT >= LEVEL_START_S - 0.1) {
const sd = steps07[stepNow07].day;
ctx.fillStyle = rgba(TODAY_DEEP, 0.13);
ctx.fillRect(dayX(sd), ROWS_TOP, DAY_WIDTH, HIST_BASE - ROWS_TOP);
}
timeAxis(dayX, DAY_WIDTH, 0, SPAN07 + 1, PLOT_X, PLOT_R, ROWS_TOP, HIST_BASE, { day: 1, week: 0, month: 0 });
const fl = flash07 >= 0 ? Math.exp(-flashT07 * 5) : 0;
tasks07.forEach(function (t: Task, i: number): void {
const cy = rowMid(i);
rowLabel(t.name, cy, 1, i === flash07 && fl > 0.2);
const x0 = dayX(startS07[i].x);
if (t.dur === 0) {
diamond(x0, cy, 6, PATH_DEEP, 1);
return;
}
bar(x0, cy - BAR_H / 2, t.dur * DAY_WIDTH, BAR_H, BAR_COLORS[i % BAR_COLORS.length], 1, 1.2);
// 사람 수 점 — 막대 안에 한 사람당 점 하나
for (let p = 0; p < t.load; p += 1) {
ctx.beginPath();
ctx.arc(x0 + 6 + p * 6, cy, 1.8, 0, TAU);
ctx.fillStyle = rgba(INK, 0.75);
ctx.fill();
}
if (i === flash07 && fl > 0.01) {
roundRectPath(x0 - 2, cy - BAR_H / 2 - 2, t.dur * DAY_WIDTH + 4, BAR_H + 4, 5);
ctx.lineWidth = 2.2;
ctx.strokeStyle = rgba(PATH_DEEP, fl);
ctx.stroke();
}
});
// 날마다 일감 막대 — 정원을 넘는 몫은 진한 색으로
const capY = HIST_BASE - DAY_CAPACITY * HIST_UNIT;
ctx.fillStyle = rgba(PAPER_DIM, 1);
ctx.fillRect(PLOT_X, bottom + 4, PLOT_R - PLOT_X, HIST_BASE - bottom - 4);
histS07.forEach(function (s: Spring, d: number): void {
const v = Math.max(0, s.x);
if (v < 0.02) { return; }
const x = dayX(d) + 1;
const w = DAY_WIDTH - 2;
const h = v * HIST_UNIT;
const okH = Math.min(h, DAY_CAPACITY * HIST_UNIT);
ctx.fillStyle = rgba(MINT, 1);
ctx.fillRect(x, HIST_BASE - okH, w, okH);
if (h > okH) {
ctx.fillStyle = rgba(TODAY_DEEP, 0.9);
ctx.fillRect(x, HIST_BASE - h, w, h - okH);
}
});
ctx.fillStyle = rgba(INK, 0.6);
ctx.fillRect(PLOT_X, HIST_BASE, PLOT_R - PLOT_X, 1);
ctx.save();
ctx.setLineDash([4, 3]);
ctx.beginPath();
ctx.moveTo(PLOT_X, capY);
ctx.lineTo(PLOT_R, capY);
ctx.lineWidth = 1.6;
ctx.strokeStyle = rgba(PATH_DEEP, 1);
ctx.stroke();
ctx.restore();
label(CAP_FMT.replace('{n}', String(DAY_CAPACITY)), PLOT_X - 6, capY, PATH_DEEP, 1, 10, 800, 'right');
}
// 한 프레임에 넘기는 시간 상한(초) — 탭을 오래 숨겼다 돌아온 첫 프레임에도 50ms 까지만 계산에 넣는다
const DT_MAX = 0.05;
let paused = false;
const reduceQuery = window.matchMedia('(prefers-reduced-motion: reduce)');
// 페이지를 연 채 동작 줄이기 설정을 바꿔도 change 리스너가 이 값을 다시 읽는다
let still = reduceQuery.matches;
// 자동 시연 중인가 — 사람이 처음 손대면 시연 표시를 떼고 상태 줄을 polite 로 켠다
let demo = root.classList.contains('is-demo');
// 리스너는 한 묶음으로 달고 정리할 때 한 번에 뗀다
const off = new AbortController();
function wake(): void {
if (!demo) { return; }
demo = false;
root.classList.remove('is-demo');
if (statusEl) { statusEl.setAttribute('aria-live', 'polite'); }
}
// 장면 시계를 dt 만큼 — 한 바퀴(LOOP_S)를 넘으면 처음 배치로 되돌려 다시 시연한다
function advance(dt: number): void {
sceneT += dt;
if (sceneT >= LOOP_S) {
sceneT -= LOOP_S;
reset();
}
update(dt);
}
let rafId = 0;
let lastTs = -1;
function frame(ts: number): void {
if (still || paused) { rafId = 0; return; }
if (lastTs < 0) { lastTs = ts; }
const dt = Math.min((ts - lastTs) / 1000, DT_MAX);
lastTs = ts;
if (dt > 0) { advance(dt); }
draw();
pushStatus();
rafId = window.requestAnimationFrame(frame);
}
function startLoop(): void {
if (rafId) { return; }
// 시계 다시 맞추기 — 멈췄던 사이의 시간을 첫 프레임 dt 로 넘기지 않는다
lastTs = -1;
rafId = window.requestAnimationFrame(frame);
}
function stopLoop(): void {
if (rafId) { window.cancelAnimationFrame(rafId); rafId = 0; }
}
// 동작 줄이기 — 루프를 돌리지 않고 시연이 끝난 최종 배치 한 장만 그린다
function showRest(): void {
stopLoop();
sceneT = 0;
reset();
restPose();
draw();
pushStatus();
}
function play(): void {
sceneT = 0;
reset();
draw();
pushStatus();
if (!paused) { startLoop(); }
}
pauseBtn.addEventListener('click', function (): void {
paused = !paused;
pauseBtn.setAttribute('aria-pressed', paused ? 'true' : 'false');
wake();
if (paused) { stopLoop(); } else if (!still) { startLoop(); }
}, { signal: off.signal });
// 탭이 숨으면 루프를 멈추고, 돌아오면 시계를 다시 맞춰 시작한다 — 숨은 동안의 몇 초가 한 프레임에 몰리지 않게
document.addEventListener('visibilitychange', function (): void {
if (document.hidden) { stopLoop(); } else if (!paused && !still) { startLoop(); }
}, { signal: off.signal });
// 설정이 페이지를 연 채 바뀌면 — 켜지면 최종 배치로 멈추고, 꺼지면 시연을 처음부터
reduceQuery.addEventListener('change', function (): void {
still = reduceQuery.matches;
if (still) { showRest(); } else { play(); }
}, { signal: off.signal });
window.addEventListener('resize', function (): void {
fitCanvas();
draw();
}, { signal: off.signal });
fitCanvas();
fillTable(TABLE_CAPTION, tableRows());
if (still) { showRest(); } else { play(); }
return function (): void {
stopLoop();
off.abort();
};
}, []);
return (
<div className={cx("cf") + " is-demo"} ref={rootRef}>
<canvas className={cx("cf__canvas")} data-role="canvas" width={480} height={300} role="img" aria-label="아래 막대그래프에서 정원을 넘는 날을 찾아 여유가 큰 작업을 하루씩 늦추는 인력 부하 평준화."></canvas>
<table className={cx("cf__sr")} data-role="table"></table>
<p className={cx("cf__status")} data-role="status" aria-live="off">{'하루 정원 확인 중'}</p>
<button className={cx("cf__pause")} data-role="pause" type="button" aria-pressed="false">{'일시정지'}</button>
</div>
);
}07 Workload Leveling That Trims Days Over the Daily Capacity — Measured area 10.849% · moving frames 11/23Original by GODRICH · SCSS and React ship in the zip · Gantt Chart JavaScript: 9 Self-Scheduling Views
The post this demo lives in
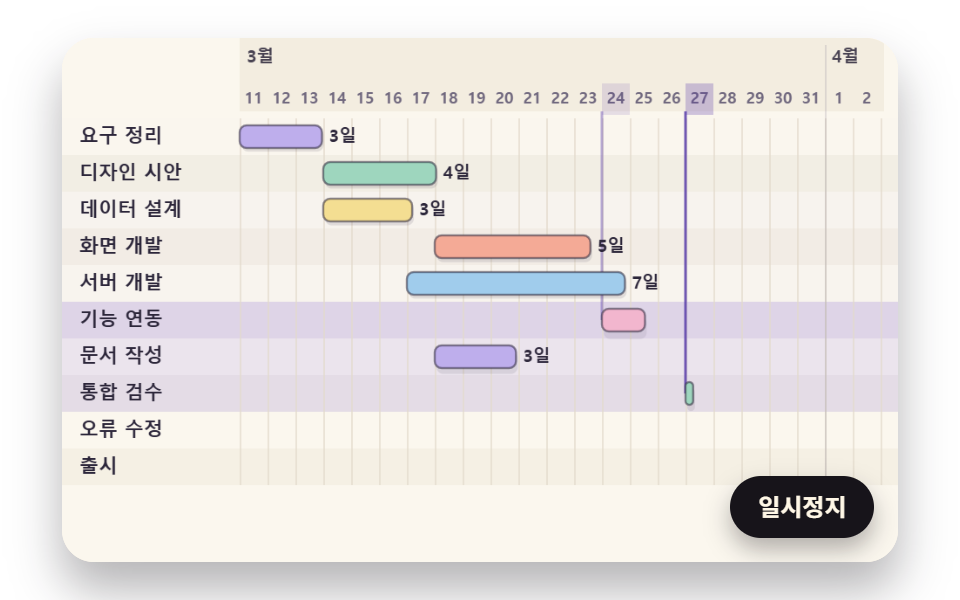 Gantt Chart JavaScript: 9 Self-Scheduling ViewsIn Gantt chart JavaScript, when a design draft slips three days, moving one bar makes the schedule lie. 04 pushes later See all demos in this post
If you like this effect - similar demos
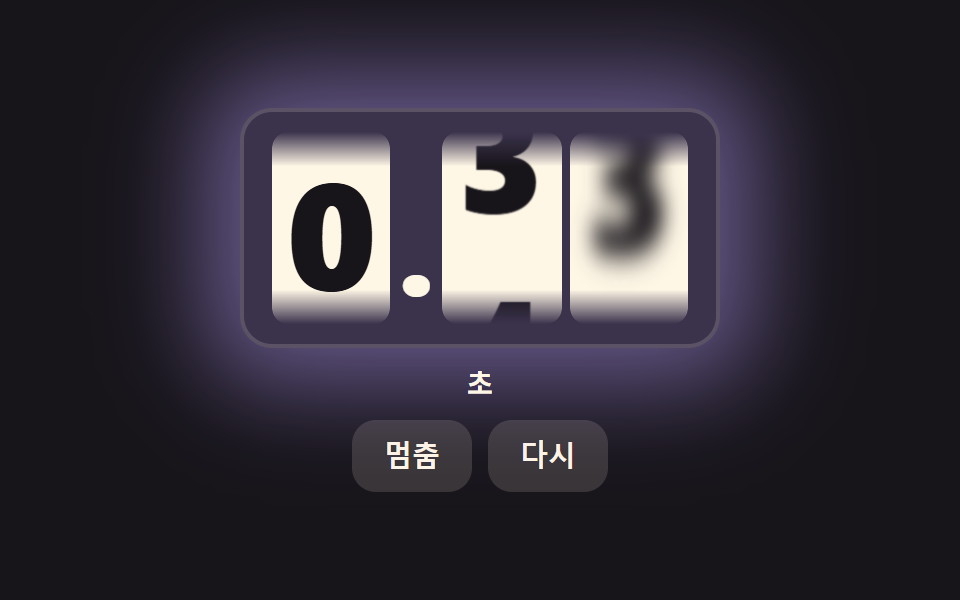 Dashboard UI06 Odometer Digits That Blur the Faster the Strip Spins and Carry Over in a ChainCSS Countdown Timer: 9 Clocks That Drain and Flip
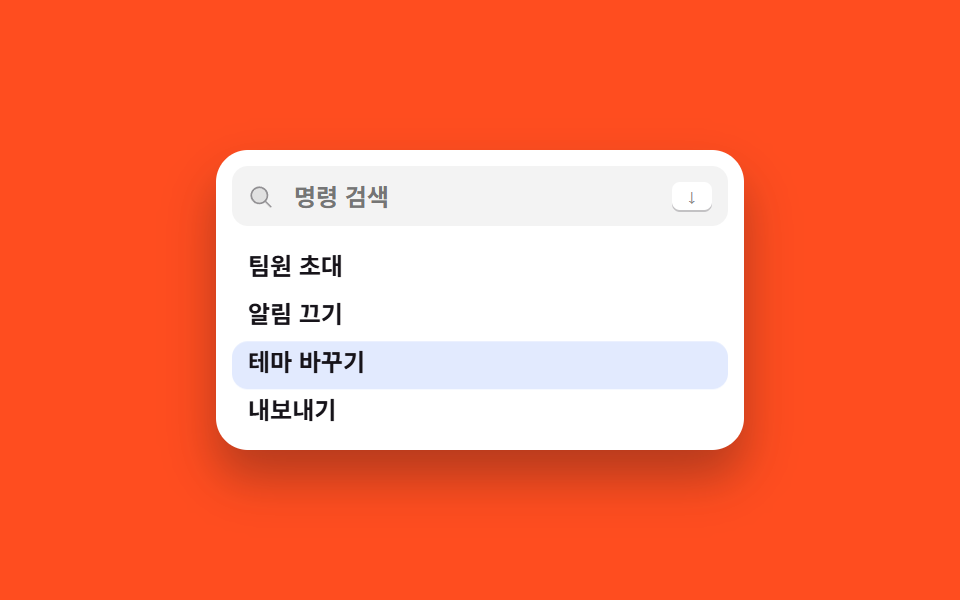 Dashboard UI03 Scroll that follows the cursorCommand Palette UI Design — 9 That Really Open
 Dashboard UI01 Crosshair that snaps to the nearest pointChart UI Design: 9 Interactions You Can Drag