04Radar chart unfolding from the center
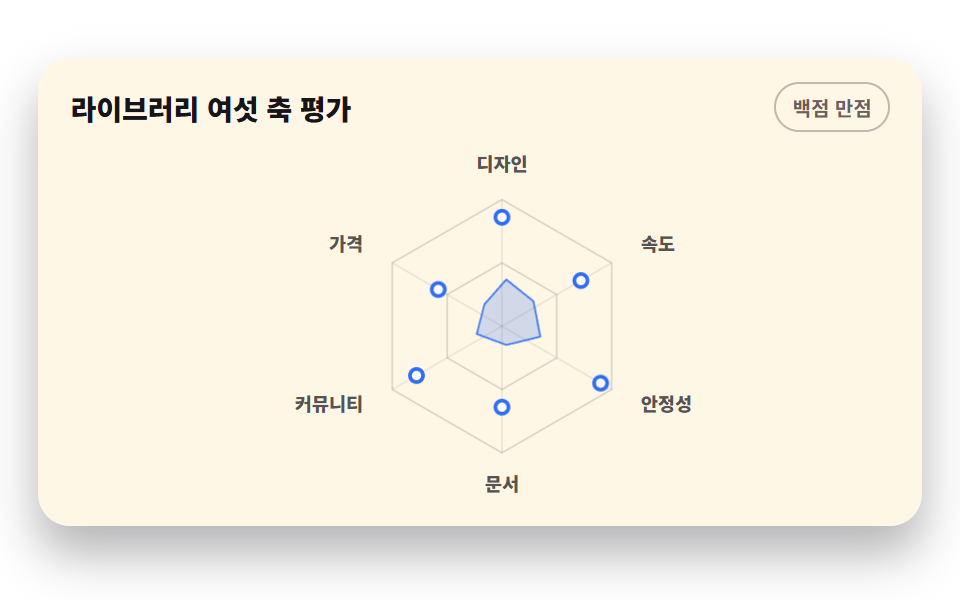
Six axis scores land on trigonometric coordinates, and the polygon scales up from the center
Best forSurvey comparisons, feature satisfaction cards
pointstransform-originscale
<main class="stage">
<div class="cr is-demo" id="cr">
  <div class="cr__card">
    <div class="cr__head">
      <p class="cr__title">Library evaluation on six axes</p>
      <span class="cr__chip">Out of 100</span>
    </div>
    <div class="cr__plot">
      <svg class="cr__svg" id="chart" viewBox="0 0 440 198" role="img" aria-label="Radar chart of six axis scores: stability is highest at 90 and price lowest at 58">
        <!-- 눈금 육각 격자 2겹(50%·100%) + 중심에서 뻗는 축선 6개 — JS 가 좌표를 조립한다 -->
        <g class="cr__grid" id="grid"></g>
        <!-- Axis 라벨 6개 — 꼭짓점보다 바깥 -->
        <g class="cr__labs" id="labs"></g>
        <!-- 주인공 폴리곤. points 는 JS 가 삼각함수로 채운다 -->
        <polygon class="cr__poly" id="poly" points=""></polygon>
        <!-- 꼭짓점  pts 6개 — 각 Axis 점수의 위치 -->
        <g class="cr__dots" id="dots"></g>
      </svg>
      <!-- 툴팁 — plot 안에서 절대 배치. 꼭짓점 위(위쪽 반은 아래로)에 뜬다 -->
      <div class="cr__tip" id="tip" aria-hidden="true"><span class="cr__tipName" id="tipName"></span><strong class="cr__tipVal" id="tipVal"></strong></div>
      <!-- 스크린리더용 데이터 표 — 화면에 안 보인다 -->
      <table class="cr__sr">
        <caption>Library evaluation on six axes</caption>
        <thead><tr><th>Axis</th><th>Score</th></tr></thead>
        <tbody id="srBody"></tbody>
      </table>
    </div>
  </div>
</div>
</main>@use "../../../../site/static/demo-tokens" as *;
// 중심에서 펼쳐지는 레이더 차트 — 실제 사용에선 JS 가 삼각함수로 polygon points 를 조립해 완성 형태가 곧 뜨고,
// pointermove 로 가까운 꼭짓점의 축 이름과 점수 툴팁이 따라온다. 격자 미리보기(.is-demo)는 같은 polygon 에
// scale 확대 키프레임을 얹어 중심에서 여섯 축이 펼쳐지는 모양을 2초 루프로 보여 준다.
$duration: $dur-loop;
$easing: $ease-spring;
$color: $chart-1;
@include stage($stage-paper);
.cr { display: flex; justify-content: center; width: 100%; padding-bottom: $sp-2; }
.cr__card {
width: min(100%, 420px); background: $subject-cream; border-radius: $r-card;
box-shadow: $shadow-raised; padding: $sp-3 $sp-4 $sp-2;
}
.cr__head { display: flex; align-items: center; justify-content: space-between; gap: $sp-2; margin-bottom: $sp-1; }
.cr__title { margin: 0; font-weight: 800; font-size: clamp(12px, 3vw, 14px); color: $subject-ink; }
.cr__chip {
font-weight: 700; font-size: clamp(9px, 2.4vw, 10px); color: rgba(23, 20, 26, .66);
border: 1px solid rgba(23, 20, 26, .28); border-radius: $r-pill; padding: $sp-1 $sp-2;
}
.cr__plot { position: relative; }
.cr__svg { display: block; width: 100%; height: auto; touch-action: none; cursor: crosshair; }
.cr__ring { fill: none; stroke: rgba(23, 20, 26, .14); stroke-width: 1; }
.cr__spoke { stroke: rgba(23, 20, 26, .08); stroke-width: 1; }
.cr__lab { fill: rgba(23, 20, 26, .72); font-weight: 800; font-size: 10px; dominant-baseline: middle; }
.cr__poly {
fill: rgba($color, .22); stroke: $color; stroke-width: 2.5; stroke-linejoin: round;
// SVG 요소의 CSS transform 기본 기준점은 viewBox 원점(0, 0)이라 '중심에서 확대'가 아니다 —
// fill-box(요소 자신의 칠 범위)와 center 원점을 명시해 폴리곤 한가운데서 커지게 한다
transform-box: fill-box; transform-origin: center;
}
.cr__dot {
fill: $stage-paper; stroke: $color; stroke-width: 2;
// 점도 같은 이유로 fill-box + center — 각자 자기 중심에서 팝한다
transform-box: fill-box; transform-origin: center;
}
// 툴팁 — 절대 배치라 루트에 padding-bottom 이 있어야 높이가 무대를 넘기지 않는다
.cr__tip {
position: absolute; transform: translate(-50%, -128%);
display: flex; align-items: baseline; gap: $sp-1; pointer-events: none;
background: $subject-ink; color: $stage-paper; border-radius: $r-xs;
padding: $sp-1 $sp-2; font-weight: 700; font-size: 10px; white-space: nowrap;
opacity: 0;
}
.cr__tip.is-below { transform: translate(-50%, 18%); }
.cr__tip.is-on { opacity: 1; transition: opacity $dur-quick $ease-out; }
.cr__tipName { opacity: .72; }
.cr__tipVal { font-size: 12px; }
// 스크린리더용 표 — fixed 로 캔버스 밖에 둔다. 스크린리더는 그대로 읽는다
.cr__sr {
position: fixed; top: 0; left: -640px; width: 320px; margin: 0;
}
// ── 미리보기 루프: 0~4% 빈 칸 → 6~34% 폴리곤이 중심에서 확대된다 → 36~62% 꼭짓점 점이 순서대로 팝 →
// 66% 에 최고 축 툴팁이 컷으로 뜬다 → 84% 까지 머문 뒤 86~94% 폴리곤이 다시 중심으로 접힌다.
// 94% 뒤는 빈 대 빈이라 이어붙는 지점이 안 튄다.
.cr.is-demo .cr__poly {
animation-name: crGrow;
animation-duration: $duration;
animation-timing-function: $easing;
animation-iteration-count: infinite;
}
@keyframes crGrow {
0%, 4% { transform: scale(0); }
34%, 86% { transform: scale(1); }
94%, 100% { transform: scale(0); }
}
// 꼭짓점 점 — 팝(transform)과 퇴장(opacity 컷) 두 애니메이션을 겹친다.
// 컷을 steps 로 떼는 건 루프 끝에 점이 폴리곤보다 늦게 남아 떠 있는 것을 막기 위해서다
.cr.is-demo .cr__dot {
animation-duration: $duration, $duration;
animation-timing-function: $ease-pop, steps(1, end);
animation-iteration-count: infinite, infinite;
}
.cr.is-demo .cr__dot:nth-child(1) { animation-name: crD1, crCut; }
.cr.is-demo .cr__dot:nth-child(2) { animation-name: crD2, crCut; }
.cr.is-demo .cr__dot:nth-child(3) { animation-name: crD3, crCut; }
.cr.is-demo .cr__dot:nth-child(4) { animation-name: crD4, crCut; }
.cr.is-demo .cr__dot:nth-child(5) { animation-name: crD5, crCut; }
.cr.is-demo .cr__dot:nth-child(6) { animation-name: crD6, crCut; }
@keyframes crD1 { 0%, 36% { transform: scale(0); } 42%, 100% { transform: scale(1); } }
@keyframes crD2 { 0%, 40% { transform: scale(0); } 46%, 100% { transform: scale(1); } }
@keyframes crD3 { 0%, 44% { transform: scale(0); } 50%, 100% { transform: scale(1); } }
@keyframes crD4 { 0%, 48% { transform: scale(0); } 54%, 100% { transform: scale(1); } }
@keyframes crD5 { 0%, 52% { transform: scale(0); } 58%, 100% { transform: scale(1); } }
@keyframes crD6 { 0%, 56% { transform: scale(0); } 62%, 100% { transform: scale(1); } }
@keyframes crCut {
0%, 86% { opacity: 1; }
88%, 100% { opacity: 0; }
}
// 미리보기 툴팁은 최고 축(안정성)에 미리 놓아 둔다 (JS 가 2번 축으로 세팅) — 폴리곤 접힘 직전에 컷으로 사라진다
.cr.is-demo .cr__tip {
animation-name: crTip;
animation-duration: $duration;
animation-timing-function: steps(1, end);
animation-iteration-count: infinite;
}
@keyframes crTip {
0%, 64% { opacity: 0; }
66%, 84% { opacity: 1; }
86%, 100% { opacity: 0; }
}
@media (max-width: 340px) {
.cr__card { padding: $sp-2 $sp-3 $sp-1; }
.cr__lab { font-size: 9px; }
}
@media (prefers-reduced-motion: reduce) {
.cr.is-demo .cr__poly,
.cr.is-demo .cr__dot,
.cr.is-demo .cr__tip { animation: none !important; }
// 움직임 없이 다 펼쳐진 최종 상태로 점프한다
.cr.is-demo .cr__poly { transform: none !important; }
.cr.is-demo .cr__dot { transform: none !important; opacity: 1 !important; }
}html, body {
margin: 0;
overflow: hidden;
}
.stage {
box-sizing: border-box;
min-height: 100vh;
display: grid;
place-items: center;
margin: 0;
background: #ffffff;
font-family: -apple-system, "Segoe UI", "Noto Sans KR", sans-serif;
padding: clamp(8px, 4vw, 24px);
}
.cr {
display: flex;
justify-content: center;
width: 100%;
padding-bottom: 8px;
}
.cr__card {
width: min(100%, 420px);
background: #fff7e6;
border-radius: 16px;
box-shadow: 0 14px 24px rgba(23, 20, 26, 0.32);
padding: 12px 16px 8px;
}
.cr__head {
display: flex;
align-items: center;
justify-content: space-between;
gap: 8px;
margin-bottom: 4px;
}
.cr__title {
margin: 0;
font-weight: 800;
font-size: clamp(12px, 3vw, 14px);
color: #17141a;
}
.cr__chip {
font-weight: 700;
font-size: clamp(9px, 2.4vw, 10px);
color: rgba(23, 20, 26, 0.66);
border: 1px solid rgba(23, 20, 26, 0.28);
border-radius: 999px;
padding: 4px 8px;
}
.cr__plot {
position: relative;
}
.cr__svg {
display: block;
width: 100%;
height: auto;
touch-action: none;
cursor: crosshair;
}
.cr__ring {
fill: none;
stroke: rgba(23, 20, 26, 0.14);
stroke-width: 1;
}
.cr__spoke {
stroke: rgba(23, 20, 26, 0.08);
stroke-width: 1;
}
.cr__lab {
fill: rgba(23, 20, 26, 0.72);
font-weight: 800;
font-size: 10px;
dominant-baseline: middle;
}
.cr__poly {
fill: rgba(47, 109, 246, 0.22);
stroke: #2f6df6;
stroke-width: 2.5;
stroke-linejoin: round;
transform-box: fill-box;
transform-origin: center;
}
.cr__dot {
fill: #ffffff;
stroke: #2f6df6;
stroke-width: 2;
transform-box: fill-box;
transform-origin: center;
}
.cr__tip {
position: absolute;
transform: translate(-50%, -128%);
display: flex;
align-items: baseline;
gap: 4px;
pointer-events: none;
background: #17141a;
color: #ffffff;
border-radius: 4px;
padding: 4px 8px;
font-weight: 700;
font-size: 10px;
white-space: nowrap;
opacity: 0;
}
.cr__tip.is-below {
transform: translate(-50%, 18%);
}
.cr__tip.is-on {
opacity: 1;
transition: opacity 220ms ease-out;
}
.cr__tipName {
opacity: 0.72;
}
.cr__tipVal {
font-size: 12px;
}
.cr__sr {
position: fixed;
top: 0;
left: -640px;
width: 320px;
margin: 0;
}
.cr.is-demo .cr__poly {
animation-name: crGrow;
animation-duration: 2s;
animation-timing-function: cubic-bezier(0.2, 0.8, 0.2, 1);
animation-iteration-count: infinite;
}
@keyframes crGrow {
0%, 4% {
transform: scale(0);
}
34%, 86% {
transform: scale(1);
}
94%, 100% {
transform: scale(0);
}
}
.cr.is-demo .cr__dot {
animation-duration: 2s, 2s;
animation-timing-function: cubic-bezier(0.2, 1.4, 0.4, 1), steps(1, end);
animation-iteration-count: infinite, infinite;
}
.cr.is-demo .cr__dot:nth-child(1) {
animation-name: crD1, crCut;
}
.cr.is-demo .cr__dot:nth-child(2) {
animation-name: crD2, crCut;
}
.cr.is-demo .cr__dot:nth-child(3) {
animation-name: crD3, crCut;
}
.cr.is-demo .cr__dot:nth-child(4) {
animation-name: crD4, crCut;
}
.cr.is-demo .cr__dot:nth-child(5) {
animation-name: crD5, crCut;
}
.cr.is-demo .cr__dot:nth-child(6) {
animation-name: crD6, crCut;
}
@keyframes crD1 {
0%, 36% {
transform: scale(0);
}
42%, 100% {
transform: scale(1);
}
}
@keyframes crD2 {
0%, 40% {
transform: scale(0);
}
46%, 100% {
transform: scale(1);
}
}
@keyframes crD3 {
0%, 44% {
transform: scale(0);
}
50%, 100% {
transform: scale(1);
}
}
@keyframes crD4 {
0%, 48% {
transform: scale(0);
}
54%, 100% {
transform: scale(1);
}
}
@keyframes crD5 {
0%, 52% {
transform: scale(0);
}
58%, 100% {
transform: scale(1);
}
}
@keyframes crD6 {
0%, 56% {
transform: scale(0);
}
62%, 100% {
transform: scale(1);
}
}
@keyframes crCut {
0%, 86% {
opacity: 1;
}
88%, 100% {
opacity: 0;
}
}
.cr.is-demo .cr__tip {
animation-name: crTip;
animation-duration: 2s;
animation-timing-function: steps(1, end);
animation-iteration-count: infinite;
}
@keyframes crTip {
0%, 64% {
opacity: 0;
}
66%, 84% {
opacity: 1;
}
86%, 100% {
opacity: 0;
}
}
@media (max-width: 340px) {
.cr__card {
padding: 8px 12px 4px;
}
.cr__lab {
font-size: 9px;
}
}
@media (prefers-reduced-motion: reduce) {
.cr.is-demo .cr__poly,
.cr.is-demo .cr__dot,
.cr.is-demo .cr__tip {
animation: none !important;
}
.cr.is-demo .cr__poly {
transform: none !important;
}
.cr.is-demo .cr__dot {
transform: none !important;
opacity: 1 !important;
}
}var AXES = ['Design', 'Speed', 'Stability', 'Docs', 'Community', 'Price'];
var VALS = [86, 72, 90, 64, 78, 58];
var CX = 232, CY = 100, R = 68, N = 6;
var NS = 'http://www.w3.org/2000/svg';
var cr = document.getElementById('cr');
var svg = document.getElementById('chart');
var tip = document.getElementById('tip');
var tipName = document.getElementById('tipName');
var tipVal = document.getElementById('tipVal');
var pts = []; // 꼭짓점의 viewBox 좌표 — 그리기와 툴팁 거리 재기에 같이 쓴다
function mk(tag) { return document.createElementNS(NS, tag); }
// i번째 축의 좌표 — 위꼭짓점(i=0)에서 시작해 시계 방향 60도 간격.
// r 에 Score 비율을 곱하면 데이터 위치, 눈금 반지름을 그대로 넣으면 격자 꼭짓점이 된다
function pos(i, r) {
var rad = (i * 60 - 90) * Math.PI / 180;
return [CX + r * Math.cos(rad), CY + r * Math.sin(rad)];
}
// 반지름 r 육각형의 points 문자열 — 눈금 격자와 데이터 폴리곤이 같은 함수에서 나온다
function ringPts(r) {
var s = '';
for (var i = 0; i < N; i++) { var p = pos(i, r); s += (i ? ' ' : '') + p[0].toFixed(1) + ',' + p[1].toFixed(1); }
return s;
}
// 눈금 격자 — 100% 육각형, 50% 육각형, 축선 6개
var grid = document.getElementById('grid');
[R, R / 2].forEach(function (r) {
var pg = mk('polygon'); pg.setAttribute('class', 'cr__ring'); pg.setAttribute('points', ringPts(r)); grid.appendChild(pg);
});
for (var g = 0; g < N; g++) {
var ln = mk('line'); var gp = pos(g, R);
ln.setAttribute('class', 'cr__spoke');
ln.setAttribute('x1', CX); ln.setAttribute('y1', CY); ln.setAttribute('x2', gp[0].toFixed(1)); ln.setAttribute('y2', gp[1].toFixed(1));
grid.appendChild(ln);
}
// Axis 라벨 — 위·아래 축은 가운데 정렬, 옆 축은 바깥으로 붙인다
var labs = document.getElementById('labs');
AXES.forEach(function (name, i) {
var t = mk('text'); var p = pos(i, R + 18);
t.setAttribute('class', 'cr__lab');
t.setAttribute('x', p[0].toFixed(1)); t.setAttribute('y', p[1].toFixed(1));
t.setAttribute('text-anchor', i === 0 || i === 3 ? 'middle' : (i < 3 ? 'start' : 'end'));
t.textContent = name; labs.appendChild(t);
});
// 데이터 폴리곤 + 꼭짓점 pts — 점수를 100으로 나눠 반지름에 곱한다
VALS.forEach(function (v, i) { pts.push(pos(i, R * v / 100)); });
document.getElementById('poly').setAttribute('points',
pts.map(function (p) { return p[0].toFixed(1) + ',' + p[1].toFixed(1); }).join(' '));
var dots = document.getElementById('dots');
pts.forEach(function (p) {
var c = mk('circle'); c.setAttribute('class', 'cr__dot'); c.setAttribute('r', 3.5);
c.setAttribute('cx', p[0].toFixed(1)); c.setAttribute('cy', p[1].toFixed(1)); dots.appendChild(c);
});
// 스크린리더 표 채우기
var srBody = document.getElementById('srBody');
AXES.forEach(function (name, i) {
var tr = document.createElement('tr');
var th = document.createElement('th'); th.setAttribute('scope', 'row'); th.textContent = name;
var td = document.createElement('td'); td.textContent = VALS[i] + ' pts';
tr.appendChild(th); tr.appendChild(td); srBody.appendChild(tr);
});
// 툴팁 — 꼭짓점 위에 뜨고 위쪽 반의 축은 아래로 띄운다. 처음 값은 최고 Axis(Stability)
function placeTip(i) {
tip.style.left = (pts[i][0] / 440 * 100).toFixed(2) + '%';
tip.style.top = (pts[i][1] / 198 * 100).toFixed(2) + '%';
tip.classList.toggle('is-below', pts[i][1] < CY);
tipName.textContent = AXES[i];
tipVal.textContent = VALS[i] + ' pts';
}
placeTip(2);
// 꼭짓점 근계에 포인터가 오면 그 축의 이름과 점수를 보여 준다
svg.addEventListener('pointermove', function (e) {
if (cr.classList.contains('is-demo')) { cr.classList.remove('is-demo'); }
var r = svg.getBoundingClientRect();
var vx = (e.clientX - r.left) / r.width * 440;
var vy = (e.clientY - r.top) / r.height * 198;
var best = -1, bd = 46 * 46; // 꼭짓점 46 viewBox 단위 안에 있어야 반응한다
pts.forEach(function (p, i) {
var d = (p[0] - vx) * (p[0] - vx) + (p[1] - vy) * (p[1] - vy);
if (d < bd) { bd = d; best = i; }
});
if (best < 0) { tip.classList.remove('is-on'); return; }
placeTip(best); tip.classList.add('is-on');
});
svg.addEventListener('pointerleave', function () { tip.classList.remove('is-on'); });// ChartRadarPolygon — vanilla 판(run/289/demo/04-chart-draw-radar-polygon/index.html) 의 React 포트.
// 여섯 축 점수를 삼각함수 좌표로 조립한 polygon 이 중심에서 펼쳐지는 레이더 차트.
// 사람이 포인터를 올리면 미리보기 루프(.isDemo)가 떨어지고 꼭짓점 툴팁이 따라온다.
import { useRef, useState } from "react";
import type { CSSProperties } from "react";
import styles from "./ChartRadarPolygon.module.scss";
export type ChartRadarPolygonProps = {
/** 격자 미리보기용 2초 자동 루프. 사람이 포인터를 올리면 꺼진다 */
demo?: boolean;
};
type PtrEvt = { clientX: number; clientY: number };
type Box<T> = { current: T | null };
const AXES = ["디자인", "속도", "안정성", "문서", "커뮤니티", "가격"];
const VALS = [86, 72, 90, 64, 78, 58];
const CX = 232, CY = 100, R = 68, N = 6;
const VW = 440, VH = 198;
const TOP_AXIS = 2; // 안정성 — 미리보기 툴팁이 가리키는 최고 축
/** i번째 축의 좌표 — 위꼭짓점(i=0)에서 시작해 시계 방향 60도 간격 */
function pos(i: number, r: number): [number, number] {
const rad = (i * 60 - 90) * Math.PI / 180;
return [CX + r * Math.cos(rad), CY + r * Math.sin(rad)];
}
/** 반지름 r 육각형의 points 문자열 — 눈금 격자와 데이터 폴리곤이 같은 함수에서 나온다 */
function ringPts(r: number): string {
const s: string[] = [];
for (let i = 0; i < N; i++) { const p = pos(i, r); s.push(p[0].toFixed(1) + "," + p[1].toFixed(1)); }
return s.join(" ");
}
const PTS: [number, number][] = VALS.map((v, i) => pos(i, R * v / 100));
const POLY = PTS.map((p) => p[0].toFixed(1) + "," + p[1].toFixed(1)).join(" ");
/** 꼭짓점 툴팁 위치 — plot 비율 %. 위쪽 반의 축은 아래로 띄운다 */
function tipStyle(i: number): CSSProperties {
const below = PTS[i][1] < CY;
return {
left: (PTS[i][0] / VW * 100).toFixed(2) + "%",
top: (PTS[i][1] / VH * 100).toFixed(2) + "%",
};
}
export default function ChartRadarPolygon({ demo = true }: ChartRadarPolygonProps) {
const svgRef: Box<SVGSVGElement> = useRef(null);
const [live, setLive] = useState(!demo);
const [tipIdx, setTipIdx] = useState<number | null>(TOP_AXIS);
/** pointermove — 커서에서 46 viewBox 단위 안의 꼭짓점을 고른다 */
function onMove(e: PtrEvt) {
const svg = svgRef.current;
if (!svg) return;
setLive(true); // live 를 켜야 .isDemo 루프가 떨어진다 (live=false 가 미리보기 상태다)
const r = svg.getBoundingClientRect();
const vx = (e.clientX - r.left) / r.width * VW;
const vy = (e.clientY - r.top) / r.height * VH;
let best = -1, bd = 46 * 46;
PTS.forEach((p, i) => {
const d = (p[0] - vx) * (p[0] - vx) + (p[1] - vy) * (p[1] - vy);
if (d < bd) { bd = d; best = i; }
});
setTipIdx(best < 0 ? null : best);
}
const shown = tipIdx == null ? TOP_AXIS : tipIdx;
const below = PTS[shown][1] < CY;
const rootCls = [styles.root, live ? "" : styles.isDemo].filter(Boolean).join(" ");
return (
<div className={rootCls}>
<div className={styles.card}>
<div className={styles.head}>
<p className={styles.title}>라이브러리 여섯 축 평가</p>
<span className={styles.chip}>백점 만점</span>
</div>
<div className={styles.plot}>
<svg
className={styles.svg} ref={svgRef} viewBox={`0 0 ${VW} ${VH}`} role="img"
aria-label="여섯 축 점수 레이더 차트, 안정성 90점이 가장 높고 가격 58점이 가장 낮음"
onPointerMove={onMove}
onPointerLeave={() => setTipIdx(null)}
>
{/* 눈금 육각 격자 2겹(50%·100%) + 중심에서 뻗는 축선 6개 */}
<g className={styles.grid}>
{[R, R / 2].map((r) => (
<polygon key={r} className={styles.ring} points={ringPts(r)} />
))}
{AXES.map((_, g) => {
const gp = pos(g, R);
return <line key={g} className={styles.spoke} x1={CX} y1={CY} x2={gp[0].toFixed(1)} y2={gp[1].toFixed(1)} />;
})}
</g>
{/* 축 라벨 6개 — 위·아래 축은 가운데 정렬, 옆 축은 바깥으로 붙인다 */}
<g className={styles.labs}>
{AXES.map((name, i) => {
const p = pos(i, R + 18);
const anchor = i === 0 || i === 3 ? "middle" : (i < 3 ? "start" : "end");
return (
<text key={name} className={styles.lab} x={p[0].toFixed(1)} y={p[1].toFixed(1)} textAnchor={anchor}>{name}</text>
);
})}
</g>
{/* 주인공 폴리곤 + 꼭짓점 점 6개 */}
<polygon className={styles.poly} points={POLY} />
<g className={styles.dots}>
{PTS.map((p, i) => (
<circle key={AXES[i]} className={styles.dot} r={3.5} cx={p[0].toFixed(1)} cy={p[1].toFixed(1)} />
))}
</g>
</svg>
{/* 툴팁 — 꼭짓점 위(위쪽 반은 아래로)에 뜬다 */}
<div
className={[styles.tip, below ? styles.tipBelow : "", tipIdx == null ? "" : styles.tipIsOn].filter(Boolean).join(" ")}
aria-hidden="true"
style={tipStyle(shown)}
>
<span className={styles.tipName}>{AXES[shown]}</span>
<strong className={styles.tipVal}>{VALS[shown]}점</strong>
</div>
{/* 스크린리더용 데이터 표 — 화면에 안 보인다 */}
<table className={styles.sr}>
<caption>라이브러리 여섯 축 평가</caption>
<thead><tr><th scope="col">축</th><th scope="col">점수</th></tr></thead>
<tbody>
{AXES.map((name, i) => (
<tr key={name}><th scope="row">{name}</th><td>{VALS[i]}점</td></tr>
))}
</tbody>
</table>
</div>
</div>
</div>
);
}04 Radar chart unfolding from the center — Measured area 5.192% · moving frames 19/23Original by GODRICH · SCSS and React ship in the zip · CSS Chart Design: 9 SVG Graphs, No Library
The post this demo lives in
 CSS Chart Design: 9 SVG Graphs, No LibraryCSS chart design turns numbers into lines, bars, and areas with no library. These nine use only SVG coordinate math and See all demos in this post