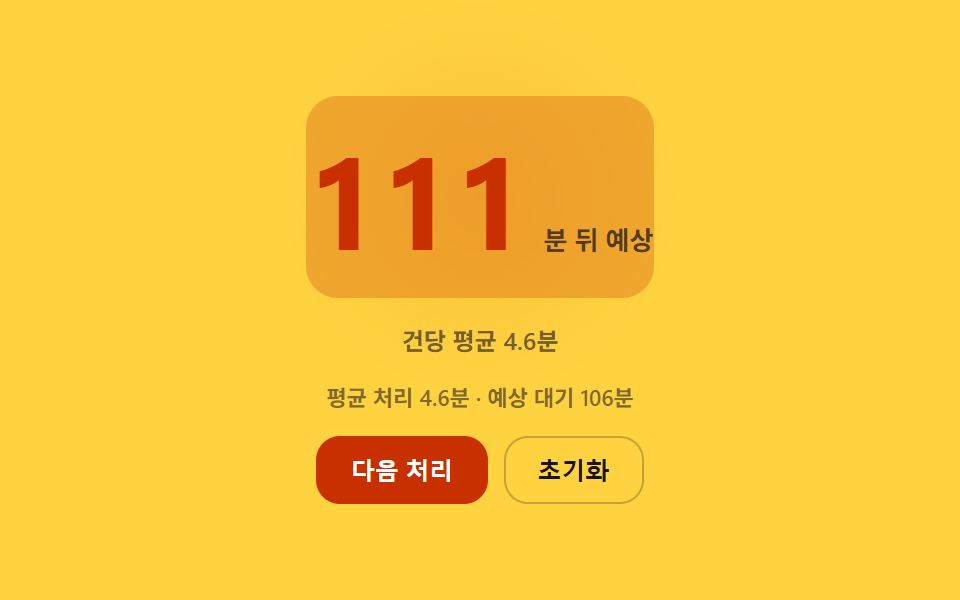
02Estimated Wait Recalculated by Multiplying Average Service Time by Remaining Count
The average time per completed case is multiplied by the remaining count to recalculate the estimated wait, and the minute figure smoothly rises or falls whenever the value changes.
Best forRestaurant waitlist registration screen
ETA_TWEEN_MSavgMinutesSERVICE_LOG_MAX
<main class="stage">
<div class="wet is-demo" id="wetRoot">
  <div class="wet__etaWrap">
    <span class="wet__etaGlow" id="wetGlow" aria-hidden="true"></span>
    <span class="wet__etaNum" id="wetEtaNum" aria-hidden="true">0</span>
    <span class="wet__etaUnit" aria-hidden="true">min estimated</span>
  </div>
  <p class="wet__avg" id="wetAvg" aria-hidden="true">Avg 0.0 min per party</p>
  <p class="wet__status" id="wetStatus" aria-live="polite"></p>
  <div class="wet__controls">
    <button type="button" class="wet__btn wet__btn--primary" id="wetProcess">Process next</button>
    <button type="button" class="wet__btn" id="wetReset">Reset</button>
  </div>
</div>
</main>
@use "../../../../site/static/demo-tokens" as *;
// 핵심: 처리 로그 평균 × 남은 인원으로 예상 대기(분)을 다시 계산해, 바뀐 값을 숫자
// 보간(easeOutCubic)으로 부드럽게 표시하고 변화 폭만큼 숫자 뒤 발광이 함께 번진다.
@include stage($stage-yellow);
.wet {
position: relative;
display: grid;
gap: $sp-3;
justify-items: center;
width: min(90vw, 300px);
}
.wet__etaWrap {
border-radius: $r-card;
position: relative;
display: flex;
align-items: baseline;
gap: $sp-2;
padding: $sp-2 0;
}
.wet__etaGlow {
position: absolute;
top: 50%;
left: 50%;
width: 200px;
height: 200px;
border-radius: 50%;
background: radial-gradient(circle, rgba($subject-orange-deep, .5), rgba($subject-orange-deep, 0) 70%);
transform: translate(-50%, -50%) scale(.85);
opacity: 0;
pointer-events: none;
}
.wet__etaNum {
position: relative;
z-index: 1;
font-size: 64px;
font-weight: 700;
font-variant-numeric: tabular-nums;
color: $subject-orange-deep;
}
.wet__etaUnit {
position: relative;
z-index: 1;
font-size: 13px;
font-weight: 600;
color: rgba($stage-ink, .72);
}
.wet__avg {
margin: 0;
font-size: 12px;
font-weight: 600;
color: rgba($stage-ink, .6);
}
.wet__status {
margin: 0;
font-size: 11px;
font-weight: 600;
color: rgba($stage-ink, .55);
}
.wet__controls {
display: flex;
gap: $sp-2;
}
.wet__btn {
border: 1px solid rgba($stage-ink, .25);
background: transparent;
color: $stage-ink;
border-radius: $r-control;
padding: $sp-2 $sp-4;
font-size: 12px;
font-weight: 600;
cursor: pointer;
}
.wet__btn--primary {
background: $subject-orange-deep;
border-color: $subject-orange-deep;
color: $stage-paper;
}
.wet__btn:focus-visible {
outline: 2px solid $subject-orange-deep;
outline-offset: 2px;
}
@media (max-width: 340px) {
.wet__etaNum { font-size: 36px; }
.wet__etaGlow { width: 90px; height: 90px; }
}
@media (prefers-reduced-motion: reduce) {
.wet__etaGlow { transition: none; opacity: 0 !important; }
}
// 예상 시간이 다시 계산될 때마다 숫자 판이 한 번 밝아졌다 가라앉는다.
.wet__etaWrap.is-flash { animation: wetFlash 900ms ease-out; }
@keyframes wetFlash {
from { background: rgba($subject-orange-deep, .3); }
to { background: rgba($subject-orange-deep, 0); }
}
@media (prefers-reduced-motion: reduce) {
.wet__etaWrap.is-flash { animation: none; }
}html, body {
margin: 0;
overflow: hidden;
}
.stage {
box-sizing: border-box;
min-height: 100vh;
display: grid;
place-items: center;
margin: 0;
background: #ffd23f;
font-family: -apple-system, "Segoe UI", "Noto Sans KR", sans-serif;
padding: clamp(8px, 4vw, 24px);
}
.wet {
position: relative;
display: grid;
gap: 12px;
justify-items: center;
width: min(90vw, 300px);
}
.wet__etaWrap {
border-radius: 16px;
position: relative;
display: flex;
align-items: baseline;
gap: 8px;
padding: 8px 0;
}
.wet__etaGlow {
position: absolute;
top: 50%;
left: 50%;
width: 200px;
height: 200px;
border-radius: 50%;
background: radial-gradient(circle, rgba(201, 48, 0, 0.5), rgba(201, 48, 0, 0) 70%);
transform: translate(-50%, -50%) scale(0.85);
opacity: 0;
pointer-events: none;
}
.wet__etaNum {
position: relative;
z-index: 1;
font-size: 64px;
font-weight: 700;
font-variant-numeric: tabular-nums;
color: #c93000;
}
.wet__etaUnit {
position: relative;
z-index: 1;
font-size: 13px;
font-weight: 600;
color: rgba(23, 20, 26, 0.72);
}
.wet__avg {
margin: 0;
font-size: 12px;
font-weight: 600;
color: rgba(23, 20, 26, 0.6);
}
.wet__status {
margin: 0;
font-size: 11px;
font-weight: 600;
color: rgba(23, 20, 26, 0.55);
}
.wet__controls {
display: flex;
gap: 8px;
}
.wet__btn {
border: 1px solid rgba(23, 20, 26, 0.25);
background: transparent;
color: #17141a;
border-radius: 12px;
padding: 8px 16px;
font-size: 12px;
font-weight: 600;
cursor: pointer;
}
.wet__btn--primary {
background: #c93000;
border-color: #c93000;
color: #ffffff;
}
.wet__btn:focus-visible {
outline: 2px solid #c93000;
outline-offset: 2px;
}
@media (max-width: 340px) {
.wet__etaNum {
font-size: 36px;
}
.wet__etaGlow {
width: 90px;
height: 90px;
}
}
@media (prefers-reduced-motion: reduce) {
.wet__etaGlow {
transition: none;
opacity: 0 !important;
}
}
.wet__etaWrap.is-flash {
animation: wetFlash 900ms ease-out;
}
@keyframes wetFlash {
from {
background: rgba(201, 48, 0, 0.3);
}
to {
background: rgba(201, 48, 0, 0);
}
}
@media (prefers-reduced-motion: reduce) {
.wet__etaWrap.is-flash {
animation: none;
}
}(function () {
// 기법: 처리된 사례들의 소요 시간 로그에서 평균을 계산하고, 그 평균에 Left: 대기 인원을
// 곱해 예상 대기 시간(min)을 다시 계산한다. 값이 바뀔 때마다 ETA_TWEEN_MS 동안 숫자를
// easeOutCubic 으로 보간하고, 변화 폭에 비례해 숫자 뒤 발광을 계산해 함께 전파한다.
// 실제 시각(Date) 은 쓰지 않고 rAF 타임스탬프로만 흐름을 계산하는 가상 시계다.
var ETA_TWEEN_MS = 420;
var SERVICE_LOG_MAX = 12;
function seedRand(seed) {
var s = seed >>> 0;
return function () { s = (s * 1664525 + 1013904223) >>> 0; return s / 4294967296; };
}
var rand = seedRand(434021);
function randServiceMinutes() { return 2.5 + rand() * 3.5; }
function easeOutCubic(t) { return 1 - Math.pow(1 - t, 3); }
var root = document.getElementById('wetRoot');
var etaNumEl = document.getElementById('wetEtaNum');
var glowEl = document.getElementById('wetGlow');
var avgEl = document.getElementById('wetAvg');
var status = document.getElementById('wetStatus');
var reduce = window.matchMedia('(prefers-reduced-motion: reduce)').matches;
if (reduce) root.classList.remove('is-demo');
var INITIAL_REMAIN = 24;
var serviceLog = [];
for (var i = 0; i < 6; i += 1) serviceLog.push(randServiceMinutes());
var remain = INITIAL_REMAIN;
var shownEta = 0;
var etaAnim = null;
function avgMinutes() {
var sum = 0;
for (var i = 0; i < serviceLog.length; i += 1) sum += serviceLog[i];
return sum / serviceLog.length;
}
function targetEta() {
return avgMinutes() * remain;
}
function paintGlow(ratio) {
glowEl.style.opacity = (0.5 * ratio).toFixed(3);
glowEl.style.transform = 'translate(-50%, -50%) scale(' + (0.85 + ratio * 0.5).toFixed(3) + ')';
}
function flash(el) {
if (reduce) return;
el.classList.remove('is-flash');
void el.offsetWidth;
el.classList.add('is-flash');
}
function tweenEta(nowMs, from, to) {
flash(etaNumEl.parentNode);
if (etaAnim) cancelAnimationFrame(etaAnim);
var maxDelta = Math.max(1, avgMinutes() * 4);
var deltaRatio = Math.min(1, Math.abs(to - from) / maxDelta);
if (reduce) {
shownEta = to;
etaNumEl.textContent = Math.round(to);
paintGlow(0);
return;
}
var start = null;
function step(ts) {
if (start === null) start = ts;
var t = Math.min(1, (ts - start) / ETA_TWEEN_MS);
var e = easeOutCubic(t);
var v = from + (to - from) * e;
shownEta = v;
etaNumEl.textContent = Math.round(v);
paintGlow(deltaRatio * (1 - t));
if (t < 1) { etaAnim = requestAnimationFrame(step); } else { etaAnim = null; paintGlow(0); }
}
etaAnim = requestAnimationFrame(step);
}
function paintStatic() {
avgEl.textContent = 'Avg per party ' + avgMinutes().toFixed(1) + 'min';
}
function paintStatus() {
status.textContent = 'Avg service ' + avgMinutes().toFixed(1) + 'min · estimated wait ' + Math.round(targetEta()) + 'min';
}
function recalc(nowMs) {
var from = shownEta;
var to = targetEta();
tweenEta(nowMs, from, to);
paintStatic();
paintStatus();
}
function processNext(nowMs) {
if (remain <= 0) { paintStatus(); return; }
serviceLog.push(randServiceMinutes());
if (serviceLog.length > SERVICE_LOG_MAX) serviceLog.shift();
remain = Math.max(0, remain - 1);
recalc(nowMs);
}
function resetAll(nowMs) {
serviceLog = [];
for (var i = 0; i < 6; i += 1) serviceLog.push(randServiceMinutes());
remain = INITIAL_REMAIN;
shownEta = targetEta();
etaNumEl.textContent = Math.round(shownEta);
paintGlow(0);
paintStatic();
paintStatus();
}
var processBtn = document.getElementById('wetProcess');
var resetBtn = document.getElementById('wetReset');
function onProcess() { root.classList.remove('is-demo'); processNext(perfNow()); }
function onReset() { root.classList.remove('is-demo'); resetAll(perfNow()); }
processBtn.addEventListener('click', onProcess);
processBtn.addEventListener('keydown', function (e) {
if (e.key === 'Enter' || e.key === ' ') { e.preventDefault(); onProcess(); }
});
resetBtn.addEventListener('click', onReset);
resetBtn.addEventListener('keydown', function (e) {
if (e.key === 'Enter' || e.key === ' ') { e.preventDefault(); onReset(); }
});
var t0 = null;
function perfNow() { return t0 === null ? 0 : performance.now() - t0; }
var demoSchedule = [200, 1200];
var demoIndex = 0;
function tick(ts) {
if (t0 === null) t0 = ts;
var now = ts - t0;
if (!reduce && root.classList.contains('is-demo') && demoIndex < demoSchedule.length && now >= demoSchedule[demoIndex]) {
if (remain <= 0) { resetAll(now); } else { processNext(now); }
demoIndex += 1;
if (demoIndex >= demoSchedule.length) { demoIndex = 0; demoSchedule = demoSchedule.map(function (v) { return v + now + 2000; }); }
}
requestAnimationFrame(tick);
}
shownEta = targetEta();
etaNumEl.textContent = Math.round(shownEta);
paintStatic();
paintStatus();
requestAnimationFrame(tick);
})();// WaitingQueueEtaAverageServiceTime — vanilla 판(02-waiting-queue-eta-average-service-time) 의 React 포트.
// 처리 로그 평균(분) × 남은 인원으로 예상 대기 시간을 다시 계산해, 바뀐 값을 easeOutCubic 으로
// 보간하고 변화 폭에 비례한 발광을 같은 값으로 전파한다 — Date 없이 rAF 타임스탬프만 쓰는 가상 시계.
import { useEffect, useRef, useState } from "react";
import styles from "./WaitingQueueEtaAverageServiceTime.module.scss";
type Box<T> = { current: T };
const ETA_TWEEN_MS = 420;
const SERVICE_LOG_MAX = 12;
const INITIAL_REMAIN = 24;
function seedRand(seed: number): () => number {
let s = seed >>> 0;
return function () { s = (s * 1664525 + 1013904223) >>> 0; return s / 4294967296; };
}
function easeOutCubic(t: number): number {
return 1 - Math.pow(1 - t, 3);
}
function flash(el: HTMLElement | null, cls: string, reduce: boolean): void {
if (reduce || !el) return;
el.classList.remove(cls);
void el.offsetWidth;
el.classList.add(cls);
}
export default function WaitingQueueEtaAverageServiceTime() {
const [etaText, setEtaText] = useState("0");
const [avgText, setAvgText] = useState("건당 평균 0.0분");
const [status, setStatus] = useState("");
const [glow, setGlow] = useState({ opacity: 0, scale: 0.85 });
const [reduce, setReduce] = useState(false);
const randRef = useRef<() => number>(seedRand(434021)) as Box<() => number>;
const logRef = useRef<number[]>([]) as Box<number[]>;
const remainRef = useRef<number>(INITIAL_REMAIN) as Box<number>;
const shownEtaRef = useRef<number>(0) as Box<number>;
const etaAnimRef = useRef<number>(0) as Box<number>;
const demoRef = useRef<boolean>(true) as Box<boolean>;
const demoIndexRef = useRef<number>(0) as Box<number>;
const demoScheduleRef = useRef<number[]>([200, 1200]) as Box<number[]>;
const frameRef = useRef<number>(0) as Box<number>;
const etaWrapRef = useRef<HTMLDivElement | null>(null) as Box<HTMLDivElement | null>;
function randServiceMinutes(): number { return 2.5 + randRef.current() * 3.5; }
useEffect(() => {
setReduce(window.matchMedia("(prefers-reduced-motion: reduce)").matches);
for (let i = 0; i < 6; i += 1) logRef.current.push(randServiceMinutes());
shownEtaRef.current = targetEta();
setEtaText(String(Math.round(shownEtaRef.current)));
paintStatic();
paintStatus();
// eslint-disable-next-line react-hooks/exhaustive-deps
}, []);
function avgMinutes(): number {
const log = logRef.current;
if (log.length === 0) return 0;
let sum = 0;
for (let i = 0; i < log.length; i += 1) sum += log[i];
return sum / log.length;
}
function targetEta(): number { return avgMinutes() * remainRef.current; }
function paintStatic(): void {
setAvgText("건당 평균 " + avgMinutes().toFixed(1) + "분");
}
function paintStatus(): void {
setStatus("평균 처리 " + avgMinutes().toFixed(1) + "분 · 예상 대기 " + Math.round(targetEta()) + "분");
}
function tweenEta(from: number, to: number): void {
flash(etaWrapRef.current, styles.isFlash, reduce);
if (etaAnimRef.current) cancelAnimationFrame(etaAnimRef.current);
const maxDelta = Math.max(1, avgMinutes() * 4);
const deltaRatio = Math.min(1, Math.abs(to - from) / maxDelta);
if (reduce) {
shownEtaRef.current = to;
setEtaText(String(Math.round(to)));
setGlow({ opacity: 0, scale: 0.85 });
return;
}
let start = 0;
function step(ts: number): void {
if (start === 0) start = ts;
const t = Math.min(1, (ts - start) / ETA_TWEEN_MS);
const e = easeOutCubic(t);
const v = from + (to - from) * e;
shownEtaRef.current = v;
setEtaText(String(Math.round(v)));
const ratio = deltaRatio * (1 - t);
setGlow({ opacity: 0.5 * ratio, scale: 0.85 + ratio * 0.5 });
if (t < 1) { etaAnimRef.current = requestAnimationFrame(step); } else { etaAnimRef.current = 0; setGlow({ opacity: 0, scale: 0.85 }); }
}
etaAnimRef.current = requestAnimationFrame(step);
}
function recalc(): void {
const from = shownEtaRef.current;
const to = targetEta();
tweenEta(from, to);
paintStatic();
paintStatus();
}
function processNext(): void {
if (remainRef.current <= 0) { paintStatus(); return; }
logRef.current.push(randServiceMinutes());
if (logRef.current.length > SERVICE_LOG_MAX) logRef.current.shift();
remainRef.current = Math.max(0, remainRef.current - 1);
recalc();
}
function resetAll(): void {
logRef.current = [];
for (let i = 0; i < 6; i += 1) logRef.current.push(randServiceMinutes());
remainRef.current = INITIAL_REMAIN;
shownEtaRef.current = targetEta();
setEtaText(String(Math.round(shownEtaRef.current)));
setGlow({ opacity: 0, scale: 0.85 });
paintStatic();
paintStatus();
}
function stopDemo(): void { demoRef.current = false; }
useEffect(() => {
let t0 = 0;
function tick(ts: number): void {
if (t0 === 0) t0 = ts;
const now = ts - t0;
const sched = demoScheduleRef.current;
if (!reduce && demoRef.current && demoIndexRef.current < sched.length && now >= sched[demoIndexRef.current]) {
if (remainRef.current <= 0) { resetAll(); } else { processNext(); }
demoIndexRef.current += 1;
if (demoIndexRef.current >= sched.length) {
demoIndexRef.current = 0;
demoScheduleRef.current = sched.map((v) => v + now + 2000);
}
}
frameRef.current = requestAnimationFrame(tick);
}
frameRef.current = requestAnimationFrame(tick);
return () => cancelAnimationFrame(frameRef.current);
// eslint-disable-next-line react-hooks/exhaustive-deps
}, [reduce]);
function onProcess(): void { stopDemo(); processNext(); }
function onReset(): void { stopDemo(); resetAll(); }
function onKeyDown(e: { key: string; preventDefault: () => void }, fn: () => void): void {
if (e.key === "Enter" || e.key === " ") { e.preventDefault(); fn(); }
}
return (
<main className={styles.stage}>
<div className={styles.wet}>
<div className={styles.etaWrap} ref={etaWrapRef}>
<span className={styles.etaGlow} aria-hidden="true" style={{ opacity: glow.opacity, transform: "translate(-50%, -50%) scale(" + glow.scale + ")" }} />
<span className={styles.etaNum} aria-hidden="true">{etaText}</span>
<span className={styles.etaUnit} aria-hidden="true">분 뒤 예상</span>
</div>
<p className={styles.avg} aria-hidden="true">{avgText}</p>
<p className={styles.status} aria-live="polite">{status}</p>
<div className={styles.controls}>
<button type="button" className={[styles.btn, styles.btnPrimary].join(" ")} onClick={onProcess} onKeyDown={(e: { key: string; preventDefault: () => void }) => onKeyDown(e, onProcess)}>다음 처리</button>
<button type="button" className={styles.btn} onClick={onReset} onKeyDown={(e: { key: string; preventDefault: () => void }) => onKeyDown(e, onReset)}>초기화</button>
</div>
</div>
</main>
);
}02 Estimated Wait Recalculated by Multiplying Average Service Time by Remaining Count — Measured area 12.84% · moving frames 7/23Original by GODRICH · SCSS and React ship in the zip · Queue Number Display: 9 Waiting Board Patterns
The post this demo lives in
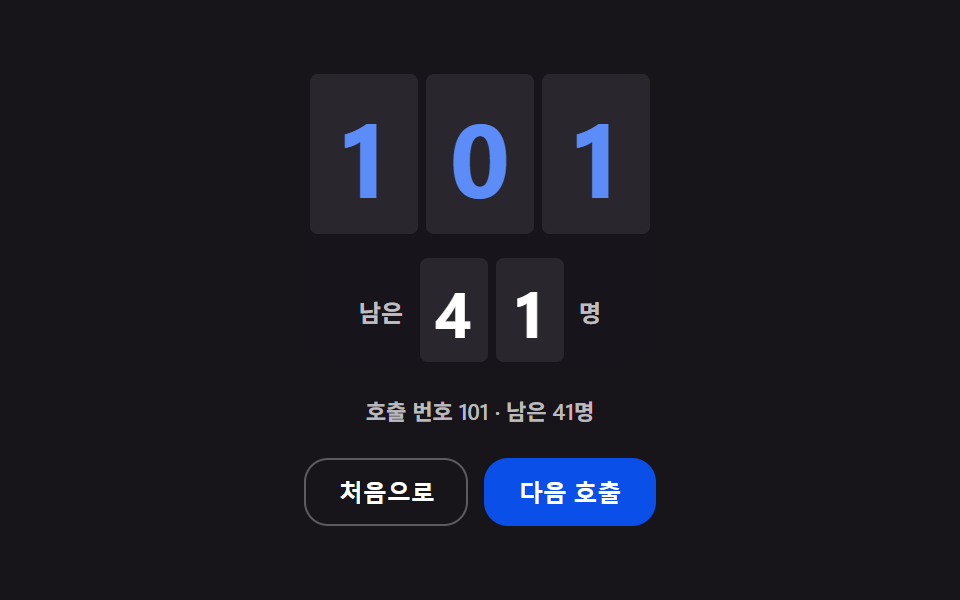 Queue Number Display: 9 Waiting Board PatternsWhen the average time changes, the estimated wait recalculates as a number, the list rows pull up to fill the gap, and t See all demos in this post
If you like this effect - similar demos
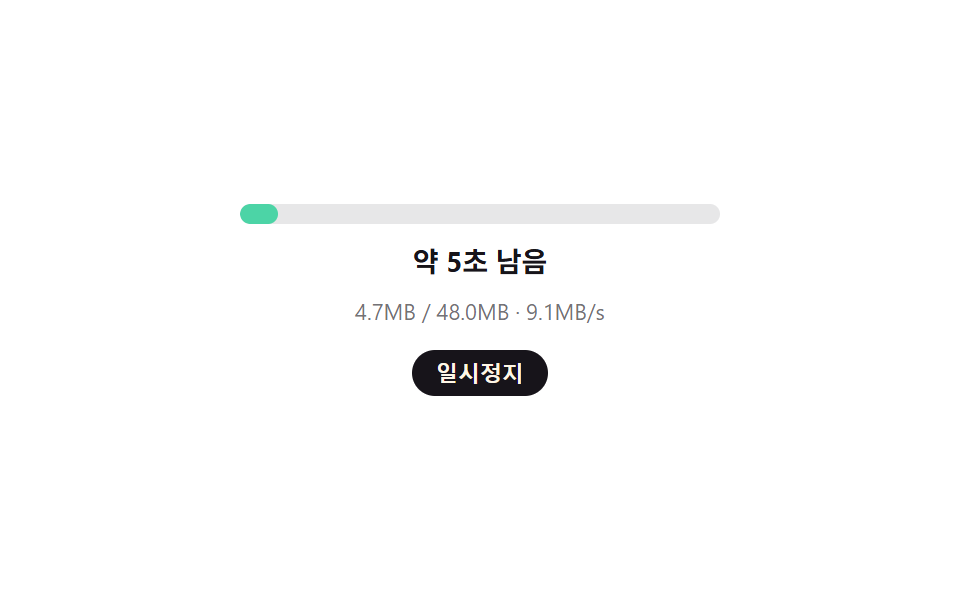 Loaders06 ETA Recalculated From Remaining Size and SpeedBuffering Animation CSS — 9 Loading Patterns
 Loaders06 Group chat cycle — a label redrawing width from remaining time as typers change9 Typing Indicator CSS Patterns (Chat UI)
 Loaders04 Load-more button morph — a button recomputing its width from the remaining item countInfinite Scroll Loading: 9 Essential UI Patterns