07Sparkline stream
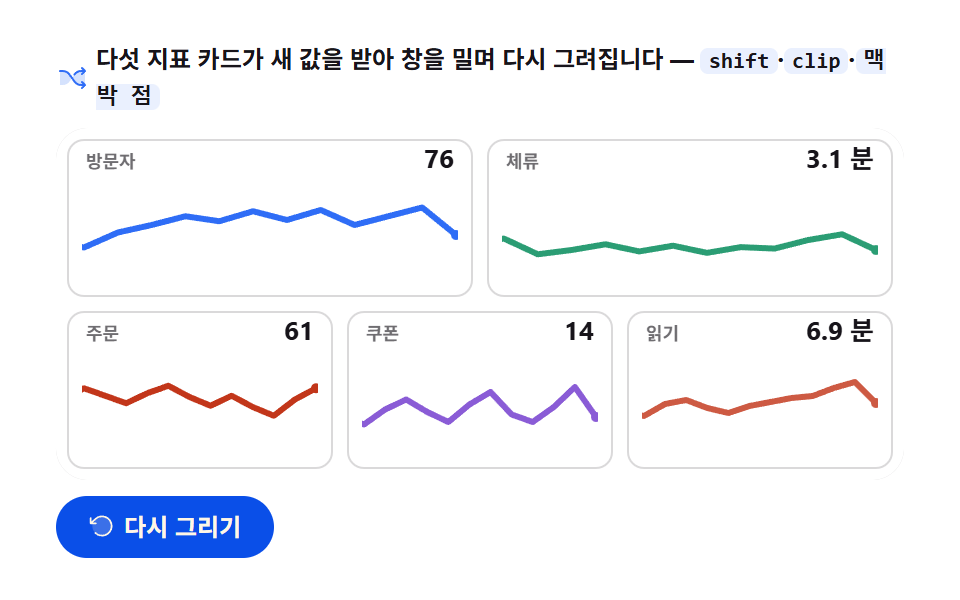
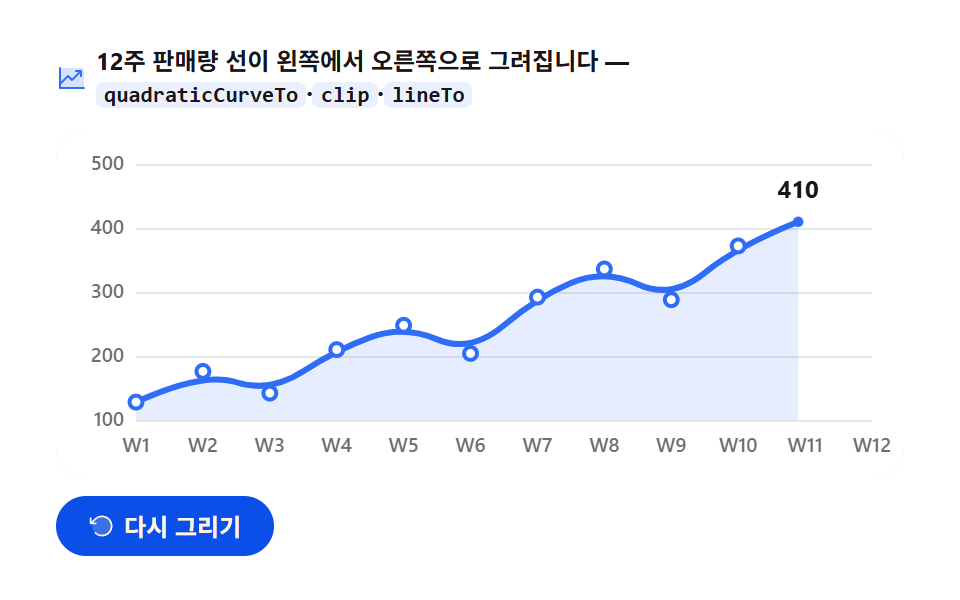
Five card minis take one fresh value every 1.6s, shift their window, and redraw; the last point pulses and the value updates as it lands.
Best forMini metrics inside list rows and cards
easeOutCubicrequestAnimationFramepath
<main class="stage">
<div class="ss" id="ss">
  <p class="ss__hint">
    <svg class="ss__ico" viewBox="0 0 256 256" aria-hidden="true"><g fill="currentColor"><path d="M107.14 98.8L128 128l-20.86 29.2A64 64 0 0 1 55.06 184H32V72h23.06a64 64 0 0 1 52.08 26.8m93.8-26.8a64 64 0 0 0-52.08 26.8L128 128l20.86 29.2a64 64 0 0 0 52.08 26.8H232V72Z" opacity=".2"/><path d="M237.66 178.34a8 8 0 0 1 0 11.32l-24 24a8 8 0 0 1-11.32-11.32L212.69 192h-11.75a72.12 72.12 0 0 1-58.59-30.15l-41.72-58.4A56.1 56.1 0 0 0 55.06 80H32a8 8 0 0 1 0-16h23.06a72.12 72.12 0 0 1 58.59 30.15l41.72 58.4A56.1 56.1 0 0 0 200.94 176h11.75l-10.35-10.34a8 8 0 0 1 11.32-11.32ZM143 107a8 8 0 0 0 11.16-1.86l1.2-1.67A56.1 56.1 0 0 1 200.94 80h11.75l-10.35 10.34a8 8 0 0 0 11.32 11.32l24-24a8 8 0 0 0 0-11.32l-24-24a8 8 0 0 0-11.32 11.32L212.69 64h-11.75a72.12 72.12 0 0 0-58.59 30.15l-1.2 1.67A8 8 0 0 0 143 107"/></g></svg>
    <span>Five metric cards receive new values, push the window, and redraw — <code>shift</code>·<code>clip</code>·<code>Pulse dot</code></span>
  </p>
  <div class="ss__field" id="field" role="application" aria-label="Sparkline stream test board" tabindex="0">
    <canvas class="ss__cv" id="cv" role="img" aria-label="Mini sparklines on five metric cards — the 12-value window gets pushed by new values and the last dot pulses"></canvas>
  </div>
  <div class="ss__bar">
    <button class="ss__btn" id="replay" type="button">
      <svg class="ss__bico" viewBox="0 0 256 256" aria-hidden="true"><g fill="currentColor"><path d="M216 128a88 88 0 1 1-88-88a88 88 0 0 1 88 88" opacity=".2"/><path d="M224 128a96 96 0 0 1-94.71 96H128a95.38 95.38 0 0 1-65.9-26.2a8 8 0 0 1 11-11.63a80 80 0 1 0-1.67-114.78a3 3 0 0 1-.26.25L44.59 96H72a8 8 0 0 1 0 16H24a8 8 0 0 1-8-8V56a8 8 0 0 1 16 0v29.8L60.25 60A96 96 0 0 1 224 128"/></g></svg>
      <span>Redraw</span>
    </button>
    <table class="sr-only">
      <caption>Last 12 values per metric (including the just-received value)</caption>
      <thead><tr><th scope="col">Metric</th><th scope="col">Just received</th></tr></thead>
      <tbody>
        <tr><th scope="row">Visitors</th><td>91</td></tr>
        <tr><th scope="row">Stay (min)</th><td>3.8</td></tr>
        <tr><th scope="row">Orders</th><td>39</td></tr>
        <tr><th scope="row">Coupons</th><td>18</td></tr>
        <tr><th scope="row">Reading (min)</th><td>8.4</td></tr>
      </tbody>
    </table>
  </div>
</div>
</main>@use "sass:color";
@use "../../../../site/static/demo-tokens" as *;
// 스파크라인 스트림 — 움직임은 전부 캔버스 rAF 루프 안(카드 5장 틀도 캔버스가 그린다 + 창 밀기 + 맥박 점).
// CSS 애니메이션 0개 — 렌더러가 실시간 24장을 찍는다(077·304 선례).
// 다섯 계열색은 차트 토큰 고정 순서 1~4 + 한 장은 lift 톤. 무대는 $stage-paper(흰).
$duration: $dur-loop;
$easing: $ease-out; // easeOutCubic 을 JS 에서 계산하므로 CSS 쪽 이징 토큰은 감속 역할명으로
$color: $chart-1;
@include stage($stage-paper);
// 화면 낭독기용 표 — 캔버스를 읽지 못하므로 같은 데이터를 표로 붙인다
.sr-only {
// fixed + top/left 명시 — absolute 였을 때 표의 실제 콘텐츠 높이(행 수만큼 ≒ 390px)가
// scrollHeight 에 잡혀 데스크톱·폰 전부 세로 넘침(BD8/BD9)이 났다. top 을 주지 않으면
// static 자리 기준으로 배치돼 여전히 scrollHeight 에 들어간다 — 좌상단 고정으로 뺀다.
position: fixed; top: 0; left: 0; width: 1px; height: 1px; margin: -1px;
overflow: hidden; clip: rect(0 0 0 0); white-space: nowrap;
}
.ss {
// 캔버스가 읽는 색 — JS 가 getComputedStyle 로 꺼내 쓴다. vivid 리터럴은 두지 않는다(BD26)
--chart-1: #{$chart-1};
--chart-2: #{$chart-2};
--chart-3: #{$chart-3};
--chart-4: #{$chart-4};
// 파스텔 카운터파트 — 다섯째 카드 계열(어두운 무대 기준색을 흰 무대 위 가시에 맞춘 리프트)
--chart-2-lift: #{color.mix(#ffffff, $chart-2, 18%)};
--ink: #{$subject-ink};
--mute: #{rgba($subject-ink, .62)};
--card: #{$stage-paper};
--edge: #{rgba($subject-ink, .16)};
--track: #{rgba($subject-ink, .12)};
--paper: #{$stage-paper};
display: flex; flex-direction: column; gap: $sp-2;
width: 100%; max-width: 424px;
}
.ss__hint {
display: flex; align-items: center; gap: $sp-1; margin: 0;
font-weight: 700; font-size: clamp(10px, 2.8vw, 12px); line-height: 1.35;
color: $subject-ink;
}
.ss__hint code {
padding: 0 $sp-1; border-radius: $r-xs;
background: rgba($chart-1, .10);
color: $subject-ink;
font-weight: 700; font-size: .92em; line-height: 1.3;
}
.ss__ico { width: 16px; height: 16px; flex: 0 0 auto; color: $color; }
.ss__field {
position: relative; height: 176px;
border-radius: $r-card; overflow: hidden;
background: $stage-paper;
box-shadow: inset 0 0 0 1px rgba($subject-ink, .16);
}
.ss__cv { display: block; width: 100%; height: 100%; }
.ss__bar {
display: flex; align-items: center; gap: $sp-2;
}
.ss__btn {
display: inline-flex; align-items: center; gap: $sp-1;
box-sizing: border-box; padding: $sp-2 $sp-4; border: 0;
border-radius: $r-pill; background: $subject-blue-deep; color: $subject-cream;
font-family: inherit; font-weight: 700; font-size: 12px; line-height: 1.2;
cursor: pointer;
}
.ss__btn:focus-visible { outline: 2px solid $color; outline-offset: 2px; }
.ss__bico { width: 14px; height: 14px; flex: 0 0 auto; }
@media (max-width: 340px) {
.ss { gap: $sp-1; }
.ss__field { height: 112px; }
.ss__hint { font-size: 10px; }
.ss__btn { padding: $sp-1 $sp-3; font-size: 11px; }
}
// reduce — 루프가 아예 안 돌므로 끌 애니메이션이 없다. 완성 상태 한 장만 남는다.
@media (prefers-reduced-motion: reduce) {
.ss__btn { cursor: default; }
}html, body {
margin: 0;
overflow: hidden;
}
.stage {
box-sizing: border-box;
min-height: 100vh;
display: grid;
place-items: center;
margin: 0;
background: #ffffff;
font-family: -apple-system, "Segoe UI", "Noto Sans KR", sans-serif;
padding: clamp(8px, 4vw, 24px);
}
.sr-only {
position: fixed;
top: 0;
left: 0;
width: 1px;
height: 1px;
margin: -1px;
overflow: hidden;
clip: rect(0 0 0 0);
white-space: nowrap;
}
.ss {
--chart-1: #2f6df6;
--chart-2: #c2361a;
--chart-3: #2b9d74;
--chart-4: #8a5cd6;
--chart-2-lift: rgb(80.3843137255%, 35.3647058824%, 26.3607843137%);
--ink: #17141a;
--mute: rgba(23, 20, 26, 0.62);
--card: #ffffff;
--edge: rgba(23, 20, 26, 0.16);
--track: rgba(23, 20, 26, 0.12);
--paper: #ffffff;
display: flex;
flex-direction: column;
gap: 8px;
width: 100%;
max-width: 424px;
}
.ss__hint {
display: flex;
align-items: center;
gap: 4px;
margin: 0;
font-weight: 700;
font-size: clamp(10px, 2.8vw, 12px);
line-height: 1.35;
color: #17141a;
}
.ss__hint code {
padding: 0 4px;
border-radius: 4px;
background: rgba(47, 109, 246, 0.1);
color: #17141a;
font-weight: 700;
font-size: 0.92em;
line-height: 1.3;
}
.ss__ico {
width: 16px;
height: 16px;
flex: 0 0 auto;
color: #2f6df6;
}
.ss__field {
position: relative;
height: 176px;
border-radius: 16px;
overflow: hidden;
background: #ffffff;
box-shadow: inset 0 0 0 1px rgba(23, 20, 26, 0.16);
}
.ss__cv {
display: block;
width: 100%;
height: 100%;
}
.ss__bar {
display: flex;
align-items: center;
gap: 8px;
}
.ss__btn {
display: inline-flex;
align-items: center;
gap: 4px;
box-sizing: border-box;
padding: 8px 16px;
border: 0;
border-radius: 999px;
background: #0a4fe8;
color: #fff7e6;
font-family: inherit;
font-weight: 700;
font-size: 12px;
line-height: 1.2;
cursor: pointer;
}
.ss__btn:focus-visible {
outline: 2px solid #2f6df6;
outline-offset: 2px;
}
.ss__bico {
width: 14px;
height: 14px;
flex: 0 0 auto;
}
@media (max-width: 340px) {
.ss {
gap: 4px;
}
.ss__field {
height: 112px;
}
.ss__hint {
font-size: 10px;
}
.ss__btn {
padding: 4px 12px;
font-size: 11px;
}
}
@media (prefers-reduced-motion: reduce) {
.ss__btn {
cursor: default;
}
}// 스파크라인 스트림 — 카드 5장(틀도 전부 캔버스가 그린다)이 2초 루프 안에서 값을 2번 받아
// 시간 창(최근 12개)을 밀고 다시 그린다. Value 교체 경계는 p=0.33·0.66 — 이 편 데모 규격이
// 2초라서 그 안에서 창 밀기가 두 번 일어난다. 카드마다 작은 시차(stagger)를 둬 서로 어긋나게 한다.
// 창 밀기 그림: 전체 값열(seed+next)에서 옛 창과 새 창을 겹친 13점을 그리되
// x = px + 칸*(m - slide) 로 놓는다 — slide=0 이면 옛 창 정렬, slide=1 이면 새 창 정렬.
// 플롯 사각형으로 clip 해 새 점은 오른쪽에서, 밀려나는 점은 왼쪽에서 사라진다.
// 마지막 점은 맥박(반지름 진동) — Value 도착 직후 강하게 뛰고 사이엔 잔 진동만 남는다.
var root = document.getElementById('ss');
var field = document.getElementById('field');
var cv = document.getElementById('cv');
var ctx = cv.getContext('2d');
var replayBtn = document.getElementById('replay');
var css = getComputedStyle(root);
var C_1 = css.getPropertyValue('--chart-1').trim();
var C_2 = css.getPropertyValue('--chart-2').trim();
var C_3 = css.getPropertyValue('--chart-3').trim();
var C_4 = css.getPropertyValue('--chart-4').trim();
var C_LIFT = css.getPropertyValue('--chart-2-lift').trim();
var C_INK = css.getPropertyValue('--ink').trim();
var C_MUTE = css.getPropertyValue('--mute').trim();
var C_CARD = css.getPropertyValue('--card').trim();
var C_EDGE = css.getPropertyValue('--edge').trim();
var C_TRACK = css.getPropertyValue('--track').trim();
var C_PAPER = css.getPropertyValue('--paper').trim();
var FONT = '-apple-system, "Segoe UI", "Noto Sans KR", sans-serif';
// 고정 시드 — 카드마다 다른 배열(12개)과 다음 Value 2개. 시드이므로 다시 그려도 같은 흐름.
// 다섯 계열색은 차트 토큰 고정 순서(1~4) + 한 장은 lift 톤(파스텔 카운터파트).
var CARDS = [
{ name: 'Visitors', unit: '', dec: 0, vMin: 40, vMax: 120, color: C_1, seed: [62, 71, 66, 78, 84, 91, 87, 95, 88, 96, 84, 91], next: [98, 76] },
{ name: 'Stay', unit: 'min', dec: 1, vMin: 1, vMax: 8, color: C_3, seed: [4.1, 3.6, 3.9, 2.8, 3.1, 3.5, 3.0, 3.4, 2.9, 3.3, 3.2, 3.8], next: [4.2, 3.1] },
{ name: 'Orders', unit: '', dec: 0, vMin: 10, vMax: 90, color: C_2, seed: [58, 52, 61, 55, 49, 57, 63, 54, 47, 55, 46, 39], next: [52, 61] },
{ name: 'Coupons', unit: '', dec: 0, vMin: 0, vMax: 40, color: C_4, seed: [8, 14, 11, 17, 21, 16, 12, 19, 24, 15, 12, 18], next: [26, 14] },
{ name: 'Reading', unit: 'min', dec: 1, vMin: 2, vMax: 12, color: C_LIFT, seed: [5.2, 6.0, 5.6, 6.8, 7.2, 6.4, 5.9, 6.6, 7.0, 7.4, 7.6, 8.4], next: [9.0, 6.9] }
];
var WIN = 12; // 시간 창 — 최근 12개
var LOOP = 2; // 한 사이클 2초 — 캡처 창과 같아 gif 가 이어진다
var SWAP_AT = [0.28, 0.55, 0.82]; // Value 교체 경계 — 루프 안에서 3번 창을 민다
var SWAP_DUR = 0.10; // 한 번 창을 미는 데 걸리는 구간(전체의 10%)
var STAG = 0.018; // 카드마다 어긋나는 시차
var reduce = window.matchMedia('(prefers-reduced-motion: reduce)').matches;
var W = 0, H = 0, dpr = 1;
var t0 = 0, raf = 0;
function fit() {
var r = field.getBoundingClientRect();
dpr = window.devicePixelRatio || 1;
W = r.width; H = r.height;
cv.width = Math.round(W * dpr);
cv.height = Math.round(H * dpr);
ctx.setTransform(dpr, 0, 0, dpr, 0, 0);
}
// 감속 이징 — 창 밀기가 시작에서 미끄러지듯 멈춘다
function easeOutCubic(t) { return 1 - Math.pow(1 - t, 3); }
// Value 표시 형식 — dec 0 은 정수, 1 은 소수 한 자리
function fmtV(card, v) {
return card.dec === 1 ? v.toFixed(1) : String(Math.round(v));
}
// 카드 i 의 루프 시각 p(0..1) 상태 — 몇 번 밀렸는지(shift)와 현재 밀기 진행(slide 0..1, 이즈 적용).
// shift=0(첫 등장~첫 교체 전) 은 창이 그대로 앉아 있으므로 slide=0.
function swapState(i, p) {
var shift = 0;
if (p >= SWAP_AT[1]) shift = 2;
else if (p >= SWAP_AT[0]) shift = 1;
if (shift === 0) return { shift: shift, slide: 0 };
var lastAt = SWAP_AT[shift - 1] + i * STAG;
var raw = Math.min(1, Math.max(0, (p - lastAt) / SWAP_DUR));
return { shift: shift, slide: easeOutCubic(raw) };
}
// 라운드 사각 경로 — 안쪽 미니 카드 반경 8(토큰 $r-sm 과 같은 눈금)
function roundRect(x, y, w, h, r) {
ctx.beginPath();
ctx.moveTo(x + r, y);
ctx.arcTo(x + w, y, x + w, y + h, r);
ctx.arcTo(x + w, y + h, x, y + h, r);
ctx.arcTo(x, y + h, x, y, r);
ctx.arcTo(x, y, x + w, y, r);
ctx.closePath();
}
// 카드 하나를 그린다 — 틀(라운드 사각 + 제목 + Value 숫자)·미니 라인·Pulse dot 전부 캔버스가 그린다
function drawCard(i, rect, p, appear) {
var card = CARDS[i];
var st = swapState(i, p);
var x = rect.x, y = rect.y, w = rect.w, h = rect.h;
var ay = y + (1 - appear) * 10; // 등장 — 아래에서 떠오른다
ctx.save();
ctx.globalAlpha = appear;
// 카드 틀 — 흰 카드에 옅은 테두리
roundRect(x, ay, w, h, 8);
ctx.fillStyle = C_CARD;
ctx.fill();
ctx.strokeStyle = C_EDGE;
ctx.lineWidth = 1;
ctx.stroke();
// 제목 — 왼쪽 위 작게
ctx.fillStyle = C_MUTE;
ctx.font = '700 9px ' + FONT;
ctx.textAlign = 'left';
ctx.textBaseline = 'alphabetic';
ctx.fillText(card.name, x + 9, ay + 14);
// Value 숫자 — 창이 밀리는 동안 이전 값에서 새 값으로 넘어간다(첫 등장은 시드 끝값 그대로)
var all = card.seed.concat(card.next);
var lastV = all[WIN - 1 + st.shift];
var prevV = st.shift === 0 ? lastV : all[WIN - 2 + st.shift];
var shownV = lastV + (prevV - lastV) * (1 - st.slide);
ctx.fillStyle = C_INK;
ctx.font = '700 13px ' + FONT;
ctx.textAlign = 'right';
ctx.fillText(fmtV(card, shownV) + (card.unit ? ' ' + card.unit : ''), x + w - 9, ay + 14);
// 미니 라인 영역 — 카드 하단부
var px = x + 8, pw = w - 16;
var py = ay + 20, ph = h - 28;
var slot = pw / (WIN - 1);
var slide = st.slide;
// 그릴 값열 — 밀기 전후 창을 겹친 13점(첫 등장 shift=0 은 시드 12점)
var from = Math.max(0, st.shift - 1);
var to = WIN - 1 + st.shift;
var pts = [];
for (var j = from; j <= to; j++) {
var m = j - from; // 그릴 열 안쪽 순번
var vx = px + slot * (m - slide); // slide=0 옛 창 정렬 → slide=1 새 창 정렬
var vy = py + ph * (1 - (all[j] - card.vMin) / (card.vMax - card.vMin));
pts.push({ x: vx, y: vy });
}
// 플롯 사각형 클립 — 새 점은 오른쪽에서 들어오고 밀려나는 점은 왼쪽에서 잘린다
ctx.save();
ctx.beginPath();
ctx.rect(px - 1, py - 3, pw + 2, ph + 6);
ctx.clip();
// 바닥 트랙 — 라인이 앉을 자리를 옅게 깐다
ctx.strokeStyle = C_TRACK;
ctx.lineWidth = 1;
ctx.beginPath();
ctx.moveTo(pts[0].x, pts[0].y);
for (var s = 1; s < pts.length; s++) ctx.lineTo(pts[s].x, pts[s].y);
ctx.stroke();
// 미니 라인 — 카드 계열색 3px
ctx.strokeStyle = card.color;
ctx.lineWidth = 3;
ctx.lineJoin = 'round';
ctx.lineCap = 'round';
ctx.beginPath();
ctx.moveTo(pts[0].x, pts[0].y);
for (var d = 1; d < pts.length; d++) ctx.lineTo(pts[d].x, pts[d].y);
ctx.stroke();
// Pulse dot — 마지막 점의 반지름이 진동한다. Value 도착 직후 강하게, 사이엔 잔 진동
var last = pts[pts.length - 1];
var phase = p * Math.PI * 2;
var beating = st.slide > 0 && st.slide < 1;
var beat = beating ? (1 - st.slide) : 0.25;
var pr = 2.2 + Math.abs(Math.sin(phase * 3)) * 2.4 * beat;
ctx.beginPath();
ctx.arc(last.x, last.y, pr, 0, Math.PI * 2);
ctx.fillStyle = card.color;
ctx.fill();
// 맥박 링 — Value 도착 순간 한 번 퍼진다
if (beating && st.slide < 0.7) {
var ring = st.slide / 0.7;
ctx.beginPath();
ctx.arc(last.x, last.y, pr + 8 * ring, 0, Math.PI * 2);
ctx.strokeStyle = card.color;
ctx.globalAlpha = 0.5 * (1 - ring) * appear;
ctx.lineWidth = 2;
ctx.stroke();
ctx.globalAlpha = appear;
}
ctx.restore(); // 플롯 클립 해제
ctx.restore(); // 카드 appear 알파 해제
}
function draw(p) {
ctx.clearRect(0, 0, W, H);
ctx.fillStyle = C_PAPER;
ctx.fillRect(0, 0, W, H);
// 카드 배치 — 넓을 때 2+3(두 줄), 좁으면 세로 1열
var gap = 8, m = 6;
var rects = [];
if (W >= 300) {
var w2 = (W - m * 2 - gap) / 2;
var w3 = (W - m * 2 - gap * 2) / 3;
var hRow = (H - m * 2 - gap) / 2;
rects.push({ x: m, y: m, w: w2, h: hRow });
rects.push({ x: m + w2 + gap, y: m, w: w2, h: hRow });
rects.push({ x: m, y: m + hRow + gap, w: w3, h: hRow });
rects.push({ x: m + w3 + gap, y: m + hRow + gap, w: w3, h: hRow });
rects.push({ x: m + (w3 + gap) * 2, y: m + hRow + gap, w: w3, h: hRow });
} else {
var w1 = W - m * 2;
var h1 = (H - m * 2 - gap * 4) / 5;
for (var v = 0; v < 5; v++) rects.push({ x: m, y: m + v * (h1 + gap), w: w1, h: h1 });
}
// 등장 — 카드가 왼쪽부터 시차로 뜬다(첫 20%)
for (var i = 0; i < CARDS.length; i++) {
var appear = easeOutCubic(Math.min(1, Math.max(0, (p - i * 0.04) / 0.16)));
drawCard(i, rects[i], p, appear);
}
}
function frame(now) {
if (!t0) t0 = now;
var p = ((now - t0) / 1000 % LOOP) / LOOP; // 0..1, 2초 루프
draw(p);
raf = requestAnimationFrame(frame);
}
replayBtn.addEventListener('click', function () { t0 = 0; });
window.addEventListener('resize', function () { fit(); if (reduce) draw(1); });
fit();
if (reduce) {
// reduce — 루프 없이 완성 상태(다섯 카드가 찬 창과 가만한 마지막 점) 한 장만 그린다
draw(1);
} else {
raf = requestAnimationFrame(frame);
}// SparklineStreamChart — vanilla 판(run/305/demo/07-chart-canvas-sparkline-stream/index.html) 의 React 포트.
// 카드 5장(틀도 캔버스가 그린다)이 2초 루프 안에서 값을 2번 받아 시간 창(최근 12개)을 밀고 다시 그린다.
// 움직임은 캔버스 rAF 루프가 전부 그리므로 @keyframes 가 없다 — props 는 CSS 변수로 내려간다.
import { useEffect, useRef } from "react";
import type { CSSProperties } from "react";
import styles from "./SparklineStreamChart.module.scss";
export type SparklineStreamChartProps = {
duration?: string;
easing?: string;
color?: string;
};
type Vars = CSSProperties & { "--duration"?: string; "--easing"?: string; "--color"?: string };
// useRef 는 T | null 을 돌려준다. 처음부터 값이 있고 절대 비지 않는 상자는 이렇게 좁혀 쓴다
type Box<T> = { current: T };
// 고정 시드 — 카드마다 다른 배열(12개)과 다음 값 2개. tone 은 계열 CSS 변수 키(1~4 + lift)
const CARDS = [
{ name: "방문자", unit: "", dec: 0, vMin: 40, vMax: 120, tone: "1", seed: [62, 71, 66, 78, 84, 91, 87, 95, 88, 96, 84, 91], next: [98, 76] },
{ name: "체류", unit: "분", dec: 1, vMin: 1, vMax: 8, tone: "3", seed: [4.1, 3.6, 3.9, 2.8, 3.1, 3.5, 3.0, 3.4, 2.9, 3.3, 3.2, 3.8], next: [4.2, 3.1] },
{ name: "주문", unit: "", dec: 0, vMin: 10, vMax: 90, tone: "2", seed: [58, 52, 61, 55, 49, 57, 63, 54, 47, 55, 46, 39], next: [52, 61] },
{ name: "쿠폰", unit: "", dec: 0, vMin: 0, vMax: 40, tone: "4", seed: [8, 14, 11, 17, 21, 16, 12, 19, 24, 15, 12, 18], next: [26, 14] },
{ name: "읽기", unit: "분", dec: 1, vMin: 2, vMax: 12, tone: "lift", seed: [5.2, 6.0, 5.6, 6.8, 7.2, 6.4, 5.9, 6.6, 7.0, 7.4, 7.6, 8.4], next: [9.0, 6.9] }
] as const;
const WIN = 12; // 시간 창 — 최근 12개
const LOOP = 2; // 한 사이클 2초
const SWAP_AT = [0.33, 0.66]; // 값 교체 경계 — 루프 안에서 2번 창을 민다
const SWAP_DUR = 0.10; // 한 번 창을 미는 데 걸리는 구간(전체의 10%)
const STAG = 0.018; // 카드마다 어긋나는 시차
const FONT = '-apple-system, "Segoe UI", "Noto Sans KR", sans-serif';
const FIELD_LABEL = "스파크라인 스트림 실험판";
const CV_LABEL = "다섯 지표 카드의 미니 스파크라인 — 최근 12개 값 창이 새 값으로 밀리며 마지막 점이 맥박친다";
export default function SparklineStreamChart({
duration = "2s", // vanilla $duration: $dur-loop
easing = "ease-out", // vanilla $easing: $ease-out
color = "#2f6df6", // vanilla $color: $chart-1
}: SparklineStreamChartProps) {
const rootRef = useRef<HTMLDivElement | null>(null);
const cvRef = useRef<HTMLCanvasElement | null>(null);
const ctxRef = useRef<CanvasRenderingContext2D | null>(null);
const sizeRef = useRef({ w: 0, h: 0 }) as Box<{ w: number; h: number }>;
const t0Ref = useRef(0) as Box<number>;
const rafRef = useRef(0) as Box<number>;
const vars: Vars = { "--duration": duration, "--easing": easing, "--color": color };
function reduced(): boolean {
return window.matchMedia("(prefers-reduced-motion: reduce)").matches;
}
function cssv(n: string): string {
const root = rootRef.current;
return root ? getComputedStyle(root).getPropertyValue(n).trim() : "";
}
// 고DPI — 배킹 스토어는 devicePixelRatio 배, 그리기 좌표계는 CSS 픽셀 그대로
function fit(): void {
const cv = cvRef.current;
const s = sizeRef.current;
if (!cv) return;
const r = cv.getBoundingClientRect();
const dpr = window.devicePixelRatio || 1;
s.w = r.width; s.h = r.height;
cv.width = Math.round(r.width * dpr);
cv.height = Math.round(r.height * dpr);
const ctx = ctxRef.current;
if (ctx) ctx.setTransform(dpr, 0, 0, dpr, 0, 0);
}
// 감속 이징 — 창 밀기가 시작에서 미끄러지듯 멈춘다
function easeOutCubic(t: number): number {
return 1 - Math.pow(1 - t, 3);
}
// 값 표시 형식 — dec 0 은 정수, 1 은 소수 한 자리
function fmtV(card: (typeof CARDS)[number], v: number): string {
return card.dec === 1 ? v.toFixed(1) : String(Math.round(v));
}
// 카드 i 의 루프 시각 p(0..1) 상태 — 몇 번 밀렸는지(shift)와 현재 밀기 진행(slide 0..1).
// shift=0(첫 등장~첫 교체 전) 은 창이 그대로 앉아 있으므로 slide=0.
function swapState(i: number, p: number): { shift: number; slide: number } {
let shift = 0;
if (p >= SWAP_AT[1]) shift = 2;
else if (p >= SWAP_AT[0]) shift = 1;
if (shift === 0) return { shift, slide: 0 };
const lastAt = SWAP_AT[shift - 1] + i * STAG;
const raw = Math.min(1, Math.max(0, (p - lastAt) / SWAP_DUR));
return { shift, slide: easeOutCubic(raw) };
}
// 라운드 사각 경로 — 안쪽 미니 카드 반경 8(토큰 $r-sm 과 같은 눈금)
function roundRect(ctx: CanvasRenderingContext2D, x: number, y: number, w: number, h: number, r: number): void {
ctx.beginPath();
ctx.moveTo(x + r, y);
ctx.arcTo(x + w, y, x + w, y + h, r);
ctx.arcTo(x + w, y + h, x, y + h, r);
ctx.arcTo(x, y + h, x, y, r);
ctx.arcTo(x, y, x + w, y, r);
ctx.closePath();
}
// 카드 하나를 그린다 — 틀·미니 라인·맥박 점 전부 캔버스가 그린다
function drawCard(i: number, rect: { x: number; y: number; w: number; h: number }, p: number, appear: number): void {
const ctx = ctxRef.current;
if (!ctx) return;
const card = CARDS[i];
const st = swapState(i, p);
const { x, y, w, h } = rect;
const ay = y + (1 - appear) * 10; // 등장 — 아래에서 떠오른다
const C_CARD = cssv("--card");
const C_EDGE = cssv("--edge");
const C_TRACK = cssv("--track");
const C_INK = cssv("--ink");
const C_MUTE = cssv("--mute");
const toneKey = card.tone === "lift" ? "--chart-2-lift" : ("--chart-" + card.tone);
const C_SERIES = cssv(toneKey) || color;
ctx.save();
ctx.globalAlpha = appear;
// 카드 틀 — 흰 카드에 옅은 테두리
roundRect(ctx, x, ay, w, h, 8);
ctx.fillStyle = C_CARD;
ctx.fill();
ctx.strokeStyle = C_EDGE;
ctx.lineWidth = 1;
ctx.stroke();
// 제목 — 왼쪽 위 작게
ctx.fillStyle = C_MUTE;
ctx.font = "700 9px " + FONT;
ctx.textAlign = "left";
ctx.textBaseline = "alphabetic";
ctx.fillText(card.name, x + 9, ay + 14);
// 값 숫자 — 창이 밀리는 동안 이전 값에서 새 값으로 넘어간다(첫 등장은 시드 끝값 그대로)
const all = (card.seed as readonly number[]).concat(card.next as readonly number[]);
const lastV = all[WIN - 1 + st.shift];
const prevV = st.shift === 0 ? lastV : all[WIN - 2 + st.shift];
const shownV = lastV + (prevV - lastV) * (1 - st.slide);
ctx.fillStyle = C_INK;
ctx.font = "700 13px " + FONT;
ctx.textAlign = "right";
ctx.fillText(fmtV(card, shownV) + (card.unit ? " " + card.unit : ""), x + w - 9, ay + 14);
// 미니 라인 영역 — 카드 하단부
const px = x + 8, pw = w - 16;
const py = ay + 20, ph = h - 28;
const slot = pw / (WIN - 1);
const slide = st.slide;
// 그릴 값열 — 밀기 전후 창을 겹친 점들(첫 등장 shift=0 은 시드 12점)
const from = Math.max(0, st.shift - 1);
const to = WIN - 1 + st.shift;
const pts: { x: number; y: number }[] = [];
for (let j = from; j <= to; j++) {
const m = j - from; // 그릴 열 안쪽 순번
const vx = px + slot * (m - slide); // slide=0 옛 창 정렬 → slide=1 새 창 정렬
const vy = py + ph * (1 - (all[j] - card.vMin) / (card.vMax - card.vMin));
pts.push({ x: vx, y: vy });
}
// 플롯 사각형 클립 — 새 점은 오른쪽에서 들어오고 밀려나는 점은 왼쪽에서 잘린다
ctx.save();
ctx.beginPath();
ctx.rect(px - 1, py - 3, pw + 2, ph + 6);
ctx.clip();
// 바닥 트랙 — 라인이 앉을 자리를 옅게 깐다
ctx.strokeStyle = C_TRACK;
ctx.lineWidth = 1;
ctx.beginPath();
ctx.moveTo(pts[0].x, pts[0].y);
for (let s = 1; s < pts.length; s++) ctx.lineTo(pts[s].x, pts[s].y);
ctx.stroke();
// 미니 라인 — 카드 계열색 2px
ctx.strokeStyle = C_SERIES;
ctx.lineWidth = 2;
ctx.lineJoin = "round";
ctx.lineCap = "round";
ctx.beginPath();
ctx.moveTo(pts[0].x, pts[0].y);
for (let d = 1; d < pts.length; d++) ctx.lineTo(pts[d].x, pts[d].y);
ctx.stroke();
// 맥박 점 — 마지막 점의 반지름이 진동한다. 값 도착 직후 강하게, 사이엔 잔 진동
const last = pts[pts.length - 1];
const phase = p * Math.PI * 2;
const beating = st.slide > 0 && st.slide < 1;
const beat = beating ? 1 - st.slide : 0.25;
const pr = 2.2 + Math.abs(Math.sin(phase * 3)) * 2.4 * beat;
ctx.beginPath();
ctx.arc(last.x, last.y, pr, 0, Math.PI * 2);
ctx.fillStyle = C_SERIES;
ctx.fill();
// 맥박 링 — 값 도착 순간 한 번 퍼진다
if (beating && st.slide < 0.7) {
const ring = st.slide / 0.7;
ctx.beginPath();
ctx.arc(last.x, last.y, pr + 8 * ring, 0, Math.PI * 2);
ctx.strokeStyle = C_SERIES;
ctx.globalAlpha = 0.5 * (1 - ring) * appear;
ctx.lineWidth = 2;
ctx.stroke();
ctx.globalAlpha = appear;
}
ctx.restore(); // 플롯 클립 해제
ctx.restore(); // 카드 appear 알파 해제
}
function draw(p: number): void {
const ctx = ctxRef.current;
if (!ctx) return;
const W = sizeRef.current.w, H = sizeRef.current.h;
const C_PAPER = cssv("--paper");
ctx.clearRect(0, 0, W, H);
ctx.fillStyle = C_PAPER;
ctx.fillRect(0, 0, W, H);
// 카드 배치 — 넓을 때 2+3(두 줄), 좁으면 세로 1열
const gap = 8, m = 6;
const rects: { x: number; y: number; w: number; h: number }[] = [];
if (W >= 300) {
const w2 = (W - m * 2 - gap) / 2;
const w3 = (W - m * 2 - gap * 2) / 3;
const hRow = (H - m * 2 - gap) / 2;
rects.push({ x: m, y: m, w: w2, h: hRow });
rects.push({ x: m + w2 + gap, y: m, w: w2, h: hRow });
rects.push({ x: m, y: m + hRow + gap, w: w3, h: hRow });
rects.push({ x: m + w3 + gap, y: m + hRow + gap, w: w3, h: hRow });
rects.push({ x: m + (w3 + gap) * 2, y: m + hRow + gap, w: w3, h: hRow });
} else {
const w1 = W - m * 2;
const h1 = (H - m * 2 - gap * 4) / 5;
for (let v = 0; v < 5; v++) rects.push({ x: m, y: m + v * (h1 + gap), w: w1, h: h1 });
}
// 등장 — 카드가 왼쪽부터 시차로 뜬다(첫 20%)
for (let i = 0; i < CARDS.length; i++) {
const appear = easeOutCubic(Math.min(1, Math.max(0, (p - i * 0.04) / 0.16)));
drawCard(i, rects[i], p, appear);
}
}
function frame(now: number): void {
if (!t0Ref.current) t0Ref.current = now;
const p = ((now - t0Ref.current) / 1000 % LOOP) / LOOP;
draw(p);
rafRef.current = requestAnimationFrame(frame);
}
function replay(): void {
t0Ref.current = 0;
}
function onResize(): void {
fit();
if (reduced()) draw(1);
}
useEffect(() => {
const cv = cvRef.current;
if (!cv) return;
ctxRef.current = cv.getContext("2d");
if (!ctxRef.current) return;
fit();
window.addEventListener("resize", onResize);
if (reduced()) {
// reduce — 루프 없이 완성 상태(다섯 카드가 찬 창과 가만한 마지막 점) 한 장만 그린다
draw(1);
} else {
rafRef.current = requestAnimationFrame(frame);
}
return () => {
window.removeEventListener("resize", onResize);
cancelAnimationFrame(rafRef.current);
};
}, []);
return (
<main className={styles.stage}>
<div className={styles.root} ref={rootRef} style={vars}>
<p className={styles.hint}>
<svg className={styles.ico} viewBox="0 0 256 256" aria-hidden="true"><g fill="currentColor"><path d="M107.14 98.8L128 128l-20.86 29.2A64 64 0 0 1 55.06 184H32V72h23.06a64 64 0 0 1 52.08 26.8m93.8-26.8a64 64 0 0 0-52.08 26.8L128 128l20.86 29.2a64 64 0 0 0 52.08 26.8H232V72Z" opacity=".2"/><path d="M237.66 178.34a8 8 0 0 1 0 11.32l-24 24a8 8 0 0 1-11.32-11.32L212.69 192h-11.75a72.12 72.12 0 0 1-58.59-30.15l-41.72-58.4A56.1 56.1 0 0 0 55.06 80H32a8 8 0 0 1 0-16h23.06a72.12 72.12 0 0 1 58.59 30.15l41.72 58.4A56.1 56.1 0 0 0 200.94 176h11.75l-10.35-10.34a8 8 0 0 1 11.32-11.32ZM143 107a8 8 0 0 0 11.16-1.86l1.2-1.67A56.1 56.1 0 0 1 200.94 80h11.75l-10.35 10.34a8 8 0 0 0 11.32 11.32l24-24a8 8 0 0 0 0-11.32l-24-24a8 8 0 0 0-11.32 11.32L212.69 64h-11.75a72.12 72.12 0 0 0-58.59 30.15l-1.2 1.67A8 8 0 0 0 143 107"/></g></svg>
<span>다섯 지표 카드가 새 값을 받아 창을 밀며 다시 그려집니다 — <code>shift</code>·<code>clip</code>·<code>맥박 점</code></span>
</p>
<div className={styles.field} role="application" aria-label={FIELD_LABEL} tabIndex={0}>
<canvas className={styles.cv} ref={cvRef} role="img" aria-label={CV_LABEL}></canvas>
</div>
<div className={styles.bar}>
<button className={styles.btn} type="button" onClick={replay}>
<svg className={styles.bico} viewBox="0 0 256 256" aria-hidden="true"><g fill="currentColor"><path d="M216 128a88 88 0 1 1-88-88a88 88 0 0 1 88 88" opacity=".2"/><path d="M224 128a96 96 0 0 1-94.71 96H128a95.38 95.38 0 0 1-65.9-26.2a8 8 0 0 1 11-11.63a80 80 0 1 0-1.67-114.78a3 3 0 0 1-.26.25L44.59 96H72a8 8 0 0 1 0 16H24a8 8 0 0 1-8-8V56a8 8 0 0 1 16 0v29.8L60.25 60A96 96 0 0 1 224 128"/></g></svg>
<span>다시 그리기</span>
</button>
<table className={styles.srOnly}>
<caption>다섯 지표 최근 12개 값 창(방금 받은 값 포함)</caption>
<thead><tr><th scope="col">지표</th><th scope="col">방금 받은 값</th></tr></thead>
<tbody>
<tr><th scope="row">방문자</th><td>91</td></tr>
<tr><th scope="row">체류(분)</th><td>3.8</td></tr>
<tr><th scope="row">주문</th><td>39</td></tr>
<tr><th scope="row">쿠폰</th><td>18</td></tr>
<tr><th scope="row">읽기(분)</th><td>8.4</td></tr>
</tbody>
</table>
</div>
</div>
</main>
);
}07 Sparkline stream — Measured area 11.706% · moving frames 23/23Original by GODRICH · SCSS and React ship in the zip · JavaScript Chart Drawing, 9 Ways — No Library
The post this demo lives in
 JavaScript Chart Drawing, 9 Ways — No LibraryA javascript chart is a data array turned into x·y coordinates painted onto a canvas as lines, bars, and arcs. These nin See all demos in this post