06Sparkline living inside a KPI card
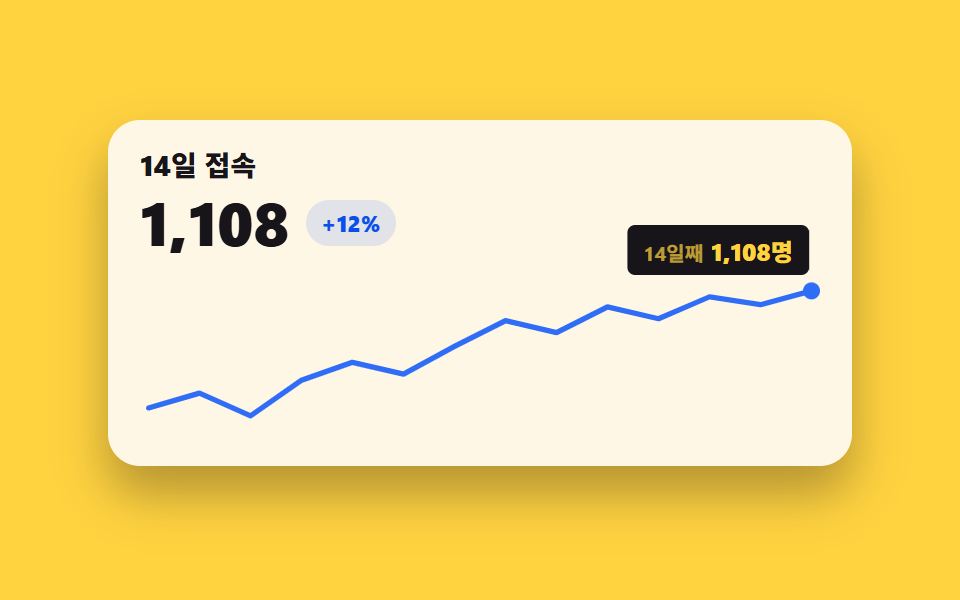
A 14-day trend becomes a short path inside the card, and the last point marks it in rise-or-fall color
Best forMini trend inside a KPI card, a secondary metric in list rows
pathLengthstroke-dasharrayr
<main class="stage">
<div class="cs is-demo" id="cs">
  <div class="cs__card">
    <div class="cs__head">
      <p class="cs__title">14-Day Visits</p>
      <div class="cs__row">
        <!-- 큰 숫자 두 장 — 미리보기에서 반값과 최종값을 steps 컷으로 바꾼다. 실사용은 최종값만 -->
        <div class="cs__numWrap">
          <span class="cs__num cs__num--half">554</span>
          <span class="cs__num cs__num--full">1,108</span>
        </div>
        <span class="cs__chip">+12%</span>
      </div>
    </div>
    <div class="cs__plot" id="plot">
      <svg class="cs__svg" id="chart" viewBox="0 0 320 88" role="img" aria-label="14-day visit sparkline, rising to 1,108 on the last day">
        <!-- 스파크라인 라인. pathLength=100 이라 dashoffset 애니메이션이 길이와 무관하게 0~100으로 돈다 -->
        <path class="cs__line" id="line" pathLength="100" d=""></path>
        <!-- 종가  pts — 실사용(정적)에서는 항상 보인다 -->
        <circle class="cs__dot" id="endDot" r="4" cx="0" cy="0"></circle>
      </svg>
      <!-- 툴팁 — plot 안에서 절대 배치, 가까운  pts 위에 뜬다 -->
      <div class="cs__tip" id="tip" aria-hidden="true"><span class="cs__tipDay" id="tipDay">Day 14</span><strong class="cs__tipVal" id="tipVal">1,108 visits</strong></div>
      <!-- 스크린리더용 데이터 표 — 화면에 안 보인다 -->
      <table class="cs__sr">
        <caption>14-Day Visits</caption>
        <thead><tr><th>Day</th><th>Visits (people)</th></tr></thead>
        <tbody id="srBody"></tbody>
      </table>
    </div>
  </div>
</div>
</main>@use "../../../../site/static/demo-tokens" as *;
// KPI 카드 안 스파크라인 — 실제 사용에선 JS 가 buildPath() 로 라인을 심어 완성된
// 그래프와 종가 점이 곧 뜨고 pointermove 로 가까운 점의 툴팁이 따라온다.
// 미리보기(.is-demo)는 같은 path 에 stroke-dashoffset 키프레임을 얹어 짧게 그려지는
// 라인 — 종가 점 팝 — 증감 칩과 헤더 숫자의 steps 컷 교체를 2초 루프로 보여 준다.
$duration: $dur-loop;
$easing: $ease-out;
@include stage($stage-yellow);
.cs { display: flex; justify-content: center; width: 100%; padding-bottom: $sp-2; }
.cs__card {
width: min(100%, 340px); background: $subject-cream; border-radius: $r-card;
box-shadow: $shadow-raised; padding: $sp-3 $sp-4 $sp-2;
}
.cs__title { margin: 0 0 $sp-1; font-weight: 800; font-size: clamp(12px, 3vw, 14px); color: $subject-ink; }
.cs__row { display: flex; align-items: baseline; gap: $sp-2; margin-bottom: $sp-1; }
// 큰 숫자 두 장을 같은 칸에 겹친다 — 컷 교체라 폭이 달라도 자리는 흔들리지 않는다
.cs__numWrap { display: grid; }
.cs__num {
grid-area: 1 / 1; font-weight: 800; font-size: clamp(24px, 7vw, 30px); line-height: 1.05;
color: $subject-ink; font-variant-numeric: tabular-nums;
}
// 증감 칩 — 상승 계열색. 텍스트가 곧 상태를 읽으므로 색만으로 의존하지 않는다
.cs__chip {
align-self: center; font-weight: 800; font-size: clamp(10px, 2.6vw, 11px); color: $subject-blue-deep; // 연회색 면 위 $chart-1 은 3.53:1 — deep 4.97:1
background: rgba(47, 109, 246, .14); border-radius: $r-pill; padding: $sp-1 $sp-2;
}
.cs__plot { position: relative; }
.cs__svg { display: block; width: 100%; height: auto; touch-action: none; cursor: crosshair; }
.cs__line {
fill: none; stroke: $chart-1; stroke-width: 2.5; stroke-linecap: round; stroke-linejoin: round;
}
// 종가 점 — 상승 추세라 라인과 같은 계열색. 팝은 점 중심에서 커진다
.cs__dot { fill: $chart-1; transform-box: fill-box; transform-origin: center; }
// 툴팁 — 절대 배치라 루트에 padding-bottom 이 있어야 높이가 무대를 넘기지 않는다
.cs__tip {
position: absolute; transform: translate(-50%, -130%);
display: flex; align-items: baseline; gap: $sp-1; pointer-events: none;
background: $subject-ink; color: $stage-yellow; border-radius: $r-xs;
padding: $sp-1 $sp-2; font-weight: 700; font-size: 10px; white-space: nowrap;
opacity: 0;
}
.cs__tip.is-on { opacity: 1; transition: opacity $dur-quick $ease-out; }
.cs__tipDay { opacity: .72; }
.cs__tipVal { font-size: 12px; }
// 스크린리더용 표 — absolute+clip 은 레이아웃 크기가 그대로 scrollHeight 에 잡혀 넘침(BD8)이 뜨므로
// fixed 로 캔버스 밖에 둔다. 스크린리더는 그대로 읽는다
.cs__sr {
position: fixed; top: 0; left: -640px; width: 320px; margin: 0;
}
// 실사용(정적)에서는 최종 숫자만 — 카운트업 없이 곧바로 완성 상태
.cs:not(.is-demo) .cs__num--half { display: none; }
// ── 미리보기 루프: 0~4% 빈 칸 → 6~40% 라인이 짧게 그어진다 → 22% 헤더 숫자가 최종값으로
// 컷 교체되고 26% 증감 칩이 따라 나선다(카드의 주인공 숫자가 먼저 확정된다) →
// 42~54% 종가 점이 중심에서 팝 → 56% 툴팁 컷 → 58~96% 완성 상태로 머문다.
// 되돌림은 98% — 24프레임의 마지막 장이 2초의 95.8% 지점이라 그 뒤는 샘플이 없다.
// 루프 안에서 지우면 "다 사라지는 장" 이 최대 변화가 돼 poster 가 빈 카드로 뽑힌다
// (실측 2026-09-12: 95.8% 프레임이 3.078% 로 1위였다. 255-03 "퇴장을 재현하지 않는다" 와 같은 계열).
.cs.is-demo .cs__line { stroke-dasharray: 100; }
.cs.is-demo .cs__line {
animation-name: csLine;
animation-duration: $duration;
animation-timing-function: $easing;
animation-iteration-count: infinite;
}
@keyframes csLine {
0%, 4% { stroke-dashoffset: 100; }
40%, 96% { stroke-dashoffset: 0; }
98%, 100% { stroke-dashoffset: 100; }
}
// 종가 점 팝 — 라인이 다 그어진 뒤(40%) 점 중심에서 팝. 98% 에 컷으로 사라진다
.cs.is-demo .cs__dot {
animation-name: csDot;
animation-duration: $duration;
animation-timing-function: $ease-pop;
animation-iteration-count: infinite;
}
@keyframes csDot {
0%, 40% { transform: scale(0); }
54%, 96% { transform: scale(1); }
98%, 100% { transform: scale(0); }
}
// 헤더 숫자 컷 교체 — 카드의 주인공 숫자가 먼저 최종값으로 확정되고(22%) 칩이 뒤따르며(26%)
// 라인이 그려진다(40% 완성). KPI 카드는 숫자가 먼저 읽혀야 한다 (steps 컷, 반투명 크로스페이드 아님)
.cs.is-demo .cs__num--half,
.cs.is-demo .cs__num--full {
animation-duration: $duration;
animation-timing-function: steps(1, end);
animation-iteration-count: infinite;
}
.cs.is-demo .cs__num--half { animation-name: csNumHalf; }
@keyframes csNumHalf {
0%, 20% { opacity: 1; }
22%, 96% { opacity: 0; }
98%, 100% { opacity: 1; }
}
.cs.is-demo .cs__num--full { animation-name: csNumFull; }
@keyframes csNumFull {
0%, 20% { opacity: 0; }
22%, 96% { opacity: 1; }
98%, 100% { opacity: 0; }
}
// 증감 칩과 미리보기 툴팁(종가 위에 JS 가 미리 세팅)은 숫자 뒤를 따라 컷 등장
.cs.is-demo .cs__chip,
.cs.is-demo .cs__tip {
animation-duration: $duration;
animation-timing-function: steps(1, end);
animation-iteration-count: infinite;
}
.cs.is-demo .cs__chip { animation-name: csChip; }
@keyframes csChip {
0%, 24% { opacity: 0; }
26%, 96% { opacity: 1; }
98%, 100% { opacity: 0; }
}
.cs.is-demo .cs__tip { animation-name: csTip; }
@keyframes csTip {
0%, 54% { opacity: 0; }
56%, 96% { opacity: 1; }
98%, 100% { opacity: 0; }
}
@media (max-width: 340px) {
.cs__card { padding: $sp-2 $sp-3 $sp-1; }
}
@media (prefers-reduced-motion: reduce) {
.cs.is-demo .cs__line,
.cs.is-demo .cs__dot,
.cs.is-demo .cs__num--half,
.cs.is-demo .cs__num--full,
.cs.is-demo .cs__chip,
.cs.is-demo .cs__tip { animation: none !important; }
// 움직임 없이 다 그어진 최종 상태로 점프한다
.cs.is-demo .cs__line { stroke-dashoffset: 0 !important; }
.cs.is-demo .cs__dot { transform: scale(1) !important; }
.cs.is-demo .cs__num--half { opacity: 0 !important; }
.cs.is-demo .cs__num--full,
.cs.is-demo .cs__chip,
.cs.is-demo .cs__tip { opacity: 1 !important; }
}html, body {
margin: 0;
overflow: hidden;
}
.stage {
box-sizing: border-box;
min-height: 100vh;
display: grid;
place-items: center;
margin: 0;
background: #ffd23f;
font-family: -apple-system, "Segoe UI", "Noto Sans KR", sans-serif;
padding: clamp(8px, 4vw, 24px);
}
.cs {
display: flex;
justify-content: center;
width: 100%;
padding-bottom: 8px;
}
.cs__card {
width: min(100%, 340px);
background: #fff7e6;
border-radius: 16px;
box-shadow: 0 14px 24px rgba(23, 20, 26, 0.32);
padding: 12px 16px 8px;
}
.cs__title {
margin: 0 0 4px;
font-weight: 800;
font-size: clamp(12px, 3vw, 14px);
color: #17141a;
}
.cs__row {
display: flex;
align-items: baseline;
gap: 8px;
margin-bottom: 4px;
}
.cs__numWrap {
display: grid;
}
.cs__num {
grid-area: 1/1;
font-weight: 800;
font-size: clamp(24px, 7vw, 30px);
line-height: 1.05;
color: #17141a;
font-variant-numeric: tabular-nums;
}
.cs__chip {
align-self: center;
font-weight: 800;
font-size: clamp(10px, 2.6vw, 11px);
color: #0a4fe8;
background: rgba(47, 109, 246, 0.14);
border-radius: 999px;
padding: 4px 8px;
}
.cs__plot {
position: relative;
}
.cs__svg {
display: block;
width: 100%;
height: auto;
touch-action: none;
cursor: crosshair;
}
.cs__line {
fill: none;
stroke: #2f6df6;
stroke-width: 2.5;
stroke-linecap: round;
stroke-linejoin: round;
}
.cs__dot {
fill: #2f6df6;
transform-box: fill-box;
transform-origin: center;
}
.cs__tip {
position: absolute;
transform: translate(-50%, -130%);
display: flex;
align-items: baseline;
gap: 4px;
pointer-events: none;
background: #17141a;
color: #ffd23f;
border-radius: 4px;
padding: 4px 8px;
font-weight: 700;
font-size: 10px;
white-space: nowrap;
opacity: 0;
}
.cs__tip.is-on {
opacity: 1;
transition: opacity 220ms ease-out;
}
.cs__tipDay {
opacity: 0.72;
}
.cs__tipVal {
font-size: 12px;
}
.cs__sr {
position: fixed;
top: 0;
left: -640px;
width: 320px;
margin: 0;
}
.cs:not(.is-demo) .cs__num--half {
display: none;
}
.cs.is-demo .cs__line {
stroke-dasharray: 100;
}
.cs.is-demo .cs__line {
animation-name: csLine;
animation-duration: 2s;
animation-timing-function: ease-out;
animation-iteration-count: infinite;
}
@keyframes csLine {
0%, 4% {
stroke-dashoffset: 100;
}
40%, 96% {
stroke-dashoffset: 0;
}
98%, 100% {
stroke-dashoffset: 100;
}
}
.cs.is-demo .cs__dot {
animation-name: csDot;
animation-duration: 2s;
animation-timing-function: cubic-bezier(0.2, 1.4, 0.4, 1);
animation-iteration-count: infinite;
}
@keyframes csDot {
0%, 40% {
transform: scale(0);
}
54%, 96% {
transform: scale(1);
}
98%, 100% {
transform: scale(0);
}
}
.cs.is-demo .cs__num--half,
.cs.is-demo .cs__num--full {
animation-duration: 2s;
animation-timing-function: steps(1, end);
animation-iteration-count: infinite;
}
.cs.is-demo .cs__num--half {
animation-name: csNumHalf;
}
@keyframes csNumHalf {
0%, 20% {
opacity: 1;
}
22%, 96% {
opacity: 0;
}
98%, 100% {
opacity: 1;
}
}
.cs.is-demo .cs__num--full {
animation-name: csNumFull;
}
@keyframes csNumFull {
0%, 20% {
opacity: 0;
}
22%, 96% {
opacity: 1;
}
98%, 100% {
opacity: 0;
}
}
.cs.is-demo .cs__chip,
.cs.is-demo .cs__tip {
animation-duration: 2s;
animation-timing-function: steps(1, end);
animation-iteration-count: infinite;
}
.cs.is-demo .cs__chip {
animation-name: csChip;
}
@keyframes csChip {
0%, 24% {
opacity: 0;
}
26%, 96% {
opacity: 1;
}
98%, 100% {
opacity: 0;
}
}
.cs.is-demo .cs__tip {
animation-name: csTip;
}
@keyframes csTip {
0%, 54% {
opacity: 0;
}
56%, 96% {
opacity: 1;
}
98%, 100% {
opacity: 0;
}
}
@media (max-width: 340px) {
.cs__card {
padding: 8px 12px 4px;
}
}
@media (prefers-reduced-motion: reduce) {
.cs.is-demo .cs__line,
.cs.is-demo .cs__dot,
.cs.is-demo .cs__num--half,
.cs.is-demo .cs__num--full,
.cs.is-demo .cs__chip,
.cs.is-demo .cs__tip {
animation: none !important;
}
.cs.is-demo .cs__line {
stroke-dashoffset: 0 !important;
}
.cs.is-demo .cs__dot {
transform: scale(1) !important;
}
.cs.is-demo .cs__num--half {
opacity: 0 !important;
}
.cs.is-demo .cs__num--full,
.cs.is-demo .cs__chip,
.cs.is-demo .cs__tip {
opacity: 1 !important;
}
}var DATA = [990, 1005, 982, 1018, 1036, 1024, 1052, 1078, 1066, 1092, 1080, 1102, 1094, 1108];
var NTH_LABEL = 'Day {n}'; // 표의 행 머리 — 언어마다 숫자 자리가 다르다 (en 은 Day 1)
var DAY_LABEL = 'Day {n}'; // 툴팁의 날짜
var VW = 320, VH = 88; // viewBox 크기
var PAD_L = 4, PAD_R = 316, TOP = 8, BASE = 78;
var MIN = 970, MAX = 1120; // y 스케일 하한·상한 — 값 범위보다 넉넉히
var cs = document.getElementById('cs');
var svg = document.getElementById('chart');
var line = document.getElementById('line');
var endDot = document.getElementById('endDot');
var tip = document.getElementById('tip');
var tipDay = document.getElementById('tipDay');
var tipVal = document.getElementById('tipVal');
// 스케일 함수 — 데이터 값 → viewBox 좌표
function scaleX(i) { return PAD_L + (PAD_R - PAD_L) * i / (DATA.length - 1); }
function scaleY(v) { return BASE - (BASE - TOP) * (v - MIN) / (MAX - MIN); }
// 스파크라인은 꺾은선 그대로 — 부드러운 곡선보다 추세의 생김새가 먼저 읽힌다
function buildPath() {
return DATA.map(function (v, i) {
return (i ? 'L' : 'M') + scaleX(i).toFixed(1) + ',' + scaleY(v).toFixed(1);
}).join(' ');
}
line.setAttribute('d', buildPath());
// 종가 pts — Day 14 값
var last = DATA.length - 1;
endDot.setAttribute('cx', scaleX(last).toFixed(1));
endDot.setAttribute('cy', scaleY(DATA[last]).toFixed(1));
// 스크린리더용 표 채우기
var srBody = document.getElementById('srBody');
DATA.forEach(function (v, i) {
var tr = document.createElement('tr');
var th = document.createElement('th'); th.setAttribute('scope', 'row'); th.textContent = NTH_LABEL.replace('{n}', i + 1);
var td = document.createElement('td'); td.textContent = v;
tr.appendChild(th); tr.appendChild(td); srBody.appendChild(tr);
});
// 툴팁을 i번 pts 위에 놓는다 — viewBox 좌표를 plot 비율로 바꿔 % 로.
// 오른쪽 끝 점에서 툴팁이 카드 밖으로 나가지 않게 left 는 85% 로 상한
function placeTip(i) {
tip.style.left = Math.min(scaleX(i) / VW * 100, 85) + '%';
tip.style.top = (scaleY(DATA[i]) / VH * 100) + '%';
tipDay.textContent = DAY_LABEL.replace('{n}', i + 1);
tipVal.textContent = DATA[i].toLocaleString() + ' visits';
}
placeTip(last); // 미리보기 툴팁은 종가 위에 떠 있다
// 사람이 조작하면 미리보기 루프를 끄고 가까운 점의 툴팁이 따라온다
svg.addEventListener('pointermove', function (e) {
if (cs.classList.contains('is-demo')) { cs.classList.remove('is-demo'); }
var r = svg.getBoundingClientRect();
var vx = (e.clientX - r.left) / r.width * VW; // 화면 좌표 → viewBox 좌표
var i = Math.round((vx - PAD_L) / ((PAD_R - PAD_L) / last));
i = Math.max(0, Math.min(last, i));
placeTip(i);
tip.classList.add('is-on');
});
svg.addEventListener('pointerleave', function () {
tip.classList.remove('is-on');
placeTip(last); // 종가로 돌아간다
});// ChartSparklineDot — vanilla 판(run/289/demo/06-chart-draw-sparkline-dot/index.html) 의 React 포트.
// KPI 카드 안 스파크라인 — 14일 접속 수 라인과 종가 점. 사람이 포인터를 올리면
// 미리보기 루프가 떨어지고 가까운 점의 툴팁이 따라온다.
import { useRef, useState } from "react";
import styles from "./ChartSparklineDot.module.scss";
export type ChartSparklineDotProps = {
/** 격자 미리보기용 2초 자동 루프. 사람이 포인터를 올리면 꺼진다 */
demo?: boolean;
};
type PtrEvt = { clientX: number };
type Box<T> = { current: T | null };
const DATA = [990, 1005, 982, 1018, 1036, 1024, 1052, 1078, 1066, 1092, 1080, 1102, 1094, 1108];
const VW = 320, VH = 88;
const PAD_L = 4, PAD_R = 316, TOP = 8, BASE = 78;
const MIN = 970, MAX = 1120;
const LAST = DATA.length - 1;
const NTH_LABEL = "{n}일차"; // 표의 행 머리 — 언어마다 숫자 자리가 다르다 (en 은 Day 1)
const DAY_LABEL = "{n}일째"; // 툴팁의 날짜
/** 스케일 함수 — 데이터 값 → viewBox 좌표 */
const scaleX = (i: number) => PAD_L + (PAD_R - PAD_L) * i / LAST;
const scaleY = (v: number) => BASE - (BASE - TOP) * (v - MIN) / (MAX - MIN);
/** 스파크라인은 꺾은선 그대로 — 부드러운 곡선보다 추세의 생김새가 먼저 읽힌다 */
function buildPath() {
return DATA.map((v, i) => `${i ? "L" : "M"}${scaleX(i).toFixed(1)},${scaleY(v).toFixed(1)}`).join(" ");
}
const PATH_D = buildPath();
export default function ChartSparklineDot({ demo = true }: ChartSparklineDotProps) {
const svgRef: Box<SVGSVGElement> = useRef(null);
const [live, setLive] = useState(!demo);
const [hover, setHover] = useState(LAST);
/** pointermove — 화면 좌표를 viewBox 좌표로 바꿔 가장 가까운 점을 고른다 */
function onMove(e: PtrEvt) {
const svg = svgRef.current;
if (!svg) return;
setLive(true); // live 를 켜야 .isDemo 루프가 떨어진다 (live=false 가 미리보기 상태다)
const r = svg.getBoundingClientRect();
const vx = (e.clientX - r.left) / r.width * VW;
setHover(Math.max(0, Math.min(LAST, Math.round((vx - PAD_L) / ((PAD_R - PAD_L) / LAST)))));
}
const rootCls = [styles.root, live ? "" : styles.isDemo].filter(Boolean).join(" ");
return (
<div className={rootCls}>
<div className={styles.card}>
<div className={styles.head}>
<p className={styles.title}>14일 접속</p>
<div className={styles.row}>
{/* 큰 숫자 두 장 — 미리보기에서 반값과 최종값을 steps 컷으로 바꾼다. 실사용은 최종값만 */}
<div className={styles.numWrap}>
<span className={`${styles.num} ${styles.numHalf}`}>{Math.round(DATA[LAST] / 2)}</span>
<span className={`${styles.num} ${styles.numFull}`}>{DATA[LAST].toLocaleString()}</span>
</div>
<span className={styles.chipCls}>+12%</span>
</div>
</div>
<div className={styles.plot}>
<svg
className={styles.svg} ref={svgRef} viewBox={`0 0 ${VW} ${VH}`} role="img"
aria-label="14일 접속 수 스파크라인, 마지막 날 1108명으로 상승"
onPointerMove={onMove}
onPointerLeave={() => setHover(LAST)}
>
{/* pathLength=100 이라 dashoffset 애니메이션이 길이와 무관하게 0~100 으로 돈다 */}
<path className={styles.line} pathLength={100} d={PATH_D} />
{/* 종가 점 — 실사용(정적)에서는 항상 보인다 */}
<circle className={styles.dot} r={4} cx={scaleX(LAST).toFixed(1)} cy={scaleY(DATA[LAST]).toFixed(1)} />
</svg>
{/* 툴팁 — 가까운 점 위에 뜬다 (viewBox 좌표를 plot 비율 % 로, 끝 점은 85% 상한) */}
<div
className={[styles.tip, live ? styles.tipIsOn : ""].filter(Boolean).join(" ")}
aria-hidden="true"
style={{
left: `${Math.min(scaleX(hover) / VW * 100, 85).toFixed(2)}%`,
top: `${(scaleY(DATA[hover]) / VH * 100).toFixed(2)}%`,
}}
>
<span className={styles.tipDay}>{DAY_LABEL.replace("{n}", String(hover + 1))}</span>
<strong className={styles.tipVal}>{DATA[hover].toLocaleString()}명</strong>
</div>
{/* 스크린리더용 데이터 표 — 화면에 안 보인다 */}
<table className={styles.sr}>
<caption>14일 접속</caption>
<thead><tr><th scope="col">일차</th><th scope="col">접속 수 (명)</th></tr></thead>
<tbody>
{DATA.map((v, i) => (
<tr key={i}><th scope="row">{NTH_LABEL.replace("{n}", String(i + 1))}</th><td>{v}</td></tr>
))}
</tbody>
</table>
</div>
</div>
</div>
);
}06 Sparkline living inside a KPI card — Measured area 3.914% · moving frames 14/23Original by GODRICH · SCSS and React ship in the zip · CSS Chart Design: 9 SVG Graphs, No Library
The post this demo lives in
 CSS Chart Design: 9 SVG Graphs, No LibraryCSS chart design turns numbers into lines, bars, and areas with no library. These nine use only SVG coordinate math and See all demos in this post