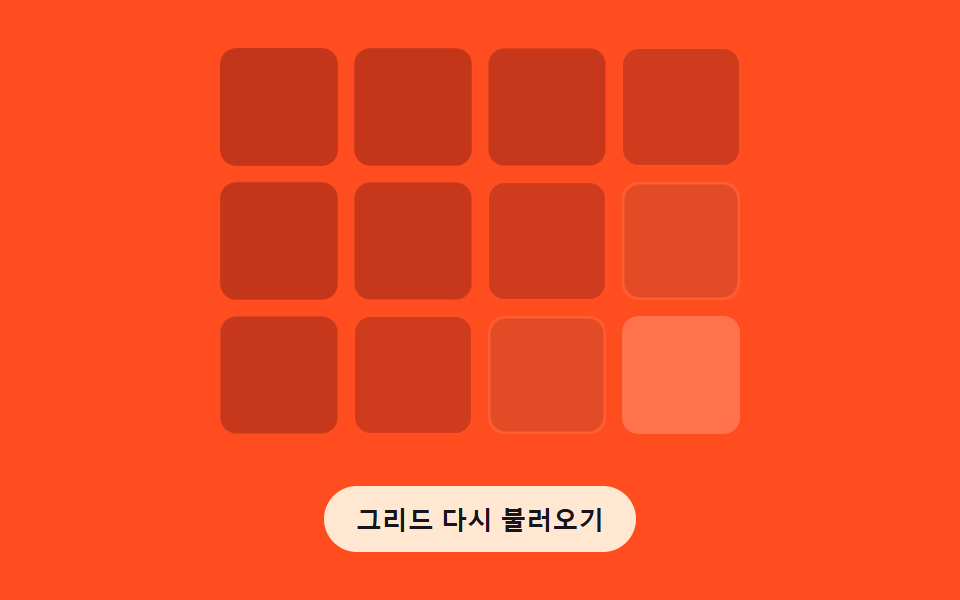
05Chart Loading Whose Gridlines Fade In by Distance
The axis and gridlines fade in with a delay computed from each line's distance from the origin, and the real data marks land on top once the grid settles.
Best forA report screen where the axes should already be in place even if the values arrive late
--delaytransform-originsetTimeout
<main class="stage">
<div class="cg is-demo" id="cg" role="img" aria-label="Quarterly metrics grid" aria-busy="true">
  <div class="cg__cell" data-row="0" data-col="0"><div class="cg__sk"></div><div class="cg__real" data-v="A"></div></div>
  <div class="cg__cell" data-row="0" data-col="1"><div class="cg__sk"></div><div class="cg__real" data-v="B"></div></div>
  <div class="cg__cell" data-row="0" data-col="2"><div class="cg__sk"></div><div class="cg__real" data-v="C"></div></div>
  <div class="cg__cell" data-row="0" data-col="3"><div class="cg__sk"></div><div class="cg__real" data-v="D"></div></div>
  <div class="cg__cell" data-row="1" data-col="0"><div class="cg__sk"></div><div class="cg__real" data-v="E"></div></div>
  <div class="cg__cell" data-row="1" data-col="1"><div class="cg__sk"></div><div class="cg__real" data-v="F"></div></div>
  <div class="cg__cell" data-row="1" data-col="2"><div class="cg__sk"></div><div class="cg__real" data-v="G"></div></div>
  <div class="cg__cell" data-row="1" data-col="3"><div class="cg__sk"></div><div class="cg__real" data-v="H"></div></div>
  <div class="cg__cell" data-row="2" data-col="0"><div class="cg__sk"></div><div class="cg__real" data-v="I"></div></div>
  <div class="cg__cell" data-row="2" data-col="1"><div class="cg__sk"></div><div class="cg__real" data-v="J"></div></div>
  <div class="cg__cell" data-row="2" data-col="2"><div class="cg__sk"></div><div class="cg__real" data-v="K"></div></div>
  <div class="cg__cell" data-row="2" data-col="3"><div class="cg__sk"></div><div class="cg__real" data-v="L"></div></div>
</div>
<button type="button" class="cg__reload" id="cgReload">Reload grid</button>
</main>
@use "../../../../site/static/demo-tokens" as *;
// 변수 3개
$duration: $dur-loop;
$easing: $ease-spring;
$color: $chart-2;
@include stage($stage-orange);
.cg {
width: min(260px, 82vw);
display: grid;
grid-template-columns: repeat(4, 1fr);
gap: $sp-2;
}
.cg__cell { position: relative; aspect-ratio: 1; border-radius: $r-sm; overflow: hidden; }
.cg__sk {
position: absolute; inset: 0; border-radius: inherit;
background: rgba($subject-cream, .22);
animation: cgSkeleton $duration $easing infinite;
animation-delay: var(--delay, 0ms);
}
.cg__real {
position: absolute; inset: 0; border-radius: inherit;
background: $color; opacity: 0; transform: scale(.92); transform-origin: center;
animation: cgReveal $duration $easing infinite;
animation-delay: var(--delay, 0ms);
}
.cg__reload {
display: block; margin: $sp-4 auto 0; appearance: none; border: none; cursor: pointer;
background: rgba($subject-cream, .9); color: $subject-ink; font-weight: 700; font-size: 13px;
padding: $sp-2 $sp-4; border-radius: $r-pill;
}
.cg__reload:focus-visible { outline: 2px solid $subject-cream; outline-offset: 2px; }
@keyframes cgSkeleton {
0% { opacity: 1; }
16% { opacity: 1; }
30% { opacity: 0; }
100% { opacity: 0; }
}
@keyframes cgReveal {
0% { opacity: 0; transform: scale(.92); }
16% { opacity: 0; transform: scale(.92); }
34% { opacity: 1; transform: scale(1); }
90% { opacity: 1; transform: scale(1); }
100% { opacity: 0; transform: scale(.92); }
}
@media (max-width: 340px) {
.cg { width: min(160px, 76vw); gap: $sp-1; }
.cg__reload { margin-top: $sp-2; font-size: 11px; padding: $sp-1 $sp-3; }
}
@media (prefers-reduced-motion: reduce) {
// 실사용 경로 적용: 자동 루프를 멈추고 완성된 칸만 보인다
.cg__sk { animation: none; opacity: 0; }
.cg__real { animation: none; opacity: 1; transform: scale(1); }
}html, body {
margin: 0;
overflow: hidden;
}
.stage {
box-sizing: border-box;
min-height: 100vh;
display: grid;
place-items: center;
margin: 0;
background: #ff4d1f;
font-family: -apple-system, "Segoe UI", "Noto Sans KR", sans-serif;
padding: clamp(8px, 4vw, 24px);
}
.cg {
width: min(260px, 82vw);
display: grid;
grid-template-columns: repeat(4, 1fr);
gap: 8px;
}
.cg__cell {
position: relative;
aspect-ratio: 1;
border-radius: 8px;
overflow: hidden;
}
.cg__sk {
position: absolute;
inset: 0;
border-radius: inherit;
background: rgba(255, 247, 230, 0.22);
animation: cgSkeleton 2s cubic-bezier(0.2, 0.8, 0.2, 1) infinite;
animation-delay: var(--delay, 0ms);
}
.cg__real {
position: absolute;
inset: 0;
border-radius: inherit;
background: #c2361a;
opacity: 0;
transform: scale(0.92);
transform-origin: center;
animation: cgReveal 2s cubic-bezier(0.2, 0.8, 0.2, 1) infinite;
animation-delay: var(--delay, 0ms);
}
.cg__reload {
display: block;
margin: 16px auto 0;
appearance: none;
border: none;
cursor: pointer;
background: rgba(255, 247, 230, 0.9);
color: #17141a;
font-weight: 700;
font-size: 13px;
padding: 8px 16px;
border-radius: 999px;
}
.cg__reload:focus-visible {
outline: 2px solid #fff7e6;
outline-offset: 2px;
}
@keyframes cgSkeleton {
0% {
opacity: 1;
}
16% {
opacity: 1;
}
30% {
opacity: 0;
}
100% {
opacity: 0;
}
}
@keyframes cgReveal {
0% {
opacity: 0;
transform: scale(0.92);
}
16% {
opacity: 0;
transform: scale(0.92);
}
34% {
opacity: 1;
transform: scale(1);
}
90% {
opacity: 1;
transform: scale(1);
}
100% {
opacity: 0;
transform: scale(0.92);
}
}
@media (max-width: 340px) {
.cg {
width: min(160px, 76vw);
gap: 4px;
}
.cg__reload {
margin-top: 8px;
font-size: 11px;
padding: 4px 12px;
}
}
@media (prefers-reduced-motion: reduce) {
.cg__sk {
animation: none;
opacity: 0;
}
.cg__real {
animation: none;
opacity: 1;
transform: scale(1);
}
}(function () {
var STEP_MS = 55;
var grid = document.getElementById('cg');
var reload = document.getElementById('cgReload');
var cells = Array.prototype.slice.call(grid.querySelectorAll('.cg__cell'));
// 계산 겹: 칸의 (행+열) 대각 거리로 순서를 매긴다 — 왼쪽 위부터 대각선으로 번져 나간다
function cellOrder(row, col) { return row + col; }
cells.forEach(function (cell) {
var row = Number(cell.getAttribute('data-row'));
var col = Number(cell.getAttribute('data-col'));
var delay = cellOrder(row, col) * STEP_MS;
cell.style.setProperty('--delay', delay + 'ms');
});
function human() {
grid.classList.remove('is-demo');
grid.setAttribute('aria-busy', 'true');
cells.forEach(function (cell) {
var sk = cell.querySelector('.cg__sk');
var real = cell.querySelector('.cg__real');
sk.style.transition = 'none';
real.style.transition = 'none';
sk.style.opacity = '1';
real.style.opacity = '0';
real.style.transform = 'scale(.92)';
});
var row = 0, col = 0, maxOrder = 0;
cells.forEach(function (cell) {
row = Number(cell.getAttribute('data-row'));
col = Number(cell.getAttribute('data-col'));
var order = cellOrder(row, col);
if (order > maxOrder) { maxOrder = order; }
var delayMs = order * STEP_MS;
window.setTimeout(function () {
var sk = cell.querySelector('.cg__sk');
var real = cell.querySelector('.cg__real');
sk.style.transition = 'opacity 220ms ease-out';
real.style.transition = 'opacity 220ms ease-out, transform 220ms ease-out';
sk.style.opacity = '0';
real.style.opacity = '1';
real.style.transform = 'scale(1)';
}, 200 + delayMs);
});
window.setTimeout(function () { grid.setAttribute('aria-busy', 'false'); }, 200 + maxOrder * STEP_MS + 260);
}
reload.addEventListener('click', human);
reload.addEventListener('keydown', function (e) {
if (e.key === 'Enter' || e.key === ' ') { e.preventDefault(); human(); }
});
}());import { useEffect, useRef } from 'react';
import styles from './ChartLoadingGridFadeOrder.module.scss';
const STEP_MS = 55;
const ROWS = 3;
const COLS = 4;
const LABELS = ['A', 'B', 'C', 'D', 'E', 'F', 'G', 'H', 'I', 'J', 'K', 'L'];
export default function ChartLoadingGridFadeOrder() {
const gridRef = useRef<HTMLDivElement>(null);
const reloadRef = useRef<HTMLButtonElement>(null);
const skRefs = useRef<HTMLDivElement[]>([]);
const realRefs = useRef<HTMLDivElement[]>([]);
const cells: { row: number; col: number; v: string }[] = [];
for (let r = 0; r < ROWS; r += 1) {
for (let c = 0; c < COLS; c += 1) { cells.push({ row: r, col: c, v: LABELS[r * COLS + c] }); }
}
useEffect(() => {
const grid = gridRef.current;
const reload = reloadRef.current;
if (!grid || !reload) return undefined;
const sks = skRefs.current!;
const reals = realRefs.current!;
if (!sks || !reals) return undefined;
// 계산 겹: 칸의 (행+열) 대각 거리로 순서를 매긴다 — 왼쪽 위부터 대각선으로 번져 나간다
function cellOrder(row: number, col: number) { return row + col; }
cells.forEach((cell, i) => {
const delay = cellOrder(cell.row, cell.col) * STEP_MS;
sks[i].parentElement!.style.setProperty('--delay', delay + 'ms');
});
const timers: number[] = [];
function human() {
grid!.classList.remove(styles['is-demo']);
grid!.setAttribute('aria-busy', 'true');
cells.forEach((_cell, i) => {
sks[i].style.transition = 'none';
reals[i].style.transition = 'none';
sks[i].style.opacity = '1';
reals[i].style.opacity = '0';
reals[i].style.transform = 'scale(.92)';
});
let maxOrder = 0;
cells.forEach((cell, i) => {
const order = cellOrder(cell.row, cell.col);
if (order > maxOrder) { maxOrder = order; }
const delayMs = order * STEP_MS;
timers.push(window.setTimeout(() => {
sks[i].style.transition = 'opacity 220ms ease-out';
reals[i].style.transition = 'opacity 220ms ease-out, transform 220ms ease-out';
sks[i].style.opacity = '0';
reals[i].style.opacity = '1';
reals[i].style.transform = 'scale(1)';
}, 200 + delayMs));
});
timers.push(window.setTimeout(() => { grid!.setAttribute('aria-busy', 'false'); }, 200 + maxOrder * STEP_MS + 260));
}
function onClick() { human(); }
function onKey(e: KeyboardEvent) { if (e.key === 'Enter' || e.key === ' ') { e.preventDefault(); human(); } }
reload.addEventListener('click', onClick);
reload.addEventListener('keydown', onKey);
return () => {
reload.removeEventListener('click', onClick);
reload.removeEventListener('keydown', onKey);
timers.forEach((id) => window.clearTimeout(id));
};
}, []);
return (
<main className={styles.stage}>
<div className={styles.cg + ' ' + styles['is-demo']} ref={gridRef} role="img" aria-label="분기별 지표 그리드" aria-busy="true">
{cells.map((cell, i) => (
<div className={styles.cgCell} data-row={cell.row} data-col={cell.col} key={i}>
<div className={styles.cgSk} ref={(el: HTMLDivElement | null) => { if (el) skRefs.current![i] = el; }} />
<div
className={styles.cgReal}
data-v={cell.v}
ref={(el: HTMLDivElement | null) => { if (el) realRefs.current![i] = el; }}
/>
</div>
))}
</div>
<button type="button" className={styles.cgReload} ref={reloadRef}>그리드 다시 불러오기</button>
</main>
);
}05 Chart Loading Whose Gridlines Fade In by Distance — Measured area 28.608% · moving frames 9/23Original by GODRICH · SCSS and React ship in the zip · Chart Loading Animation — 9 Computed Patterns
The post this demo lives in
 Chart Loading Animation — 9 Computed PatternsAmong nine chart loading animation patterns, a bar's delay comes from its column, a heatmap cell's from diagonal distanc See all demos in this post
If you like this effect - similar demos
 Loaders04 Squish ball9 Loading Screen Designs — Pretty CSS Loaders
 Loaders01 Bottom spinner fade — a loading indicator computing its opacity from the remaining scroll distanceInfinite Scroll Loading: 9 Essential UI Patterns
 Loaders02 Button Background That Fills Like a Mini Progress BarLoading Button UI — 9 States, Spinner to Success