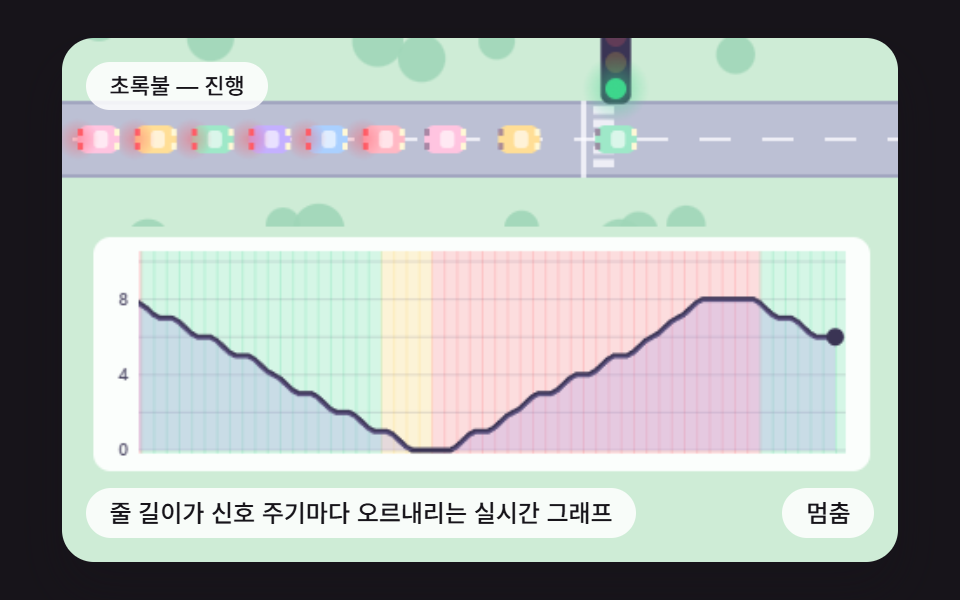
07A Live Graph of Queue Length Rising and Falling Each Cycle
Every 6 frames it counts cars waiting at the stop line and joins 56 samples into a line smoothed through segment midpoints (smoothing 0.5), with the signal color of each moment shaded behind it so the queue shrinks and grows with the cycle.
Best forA traffic dashboard metric card
SAMPLE_EVERYGRAPH_POINTSY_MAX_CARSLINE_SMOOTH
<main class="stage">
<div class="sc is-demo" id="scRoot">
  <canvas class="sc__canvas" id="scCanvas" width="480" height="300" tabindex="0" aria-label="A Live Graph of Queue Length Rising and Falling Each Cycle"></canvas>
  <p class="sc__status" id="scStatus" aria-live="polite">Green — go</p>
  <button class="sc__btn" id="scBtn" type="button">Pause</button>
  <p class="sc__caption">A Live Graph of Queue Length Rising and Falling Each Cycle</p>
</div>
</main>
@use "../../../../site/static/demo-tokens" as *;
@include stage($stage-ink);
.sc {
position: relative;
width: min(92vw, calc(160vh - 12.8vw));
aspect-ratio: 480 / 300;
margin: 0 auto;
border-radius: $r-card;
overflow: hidden;
box-shadow: $shadow-raised;
background: $subject-ink;
}
.sc__canvas {
display: block;
width: 100%;
height: 100%;
touch-action: none;
}
.sc__canvas:focus-visible {
outline: 2px solid rgba(255, 255, 255, .85);
outline-offset: -6px;
}
.sc__status {
position: absolute;
left: $sp-3;
top: $sp-3;
max-width: 62%;
margin: 0;
padding: $sp-1 $sp-3;
border-radius: $r-pill;
background: rgba(255, 255, 255, .85);
color: $subject-ink;
font-weight: 500;
font-size: 11px;
line-height: 1.4;
pointer-events: none;
}
.sc__btn {
position: absolute;
right: $sp-3;
bottom: $sp-3;
margin: 0;
padding: $sp-1 $sp-3;
border: 0;
border-radius: $r-pill;
background: rgba(255, 255, 255, .85);
color: $subject-ink;
font: inherit;
font-weight: 500;
font-size: 12px;
line-height: 1.4;
cursor: pointer;
}
.sc__btn:focus-visible {
outline: 2px solid #ffffff;
outline-offset: 2px;
}
.sc__caption {
position: absolute;
left: $sp-3;
bottom: $sp-3;
max-width: 68%;
margin: 0;
padding: $sp-1 $sp-3;
border-radius: $r-pill;
background: rgba(255, 255, 255, .85);
color: $subject-ink;
font-weight: 500;
font-size: 12px;
line-height: 1.4;
pointer-events: none;
}
@media (max-width: 340px) {
.sc__caption, .sc__btn { font-size: 10px; padding: $sp-1 $sp-2; }
.sc__status { font-size: 10px; }
}
@media (prefers-reduced-motion: reduce) {
.sc { cursor: default; }
}html, body {
margin: 0;
overflow: hidden;
}
.stage {
box-sizing: border-box;
min-height: 100vh;
display: grid;
place-items: center;
margin: 0;
background: #17141a;
font-family: -apple-system, "Segoe UI", "Noto Sans KR", sans-serif;
padding: clamp(8px, 4vw, 24px);
}
.sc {
position: relative;
width: min(92vw, 160vh - 12.8vw);
aspect-ratio: 480/300;
margin: 0 auto;
border-radius: 16px;
overflow: hidden;
box-shadow: 0 14px 24px rgba(23, 20, 26, 0.32);
background: #17141a;
}
.sc__canvas {
display: block;
width: 100%;
height: 100%;
touch-action: none;
}
.sc__canvas:focus-visible {
outline: 2px solid rgba(255, 255, 255, 0.85);
outline-offset: -6px;
}
.sc__status {
position: absolute;
left: 12px;
top: 12px;
max-width: 62%;
margin: 0;
padding: 4px 12px;
border-radius: 999px;
background: rgba(255, 255, 255, 0.85);
color: #17141a;
font-weight: 500;
font-size: 11px;
line-height: 1.4;
pointer-events: none;
}
.sc__btn {
position: absolute;
right: 12px;
bottom: 12px;
margin: 0;
padding: 4px 12px;
border: 0;
border-radius: 999px;
background: rgba(255, 255, 255, 0.85);
color: #17141a;
font: inherit;
font-weight: 500;
font-size: 12px;
line-height: 1.4;
cursor: pointer;
}
.sc__btn:focus-visible {
outline: 2px solid #ffffff;
outline-offset: 2px;
}
.sc__caption {
position: absolute;
left: 12px;
bottom: 12px;
max-width: 68%;
margin: 0;
padding: 4px 12px;
border-radius: 999px;
background: rgba(255, 255, 255, 0.85);
color: #17141a;
font-weight: 500;
font-size: 12px;
line-height: 1.4;
pointer-events: none;
}
@media (max-width: 340px) {
.sc__caption, .sc__btn {
font-size: 10px;
padding: 4px 8px;
}
.sc__status {
font-size: 10px;
}
}
@media (prefers-reduced-motion: reduce) {
.sc {
cursor: default;
}
}(function () {
const W = 480;
const H = 300;
const PI2 = Math.PI * 2;
const FIXED_DT = 16;
const REDUCE_STEP_MS = 900;
const REDUCE_START_MS = 1200;
const KEY_STEP = 12;
const FONT = '-apple-system, "Segoe UI", "Noto Sans KR", sans-serif';
const SIG_GREEN = 0;
const SIG_YELLOW = 1;
const SIG_RED = 2;
const GREEN_RGB = [61, 214, 140];
const YELLOW_RGB = [255, 200, 64];
const RED_RGB = [255, 92, 102];
const SIGNAL_RGBS = [GREEN_RGB, YELLOW_RGB, RED_RGB];
const SKY_RGB = [226, 238, 252];
const GRASS_RGB = [206, 236, 214];
const ROAD_RGB = [188, 192, 212];
const ROAD_EDGE_RGB = [162, 166, 192];
const MARK_RGB = [250, 250, 255];
const INK_RGB = [58, 52, 84];
const CAR_RGBS = [[255, 184, 196], [170, 208, 255], [196, 176, 255], [158, 232, 200], [255, 222, 150], [255, 196, 224]];
const TXT_GO = 'Green — go';
const TXT_READY = 'Yellow — get ready to stop';
const TXT_STOP = 'Red — stop';
function clamp(v, lo, hi) { return v < lo ? lo : (v > hi ? hi : v); }
function lerp(a, b, k) { return a + (b - a) * k; }
function smooth(x) { const c = clamp(x, 0, 1); return c * c * (3 - 2 * c); }
function rgba(c, a) {
return 'rgba(' + Math.round(c[0]) + ',' + Math.round(c[1]) + ',' + Math.round(c[2]) + ',' + a.toFixed(3) + ')';
}
// 시드 고정 난수 — 같은 시드면 언제나 같은 수열
function mulberry32(seed) {
let s = seed >>> 0;
return function () {
s = (s + 0x6D2B79F5) >>> 0;
let t = s;
t = Math.imul(t ^ (t >>> 15), t | 1);
t ^= t + Math.imul(t ^ (t >>> 7), t | 61);
return ((t ^ (t >>> 14)) >>> 0) / 4294967296;
};
}
// 격자 점의 값 — 정수 두 개를 섞어 0..1 로 (같은 입력은 언제나 같은 값)
function hash2(ix, iy) {
let h = Math.imul(ix | 0, 374761393) + Math.imul(iy | 0, 668265263);
h = Math.imul(h ^ (h >>> 13), 1274126177);
return ((h ^ (h >>> 16)) >>> 0) / 4294967296;
}
// 2차원 값 잡음 — 네 격자 점을 부드럽게 보간
function vnoise(x, y) {
const ix = Math.floor(x);
const iy = Math.floor(y);
const fx = smooth(x - ix);
const fy = smooth(y - iy);
return lerp(lerp(hash2(ix, iy), hash2(ix + 1, iy), fx), lerp(hash2(ix, iy + 1), hash2(ix + 1, iy + 1), fx), fy);
}
function glow(ctx, x, y, r, c, a) {
const g = ctx.createRadialGradient(x, y, 0, x, y, r);
g.addColorStop(0, rgba(c, a));
g.addColorStop(1, rgba(c, 0));
ctx.fillStyle = g;
ctx.fillRect(x - r, y - r, r * 2, r * 2);
}
function rrect(ctx, x, y, w, h, r) {
const rr = Math.min(r, w / 2, h / 2);
ctx.beginPath();
ctx.moveTo(x + rr, y);
ctx.arcTo(x + w, y, x + w, y + h, rr);
ctx.arcTo(x + w, y + h, x, y + h, rr);
ctx.arcTo(x, y + h, x, y, rr);
ctx.arcTo(x, y, x + w, y, rr);
ctx.closePath();
}
// 주기 [초록, 노랑, 빨강] 프레임 수에서 프레임 f 의 신호 상태
function phaseAt(f, g, y, r) {
const total = g + y + r;
const m = ((f % total) + total) % total;
return m < g ? SIG_GREEN : (m < g + y ? SIG_YELLOW : SIG_RED);
}
function stateText(state) {
return state === SIG_GREEN ? TXT_GO : (state === SIG_YELLOW ? TXT_READY : TXT_STOP);
}
// 신호 상태 -> 빨강·노랑·초록 렌즈 밝기 (위에서 아래)
function litOf(state) {
return [state === SIG_RED ? 1 : 0, state === SIG_YELLOW ? 1 : 0, state === SIG_GREEN ? 1 : 0];
}
const LENS_RGBS = [RED_RGB, YELLOW_RGB, GREEN_RGB];
// 세로 신호등 머리 — 렌즈 세 개와 켜진 렌즈의 빛 번짐
function drawHead(ctx, cx, cy, r, lit) {
const step = r * 2.5;
rrect(ctx, cx - r * 1.45, cy - step - r * 1.45, r * 2.9, step * 2 + r * 2.9, r * 0.9);
ctx.fillStyle = rgba(INK_RGB, 1);
ctx.fill();
for (let i = 0; i < 3; i += 1) {
const ly = cy + (i - 1) * step;
ctx.beginPath();
ctx.arc(cx, ly, r, 0, PI2);
ctx.fillStyle = rgba(LENS_RGBS[i], 0.2 + 0.8 * lit[i]);
ctx.fill();
if (lit[i] > 0.02) {
glow(ctx, cx, ly, r * 3.2, LENS_RGBS[i], 0.55 * lit[i]);
}
}
}
// 위에서 본 차 — 앞 범퍼가 x, 가운데가 y. 제동 중이면 뒷등이 켜진다
function drawCar(ctx, x, y, len, wid, rgb, braking) {
const x0 = x - len;
rrect(ctx, x0, y - wid / 2, len, wid, 6);
ctx.fillStyle = rgba(rgb, 1);
ctx.fill();
rrect(ctx, x - len * 0.62, y - wid / 2 + 3, len * 0.34, wid - 6, 3);
ctx.fillStyle = 'rgba(255,255,255,0.62)';
ctx.fill();
ctx.fillStyle = 'rgba(255,248,214,1)';
ctx.fillRect(x - 3, y - wid / 2 + 2, 3, 4);
ctx.fillRect(x - 3, y + wid / 2 - 6, 3, 4);
ctx.fillStyle = braking ? rgba(RED_RGB, 1) : 'rgba(150,120,150,0.8)';
ctx.fillRect(x0, y - wid / 2 + 2, 3, 4);
ctx.fillRect(x0, y + wid / 2 - 6, 3, 4);
if (braking) {
glow(ctx, x0, y, 12, RED_RGB, 0.45);
}
}
// 한 줄 도로 장면의 바탕 — 잔디 위에 도로띠 하나, 정지선과 횡단보도
function drawLaneBackdrop(ctx, roadY, roadH, stopX, seedTrees) {
ctx.fillStyle = rgba(GRASS_RGB, 1);
ctx.fillRect(0, 0, W, H);
const rnd = mulberry32(seedTrees);
for (let i = 0; i < 14; i += 1) {
const tx = 16 + rnd() * (W - 32);
const up = rnd() < 0.5;
const ty = up ? roadY - roadH / 2 - 22 - rnd() * 26 : roadY + roadH / 2 + 22 + rnd() * 26;
ctx.beginPath();
ctx.arc(tx, ty, 9 + rnd() * 6, 0, PI2);
ctx.fillStyle = 'rgba(160,214,184,0.9)';
ctx.fill();
}
ctx.fillStyle = rgba(ROAD_RGB, 1);
ctx.fillRect(0, roadY - roadH / 2, W, roadH);
ctx.fillStyle = rgba(ROAD_EDGE_RGB, 1);
ctx.fillRect(0, roadY - roadH / 2, W, 2);
ctx.fillRect(0, roadY + roadH / 2 - 2, W, 2);
ctx.fillStyle = rgba(MARK_RGB, 0.8);
for (let x = 6; x < W; x += 36) {
ctx.fillRect(x, roadY - 1, 18, 2);
}
for (let k = 0; k < 5; k += 1) {
ctx.fillRect(stopX + 5, roadY - roadH / 2 + 3 + k * (roadH - 6) / 5, 12, (roadH - 6) / 5 - 3);
}
ctx.fillRect(stopX - 2, roadY - roadH / 2, 3, roadH);
}
// 한 줄 차량 흐름 — 앞차 간격(IDM)과 정지선을 같은 식으로 다룬다. 차는 앞쪽부터 0번이다
class Lane {
constructor(seed, p) {
this.cars = [];
this.nextAt = 0;
this.made = 0;
this.p = p;
this.rnd = mulberry32(seed);
}
accelFor(v, s, vL, g0) {
const p = this.p;
const sStar = g0 + Math.max(0, v * p.headway + v * (v - vL) / (2 * Math.sqrt(p.accel * p.brake)));
return p.accel * (1 - Math.pow(v / p.vmax, p.delta) - Math.pow(sStar / Math.max(s, 0.5), 2));
}
// f 프레임에, 뒤쪽이 비어 있고 때가 됐으면 한 대 들여보낸다
maybeSpawn(f, minGap, maxGap, v0) {
if (f < this.nextAt) {
return false;
}
const last = this.cars.length > 0 ? this.cars[this.cars.length - 1] : null;
if (last && last.x - last.len < this.p.gap + 10) {
return false;
}
const rgb = CAR_RGBS[this.made % CAR_RGBS.length];
this.cars.push({ x: -2, v: v0, len: this.p.len, rgb: rgb, go: false, decided: false, sigK: -1, brake: false, id: this.made });
this.made += 1;
this.nextAt = f + minGap + Math.floor(this.rnd() * (maxGap - minGap + 1));
return true;
}
// 신호 목록은 x 오름차순. 한 번 호출 = 한 프레임. 정지선을 넘은 차(detect 용) id 를 돌려준다
step(sigs, onCross, watchX) {
const p = this.p;
for (let i = 0; i < this.cars.length; i += 1) {
const c = this.cars[i];
let acc = this.accelFor(c.v, 1e6, c.v, p.gap);
if (i > 0) {
const L = this.cars[i - 1];
acc = Math.min(acc, this.accelFor(c.v, (L.x - L.len) - c.x, L.v, p.gap));
}
let k = -1;
for (let j = 0; j < sigs.length; j += 1) {
if (sigs[j].x >= c.x) {
k = j;
break;
}
}
let clampX = 1e9;
if (k >= 0) {
const sg = sigs[k];
if (c.sigK !== k) {
c.sigK = k;
c.decided = false;
c.go = false;
}
if (sg.state === SIG_GREEN) {
c.decided = false;
c.go = false;
}
else {
if (!c.decided) {
c.decided = true;
c.go = c.v * c.v / (2 * p.brake) > sg.x - c.x;
}
if (!c.go) {
acc = Math.min(acc, this.accelFor(c.v, sg.x - c.x - 2, 0, p.lineGap));
clampX = sg.x - 1.5;
}
}
}
acc = Math.max(acc, -p.brake * 3);
const prevX = c.x;
c.v = Math.max(0, c.v + acc);
c.x += c.v;
if (c.x > clampX && prevX <= clampX) {
c.x = clampX;
c.v = 0;
}
c.brake = acc < -0.012 || c.v < 0.05;
if (prevX < watchX && c.x >= watchX) {
onCross(c, watchX);
}
}
while (this.cars.length > 0 && this.cars[0].x - this.cars[0].len > W + 20) {
this.cars.shift();
}
}
// 정지선 뒤에서 서 있는 차 수
waiting(stopX) {
let n = 0;
for (let i = 0; i < this.cars.length; i += 1) {
const c = this.cars[i];
if (c.v < 0.25 && c.x < stopX + 2 && c.x > stopX - 260) {
n += 1;
}
}
return n;
}
}
function main(rootEl, canvas, statusEl, btnEl) {
const ctx0 = canvas.getContext('2d');
if (!ctx0) {
return function () { return; };
}
canvas.width = W;
canvas.height = H;
const reduce = window.matchMedia('(prefers-reduced-motion: reduce)').matches;
const scene = makeScene(ctx0, reduce);
if (reduce) {
rootEl.classList.remove('is-demo');
}
let paused = false;
let rafId = 0;
let lastTs = null;
let accMs = 0;
let lastLabel = '';
let px = W / 2;
let py = H / 2;
const cleaners = [];
function listen(target, type, fn) {
target.addEventListener(type, fn);
cleaners.push(function () { target.removeEventListener(type, fn); });
}
function show() {
scene.draw();
const t = scene.label();
if (t !== lastLabel) {
lastLabel = t;
statusEl.textContent = t;
}
}
function advance(ms) {
const n = Math.round(ms / FIXED_DT);
for (let i = 0; i < n; i += 1) {
scene.step();
}
}
function setButton() {
btnEl.textContent = reduce ? 'Next scene' : (paused ? 'Play' : 'Pause');
}
function toLocal(e) {
const r = canvas.getBoundingClientRect();
return [clamp((e.clientX - r.left) * W / r.width, 0, W), clamp((e.clientY - r.top) * H / r.height, 0, H)];
}
function moved() {
if (scene.point) {
scene.point(px, py);
}
if (reduce) {
show();
}
}
function onButton() {
if (reduce) {
advance(REDUCE_STEP_MS);
show();
return;
}
paused = !paused;
if (paused) {
rootEl.classList.remove('is-demo');
}
else {
rootEl.classList.add('is-demo');
}
setButton();
}
function onAction() {
if (scene.tap) {
scene.tap();
if (reduce) {
show();
}
return;
}
onButton();
}
function tick(ts) {
if (lastTs === null) {
lastTs = ts;
}
const frameDt = Math.min(ts - lastTs, 160);
lastTs = ts;
if (!paused) {
accMs += frameDt;
while (accMs >= FIXED_DT) {
scene.step();
accMs -= FIXED_DT;
}
show();
}
rafId = requestAnimationFrame(tick);
}
listen(btnEl, 'click', function () { onButton(); });
listen(canvas, 'pointerdown', function (e) {
const p = toLocal(e);
px = p[0];
py = p[1];
moved();
if (scene.tap) {
scene.tap();
if (reduce) {
show();
}
}
});
listen(canvas, 'pointermove', function (e) {
const p = toLocal(e);
px = p[0];
py = p[1];
moved();
});
listen(canvas, 'keydown', function (e) {
const k = e.key;
if (k === 'Enter' || k === ' ') {
e.preventDefault();
onAction();
return;
}
let dx = 0;
let dy = 0;
if (k === 'ArrowLeft') {
dx = -KEY_STEP;
}
else if (k === 'ArrowRight') {
dx = KEY_STEP;
}
else if (k === 'ArrowUp') {
dy = -KEY_STEP;
}
else if (k === 'ArrowDown') {
dy = KEY_STEP;
}
else {
return;
}
e.preventDefault();
px = clamp(px + dx, 0, W);
py = clamp(py + dy, 0, H);
moved();
});
advance(REDUCE_START_MS);
setButton();
show();
if (!reduce) {
rafId = requestAnimationFrame(tick);
}
function destroy() {
cancelAnimationFrame(rafId);
for (let i = 0; i < cleaners.length; i += 1) {
cleaners[i]();
}
}
return destroy;
}
const SAMPLE_EVERY = 6;
const GRAPH_POINTS = 56;
const Y_MAX_CARS = 10;
const LINE_SMOOTH = 0.5;
const STOP_LINE_X = 300;
const ROAD_Y = 58;
const ROAD_H = 44;
const CAR_LEN = 24;
const CAR_WID = 16;
const GREEN_LEN = 110;
const YELLOW_LEN = 24;
const RED_LEN = 160;
const GRAPH_X0 = 44;
const GRAPH_X1 = 450;
const GRAPH_Y0 = 236;
const GRAPH_Y1 = 128;
const SEED = 446;
function makeScene(ctx, reduce) {
const lane = new Lane(SEED, { accel: 0.04, brake: 0.07, gap: 10, lineGap: 3, vmax: 2, headway: 10, delta: 4, len: CAR_LEN });
const sig = { x: STOP_LINE_X, state: SIG_GREEN };
const sigs = [sig];
const hist = [];
const histState = [];
let f = 0;
function none(c, x) { return; }
function sample() {
hist.push(lane.waiting(STOP_LINE_X));
histState.push(sig.state);
if (hist.length > GRAPH_POINTS + 1) {
hist.shift();
histState.shift();
}
}
function px(i, shift) {
return GRAPH_X1 - (hist.length - 1 - i + shift) * (GRAPH_X1 - GRAPH_X0) / GRAPH_POINTS;
}
function py(v) {
return GRAPH_Y0 - clamp(v / Y_MAX_CARS, 0, 1) * (GRAPH_Y0 - GRAPH_Y1);
}
const scene = {
step: function () {
f += 1;
sig.state = phaseAt(f, GREEN_LEN, YELLOW_LEN, RED_LEN);
lane.maybeSpawn(f, 22, 44, 1.8);
lane.step(sigs, none, -1);
if (f % SAMPLE_EVERY === 0) {
sample();
}
},
label: function () { return stateText(sig.state); },
draw: function () {
drawLaneBackdrop(ctx, ROAD_Y, ROAD_H, STOP_LINE_X, 7);
ctx.fillStyle = rgba(GRASS_RGB, 1);
ctx.fillRect(0, 108, W, 192);
for (let i = 0; i < lane.cars.length; i += 1) {
const c = lane.cars[i];
drawCar(ctx, c.x, ROAD_Y, c.len, CAR_WID, c.rgb, c.brake);
}
drawHead(ctx, STOP_LINE_X + 18, ROAD_Y - ROAD_H / 2 - 22, 6, litOf(sig.state));
// 그래프 판
rrect(ctx, GRAPH_X0 - 26, GRAPH_Y1 - 14, GRAPH_X1 - GRAPH_X0 + 40, GRAPH_Y0 - GRAPH_Y1 + 26, 10);
ctx.fillStyle = 'rgba(255,255,255,0.92)';
ctx.fill();
ctx.save();
ctx.beginPath();
ctx.rect(GRAPH_X0, GRAPH_Y1 - 6, GRAPH_X1 - GRAPH_X0, GRAPH_Y0 - GRAPH_Y1 + 8);
ctx.clip();
const shift = reduce ? 0 : (f % SAMPLE_EVERY) / SAMPLE_EVERY;
const n = hist.length;
// 신호 색 띠 — 그 순간의 신호가 뒤에 깔린다
for (let i = 0; i < n; i += 1) {
const x0 = px(i, shift);
const x1 = px(i + 1, shift);
ctx.fillStyle = rgba(SIGNAL_RGBS[histState[i]], 0.2);
ctx.fillRect(x0, GRAPH_Y1 - 6, Math.max(x1 - x0, 0) + (i < n - 1 ? 1 : 0), GRAPH_Y0 - GRAPH_Y1 + 8);
}
// 눈금선
ctx.strokeStyle = 'rgba(58,52,84,0.14)';
ctx.lineWidth = 1;
for (let v = 0; v <= Y_MAX_CARS; v += 2) {
ctx.beginPath();
ctx.moveTo(GRAPH_X0, py(v));
ctx.lineTo(GRAPH_X1, py(v));
ctx.stroke();
}
if (n > 2) {
// 선 — 이웃 점의 중간점을 이어 곡선으로. LINE_SMOOTH 가 0 이면 꺾은선, 1 이면 완전한 곡선
let sx = px(0, shift);
let sy = py(hist[0]);
ctx.beginPath();
ctx.moveTo(sx, sy);
for (let i = 1; i < n; i += 1) {
const bx = px(i, shift);
const by = py(hist[i]);
const ex = i < n - 1 ? (bx + px(i + 1, shift)) / 2 : bx;
const ey = i < n - 1 ? (by + py(hist[i + 1])) / 2 : by;
ctx.quadraticCurveTo(lerp((sx + ex) / 2, bx, LINE_SMOOTH), lerp((sy + ey) / 2, by, LINE_SMOOTH), ex, ey);
sx = ex;
sy = ey;
}
ctx.lineWidth = 3;
ctx.lineJoin = 'round';
ctx.strokeStyle = rgba(INK_RGB, 1);
ctx.stroke();
ctx.lineTo(px(n - 1, shift), GRAPH_Y0);
ctx.lineTo(px(0, shift), GRAPH_Y0);
ctx.closePath();
ctx.fillStyle = 'rgba(170,150,230,0.28)';
ctx.fill();
}
ctx.restore();
if (n > 0) {
ctx.beginPath();
ctx.arc(px(n - 1, shift), py(hist[n - 1]), 5, 0, PI2);
ctx.fillStyle = rgba(INK_RGB, 1);
ctx.fill();
}
ctx.fillStyle = rgba(INK_RGB, 0.9);
ctx.font = '500 10px ' + FONT;
ctx.textAlign = 'right';
for (let v = 0; v <= Y_MAX_CARS; v += 4) {
ctx.fillText(String(v), GRAPH_X0 - 6, py(v) + 3);
}
ctx.textAlign = 'center';
}
};
for (let i = 0; i < 420; i += 1) {
scene.step();
}
return scene;
}
main(document.getElementById('scRoot'), document.getElementById('scCanvas'), document.getElementById('scStatus'), document.getElementById('scBtn'));
})();import { useEffect, useRef } from "react";
import styles from "./TlQueueLengthLiveGraph.module.scss";
const W = 480;
const H = 300;
const PI2 = Math.PI * 2;
const FIXED_DT = 16;
const REDUCE_STEP_MS = 900;
const REDUCE_START_MS = 1200;
const KEY_STEP = 12;
const FONT = '-apple-system, "Segoe UI", "Noto Sans KR", sans-serif';
const SIG_GREEN = 0;
const SIG_YELLOW = 1;
const SIG_RED = 2;
const GREEN_RGB = [61, 214, 140];
const YELLOW_RGB = [255, 200, 64];
const RED_RGB = [255, 92, 102];
const SIGNAL_RGBS = [GREEN_RGB, YELLOW_RGB, RED_RGB];
const SKY_RGB = [226, 238, 252];
const GRASS_RGB = [206, 236, 214];
const ROAD_RGB = [188, 192, 212];
const ROAD_EDGE_RGB = [162, 166, 192];
const MARK_RGB = [250, 250, 255];
const INK_RGB = [58, 52, 84];
const CAR_RGBS = [[255, 184, 196], [170, 208, 255], [196, 176, 255], [158, 232, 200], [255, 222, 150], [255, 196, 224]];
const TXT_GO = '초록불 — 진행';
const TXT_READY = '노란불 — 정지 준비';
const TXT_STOP = '빨간불 — 정지';
type Pt = [number, number];
interface Scene {
step(): void;
draw(): void;
label(): string;
point?(x: number, y: number): void;
tap?(): void;
}
function clamp(v: number, lo: number, hi: number): number { return v < lo ? lo : (v > hi ? hi : v); }
function lerp(a: number, b: number, k: number): number { return a + (b - a) * k; }
function smooth(x: number): number { const c = clamp(x, 0, 1); return c * c * (3 - 2 * c); }
function rgba(c: number[], a: number): string {
return 'rgba(' + Math.round(c[0]) + ',' + Math.round(c[1]) + ',' + Math.round(c[2]) + ',' + a.toFixed(3) + ')';
}
// 시드 고정 난수 — 같은 시드면 언제나 같은 수열
function mulberry32(seed: number): () => number {
let s = seed >>> 0;
return function (): number {
s = (s + 0x6D2B79F5) >>> 0;
let t = s;
t = Math.imul(t ^ (t >>> 15), t | 1);
t ^= t + Math.imul(t ^ (t >>> 7), t | 61);
return ((t ^ (t >>> 14)) >>> 0) / 4294967296;
};
}
// 격자 점의 값 — 정수 두 개를 섞어 0..1 로 (같은 입력은 언제나 같은 값)
function hash2(ix: number, iy: number): number {
let h = Math.imul(ix | 0, 374761393) + Math.imul(iy | 0, 668265263);
h = Math.imul(h ^ (h >>> 13), 1274126177);
return ((h ^ (h >>> 16)) >>> 0) / 4294967296;
}
// 2차원 값 잡음 — 네 격자 점을 부드럽게 보간
function vnoise(x: number, y: number): number {
const ix = Math.floor(x);
const iy = Math.floor(y);
const fx = smooth(x - ix);
const fy = smooth(y - iy);
return lerp(lerp(hash2(ix, iy), hash2(ix + 1, iy), fx), lerp(hash2(ix, iy + 1), hash2(ix + 1, iy + 1), fx), fy);
}
function glow(ctx: CanvasRenderingContext2D, x: number, y: number, r: number, c: number[], a: number): void {
const g = ctx.createRadialGradient(x, y, 0, x, y, r);
g.addColorStop(0, rgba(c, a));
g.addColorStop(1, rgba(c, 0));
ctx.fillStyle = g;
ctx.fillRect(x - r, y - r, r * 2, r * 2);
}
function rrect(ctx: CanvasRenderingContext2D, x: number, y: number, w: number, h: number, r: number): void {
const rr = Math.min(r, w / 2, h / 2);
ctx.beginPath();
ctx.moveTo(x + rr, y);
ctx.arcTo(x + w, y, x + w, y + h, rr);
ctx.arcTo(x + w, y + h, x, y + h, rr);
ctx.arcTo(x, y + h, x, y, rr);
ctx.arcTo(x, y, x + w, y, rr);
ctx.closePath();
}
// 주기 [초록, 노랑, 빨강] 프레임 수에서 프레임 f 의 신호 상태
function phaseAt(f: number, g: number, y: number, r: number): number {
const total = g + y + r;
const m = ((f % total) + total) % total;
return m < g ? SIG_GREEN : (m < g + y ? SIG_YELLOW : SIG_RED);
}
function stateText(state: number): string {
return state === SIG_GREEN ? TXT_GO : (state === SIG_YELLOW ? TXT_READY : TXT_STOP);
}
// 신호 상태 -> 빨강·노랑·초록 렌즈 밝기 (위에서 아래)
function litOf(state: number): number[] {
return [state === SIG_RED ? 1 : 0, state === SIG_YELLOW ? 1 : 0, state === SIG_GREEN ? 1 : 0];
}
const LENS_RGBS = [RED_RGB, YELLOW_RGB, GREEN_RGB];
// 세로 신호등 머리 — 렌즈 세 개와 켜진 렌즈의 빛 번짐
function drawHead(ctx: CanvasRenderingContext2D, cx: number, cy: number, r: number, lit: number[]): void {
const step = r * 2.5;
rrect(ctx, cx - r * 1.45, cy - step - r * 1.45, r * 2.9, step * 2 + r * 2.9, r * 0.9);
ctx.fillStyle = rgba(INK_RGB, 1);
ctx.fill();
for (let i = 0; i < 3; i += 1) {
const ly = cy + (i - 1) * step;
ctx.beginPath();
ctx.arc(cx, ly, r, 0, PI2);
ctx.fillStyle = rgba(LENS_RGBS[i], 0.2 + 0.8 * lit[i]);
ctx.fill();
if (lit[i] > 0.02) {
glow(ctx, cx, ly, r * 3.2, LENS_RGBS[i], 0.55 * lit[i]);
}
}
}
// 위에서 본 차 — 앞 범퍼가 x, 가운데가 y. 제동 중이면 뒷등이 켜진다
function drawCar(ctx: CanvasRenderingContext2D, x: number, y: number, len: number, wid: number, rgb: number[], braking: boolean): void {
const x0 = x - len;
rrect(ctx, x0, y - wid / 2, len, wid, 6);
ctx.fillStyle = rgba(rgb, 1);
ctx.fill();
rrect(ctx, x - len * 0.62, y - wid / 2 + 3, len * 0.34, wid - 6, 3);
ctx.fillStyle = 'rgba(255,255,255,0.62)';
ctx.fill();
ctx.fillStyle = 'rgba(255,248,214,1)';
ctx.fillRect(x - 3, y - wid / 2 + 2, 3, 4);
ctx.fillRect(x - 3, y + wid / 2 - 6, 3, 4);
ctx.fillStyle = braking ? rgba(RED_RGB, 1) : 'rgba(150,120,150,0.8)';
ctx.fillRect(x0, y - wid / 2 + 2, 3, 4);
ctx.fillRect(x0, y + wid / 2 - 6, 3, 4);
if (braking) {
glow(ctx, x0, y, 12, RED_RGB, 0.45);
}
}
// 한 줄 도로 장면의 바탕 — 잔디 위에 도로띠 하나, 정지선과 횡단보도
function drawLaneBackdrop(ctx: CanvasRenderingContext2D, roadY: number, roadH: number, stopX: number, seedTrees: number): void {
ctx.fillStyle = rgba(GRASS_RGB, 1);
ctx.fillRect(0, 0, W, H);
const rnd = mulberry32(seedTrees);
for (let i = 0; i < 14; i += 1) {
const tx = 16 + rnd() * (W - 32);
const up = rnd() < 0.5;
const ty = up ? roadY - roadH / 2 - 22 - rnd() * 26 : roadY + roadH / 2 + 22 + rnd() * 26;
ctx.beginPath();
ctx.arc(tx, ty, 9 + rnd() * 6, 0, PI2);
ctx.fillStyle = 'rgba(160,214,184,0.9)';
ctx.fill();
}
ctx.fillStyle = rgba(ROAD_RGB, 1);
ctx.fillRect(0, roadY - roadH / 2, W, roadH);
ctx.fillStyle = rgba(ROAD_EDGE_RGB, 1);
ctx.fillRect(0, roadY - roadH / 2, W, 2);
ctx.fillRect(0, roadY + roadH / 2 - 2, W, 2);
ctx.fillStyle = rgba(MARK_RGB, 0.8);
for (let x = 6; x < W; x += 36) {
ctx.fillRect(x, roadY - 1, 18, 2);
}
for (let k = 0; k < 5; k += 1) {
ctx.fillRect(stopX + 5, roadY - roadH / 2 + 3 + k * (roadH - 6) / 5, 12, (roadH - 6) / 5 - 3);
}
ctx.fillRect(stopX - 2, roadY - roadH / 2, 3, roadH);
}
interface Car { x: number; v: number; len: number; rgb: number[]; go: boolean; decided: boolean; sigK: number; brake: boolean; id: number; }
interface Sig { x: number; state: number; }
interface LaneParams { accel: number; brake: number; gap: number; lineGap: number; vmax: number; headway: number; delta: number; len: number; }
// 한 줄 차량 흐름 — 앞차 간격(IDM)과 정지선을 같은 식으로 다룬다. 차는 앞쪽부터 0번이다
class Lane {
cars: Car[] = [];
p: LaneParams;
rnd: () => number;
nextAt = 0;
made = 0;
constructor(seed: number, p: LaneParams) {
this.p = p;
this.rnd = mulberry32(seed);
}
accelFor(v: number, s: number, vL: number, g0: number): number {
const p = this.p;
const sStar = g0 + Math.max(0, v * p.headway + v * (v - vL) / (2 * Math.sqrt(p.accel * p.brake)));
return p.accel * (1 - Math.pow(v / p.vmax, p.delta) - Math.pow(sStar / Math.max(s, 0.5), 2));
}
// f 프레임에, 뒤쪽이 비어 있고 때가 됐으면 한 대 들여보낸다
maybeSpawn(f: number, minGap: number, maxGap: number, v0: number): boolean {
if (f < this.nextAt) { return false; }
const last = this.cars.length > 0 ? this.cars[this.cars.length - 1] : null;
if (last && last.x - last.len < this.p.gap + 10) { return false; }
const rgb = CAR_RGBS[this.made % CAR_RGBS.length];
this.cars.push({ x: -2, v: v0, len: this.p.len, rgb: rgb, go: false, decided: false, sigK: -1, brake: false, id: this.made });
this.made += 1;
this.nextAt = f + minGap + Math.floor(this.rnd() * (maxGap - minGap + 1));
return true;
}
// 신호 목록은 x 오름차순. 한 번 호출 = 한 프레임. 정지선을 넘은 차(detect 용) id 를 돌려준다
step(sigs: Sig[], onCross: (c: Car, x: number) => void, watchX: number): void {
const p = this.p;
for (let i = 0; i < this.cars.length; i += 1) {
const c = this.cars[i];
let acc = this.accelFor(c.v, 1e6, c.v, p.gap);
if (i > 0) {
const L = this.cars[i - 1];
acc = Math.min(acc, this.accelFor(c.v, (L.x - L.len) - c.x, L.v, p.gap));
}
let k = -1;
for (let j = 0; j < sigs.length; j += 1) {
if (sigs[j].x >= c.x) { k = j; break; }
}
let clampX = 1e9;
if (k >= 0) {
const sg = sigs[k];
if (c.sigK !== k) { c.sigK = k; c.decided = false; c.go = false; }
if (sg.state === SIG_GREEN) {
c.decided = false;
c.go = false;
} else {
if (!c.decided) {
c.decided = true;
c.go = c.v * c.v / (2 * p.brake) > sg.x - c.x;
}
if (!c.go) {
acc = Math.min(acc, this.accelFor(c.v, sg.x - c.x - 2, 0, p.lineGap));
clampX = sg.x - 1.5;
}
}
}
acc = Math.max(acc, -p.brake * 3);
const prevX = c.x;
c.v = Math.max(0, c.v + acc);
c.x += c.v;
if (c.x > clampX && prevX <= clampX) {
c.x = clampX;
c.v = 0;
}
c.brake = acc < -0.012 || c.v < 0.05;
if (prevX < watchX && c.x >= watchX) { onCross(c, watchX); }
}
while (this.cars.length > 0 && this.cars[0].x - this.cars[0].len > W + 20) {
this.cars.shift();
}
}
// 정지선 뒤에서 서 있는 차 수
waiting(stopX: number): number {
let n = 0;
for (let i = 0; i < this.cars.length; i += 1) {
const c = this.cars[i];
if (c.v < 0.25 && c.x < stopX + 2 && c.x > stopX - 260) { n += 1; }
}
return n;
}
}
function main(rootEl: HTMLElement, canvas: HTMLCanvasElement, statusEl: HTMLElement, btnEl: HTMLButtonElement): () => void {
const ctx0 = canvas.getContext('2d');
if (!ctx0) { return function (): void { return; }; }
canvas.width = W;
canvas.height = H;
const reduce = window.matchMedia('(prefers-reduced-motion: reduce)').matches;
const scene = makeScene(ctx0, reduce);
if (reduce) { rootEl.classList.remove('is-demo'); }
let paused = false;
let rafId = 0;
let lastTs: number | null = null;
let accMs = 0;
let lastLabel = '';
let px = W / 2;
let py = H / 2;
const cleaners: Array<() => void> = [];
function listen(target: EventTarget, type: string, fn: (e: Event) => void): void {
target.addEventListener(type, fn);
cleaners.push(function (): void { target.removeEventListener(type, fn); });
}
function show(): void {
scene.draw();
const t = scene.label();
if (t !== lastLabel) {
lastLabel = t;
statusEl.textContent = t;
}
}
function advance(ms: number): void {
const n = Math.round(ms / FIXED_DT);
for (let i = 0; i < n; i += 1) { scene.step(); }
}
function setButton(): void {
btnEl.textContent = reduce ? '다음 장면' : (paused ? '재생' : '멈춤');
}
function toLocal(e: PointerEvent): Pt {
const r = canvas.getBoundingClientRect();
return [clamp((e.clientX - r.left) * W / r.width, 0, W), clamp((e.clientY - r.top) * H / r.height, 0, H)];
}
function moved(): void {
if (scene.point) { scene.point(px, py); }
if (reduce) { show(); }
}
function onButton(): void {
if (reduce) {
advance(REDUCE_STEP_MS);
show();
return;
}
paused = !paused;
if (paused) { rootEl.classList.remove('is-demo'); } else { rootEl.classList.add('is-demo'); }
setButton();
}
function onAction(): void {
if (scene.tap) {
scene.tap();
if (reduce) { show(); }
return;
}
onButton();
}
function tick(ts: number): void {
if (lastTs === null) { lastTs = ts; }
const frameDt = Math.min(ts - lastTs, 160);
lastTs = ts;
if (!paused) {
accMs += frameDt;
while (accMs >= FIXED_DT) {
scene.step();
accMs -= FIXED_DT;
}
show();
}
rafId = requestAnimationFrame(tick);
}
listen(btnEl, 'click', function (): void { onButton(); });
listen(canvas, 'pointerdown', function (e: Event): void {
const p = toLocal(e as PointerEvent);
px = p[0];
py = p[1];
moved();
if (scene.tap) {
scene.tap();
if (reduce) { show(); }
}
});
listen(canvas, 'pointermove', function (e: Event): void {
const p = toLocal(e as PointerEvent);
px = p[0];
py = p[1];
moved();
});
listen(canvas, 'keydown', function (e: Event): void {
const k = (e as KeyboardEvent).key;
if (k === 'Enter' || k === ' ') {
e.preventDefault();
onAction();
return;
}
let dx = 0;
let dy = 0;
if (k === 'ArrowLeft') { dx = -KEY_STEP; } else if (k === 'ArrowRight') { dx = KEY_STEP; }
else if (k === 'ArrowUp') { dy = -KEY_STEP; } else if (k === 'ArrowDown') { dy = KEY_STEP; }
else { return; }
e.preventDefault();
px = clamp(px + dx, 0, W);
py = clamp(py + dy, 0, H);
moved();
});
advance(REDUCE_START_MS);
setButton();
show();
if (!reduce) {
rafId = requestAnimationFrame(tick);
}
function destroy(): void {
cancelAnimationFrame(rafId);
for (let i = 0; i < cleaners.length; i += 1) { cleaners[i](); }
}
return destroy;
}
const SAMPLE_EVERY = 6;
const GRAPH_POINTS = 56;
const Y_MAX_CARS = 10;
const LINE_SMOOTH = 0.5;
const STOP_LINE_X = 300;
const ROAD_Y = 58;
const ROAD_H = 44;
const CAR_LEN = 24;
const CAR_WID = 16;
const GREEN_LEN = 110;
const YELLOW_LEN = 24;
const RED_LEN = 160;
const GRAPH_X0 = 44;
const GRAPH_X1 = 450;
const GRAPH_Y0 = 236;
const GRAPH_Y1 = 128;
const SEED = 446;
function makeScene(ctx: CanvasRenderingContext2D, reduce: boolean): Scene {
const lane = new Lane(SEED, { accel: 0.04, brake: 0.07, gap: 10, lineGap: 3, vmax: 2, headway: 10, delta: 4, len: CAR_LEN });
const sig: Sig = { x: STOP_LINE_X, state: SIG_GREEN };
const sigs: Sig[] = [sig];
const hist: number[] = [];
const histState: number[] = [];
let f = 0;
function none(c: Car, x: number): void { return; }
function sample(): void {
hist.push(lane.waiting(STOP_LINE_X));
histState.push(sig.state);
if (hist.length > GRAPH_POINTS + 1) {
hist.shift();
histState.shift();
}
}
function px(i: number, shift: number): number {
return GRAPH_X1 - (hist.length - 1 - i + shift) * (GRAPH_X1 - GRAPH_X0) / GRAPH_POINTS;
}
function py(v: number): number {
return GRAPH_Y0 - clamp(v / Y_MAX_CARS, 0, 1) * (GRAPH_Y0 - GRAPH_Y1);
}
const scene: Scene = {
step: function (): void {
f += 1;
sig.state = phaseAt(f, GREEN_LEN, YELLOW_LEN, RED_LEN);
lane.maybeSpawn(f, 22, 44, 1.8);
lane.step(sigs, none, -1);
if (f % SAMPLE_EVERY === 0) { sample(); }
},
label: function (): string { return stateText(sig.state); },
draw: function (): void {
drawLaneBackdrop(ctx, ROAD_Y, ROAD_H, STOP_LINE_X, 7);
ctx.fillStyle = rgba(GRASS_RGB, 1);
ctx.fillRect(0, 108, W, 192);
for (let i = 0; i < lane.cars.length; i += 1) {
const c = lane.cars[i];
drawCar(ctx, c.x, ROAD_Y, c.len, CAR_WID, c.rgb, c.brake);
}
drawHead(ctx, STOP_LINE_X + 18, ROAD_Y - ROAD_H / 2 - 22, 6, litOf(sig.state));
// 그래프 판
rrect(ctx, GRAPH_X0 - 26, GRAPH_Y1 - 14, GRAPH_X1 - GRAPH_X0 + 40, GRAPH_Y0 - GRAPH_Y1 + 26, 10);
ctx.fillStyle = 'rgba(255,255,255,0.92)';
ctx.fill();
ctx.save();
ctx.beginPath();
ctx.rect(GRAPH_X0, GRAPH_Y1 - 6, GRAPH_X1 - GRAPH_X0, GRAPH_Y0 - GRAPH_Y1 + 8);
ctx.clip();
const shift = reduce ? 0 : (f % SAMPLE_EVERY) / SAMPLE_EVERY;
const n = hist.length;
// 신호 색 띠 — 그 순간의 신호가 뒤에 깔린다
for (let i = 0; i < n; i += 1) {
const x0 = px(i, shift);
const x1 = px(i + 1, shift);
ctx.fillStyle = rgba(SIGNAL_RGBS[histState[i]], 0.2);
ctx.fillRect(x0, GRAPH_Y1 - 6, Math.max(x1 - x0, 0) + (i < n - 1 ? 1 : 0), GRAPH_Y0 - GRAPH_Y1 + 8);
}
// 눈금선
ctx.strokeStyle = 'rgba(58,52,84,0.14)';
ctx.lineWidth = 1;
for (let v = 0; v <= Y_MAX_CARS; v += 2) {
ctx.beginPath();
ctx.moveTo(GRAPH_X0, py(v));
ctx.lineTo(GRAPH_X1, py(v));
ctx.stroke();
}
if (n > 2) {
// 선 — 이웃 점의 중간점을 이어 곡선으로. LINE_SMOOTH 가 0 이면 꺾은선, 1 이면 완전한 곡선
let sx = px(0, shift);
let sy = py(hist[0]);
ctx.beginPath();
ctx.moveTo(sx, sy);
for (let i = 1; i < n; i += 1) {
const bx = px(i, shift);
const by = py(hist[i]);
const ex = i < n - 1 ? (bx + px(i + 1, shift)) / 2 : bx;
const ey = i < n - 1 ? (by + py(hist[i + 1])) / 2 : by;
ctx.quadraticCurveTo(lerp((sx + ex) / 2, bx, LINE_SMOOTH), lerp((sy + ey) / 2, by, LINE_SMOOTH), ex, ey);
sx = ex;
sy = ey;
}
ctx.lineWidth = 3;
ctx.lineJoin = 'round';
ctx.strokeStyle = rgba(INK_RGB, 1);
ctx.stroke();
ctx.lineTo(px(n - 1, shift), GRAPH_Y0);
ctx.lineTo(px(0, shift), GRAPH_Y0);
ctx.closePath();
ctx.fillStyle = 'rgba(170,150,230,0.28)';
ctx.fill();
}
ctx.restore();
if (n > 0) {
ctx.beginPath();
ctx.arc(px(n - 1, shift), py(hist[n - 1]), 5, 0, PI2);
ctx.fillStyle = rgba(INK_RGB, 1);
ctx.fill();
}
ctx.fillStyle = rgba(INK_RGB, 0.9);
ctx.font = '500 10px ' + FONT;
ctx.textAlign = 'right';
for (let v = 0; v <= Y_MAX_CARS; v += 4) {
ctx.fillText(String(v), GRAPH_X0 - 6, py(v) + 3);
}
ctx.textAlign = 'center';
}
};
for (let i = 0; i < 420; i += 1) { scene.step(); }
return scene;
}
export default function TlQueueLengthLiveGraph() {
const rootRef = useRef<HTMLDivElement | null>(null);
const canvasRef = useRef<HTMLCanvasElement | null>(null);
const statusRef = useRef<HTMLParagraphElement | null>(null);
const btnRef = useRef<HTMLButtonElement | null>(null);
useEffect(() => {
const root = rootRef.current;
const canvas = canvasRef.current;
const statusEl = statusRef.current;
const btnEl = btnRef.current;
if (!root || !canvas || !statusEl || !btnEl) return;
return main(root, canvas, statusEl, btnEl);
}, []);
return (
<main className={styles.stage}>
<div className={`${styles.sc} is-demo`} ref={rootRef}>
<canvas className={styles.sc__canvas} ref={canvasRef} width={480} height={300} tabIndex={0} aria-label="줄 길이가 신호 주기마다 오르내리는 실시간 그래프" />
<p className={styles.sc__status} ref={statusRef} aria-live="polite">초록불 — 진행</p>
<button className={styles.sc__btn} ref={btnRef} type="button">멈춤</button>
<p className={styles.sc__caption}>줄 길이가 신호 주기마다 오르내리는 실시간 그래프</p>
</div>
</main>
);
}07 A Live Graph of Queue Length Rising and Falling Each Cycle — Measured area 29.664% · moving frames 23/23Original by GODRICH · SCSS and React ship in the zip · Traffic Light CSS: 9 Demos With Queues and Waves
The post this demo lives in
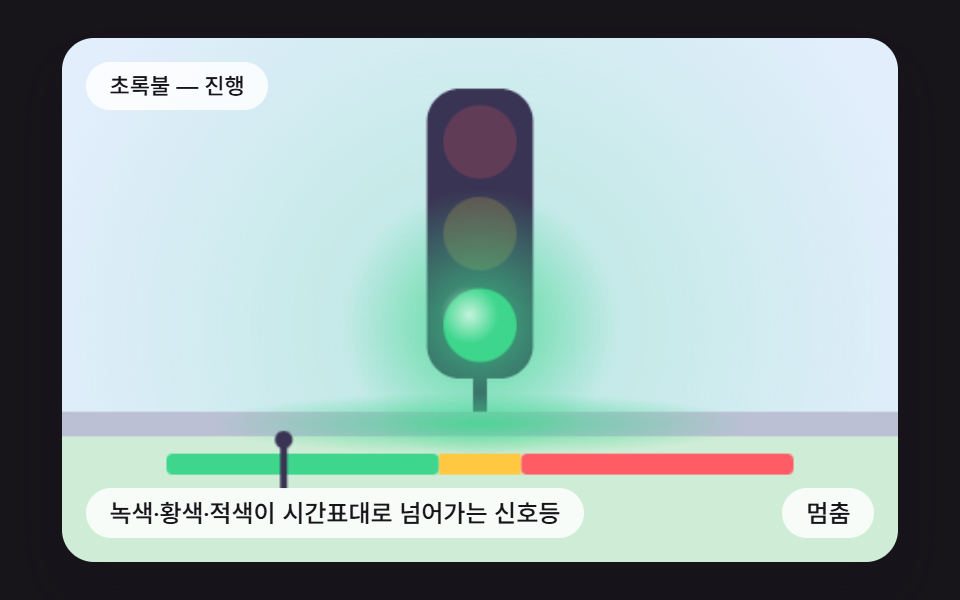 Traffic Light CSS: 9 Demos With Queues and WavesA traffic light css built as a color-swapping timer lets cars roll through red, signals drift out of step and pedestrian See all demos in this post
If you like this effect - similar demos
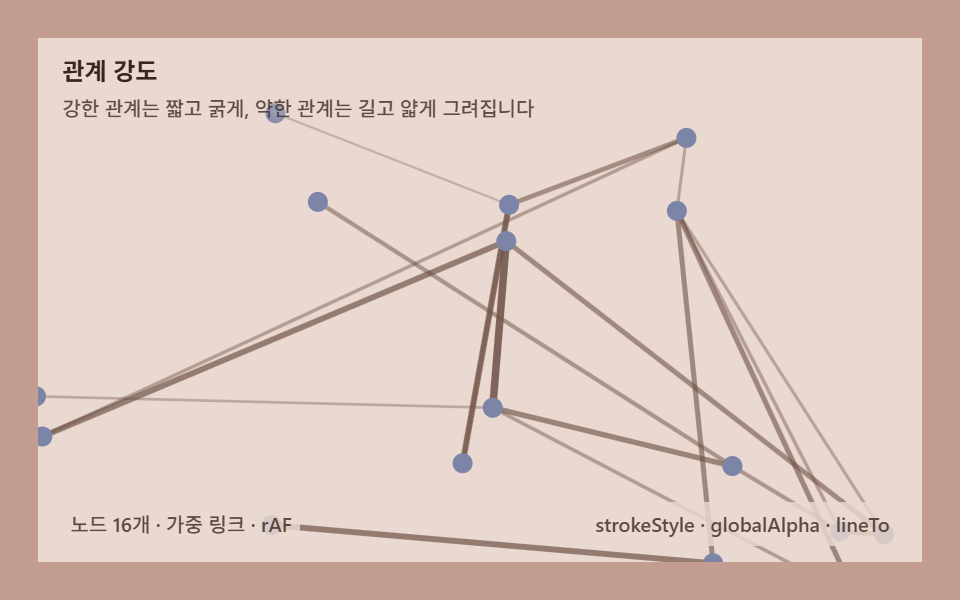 Creative UI07 Relationship weight — weight rewrites link length and thicknessForce Directed Graph: 9 Network Layout Demos
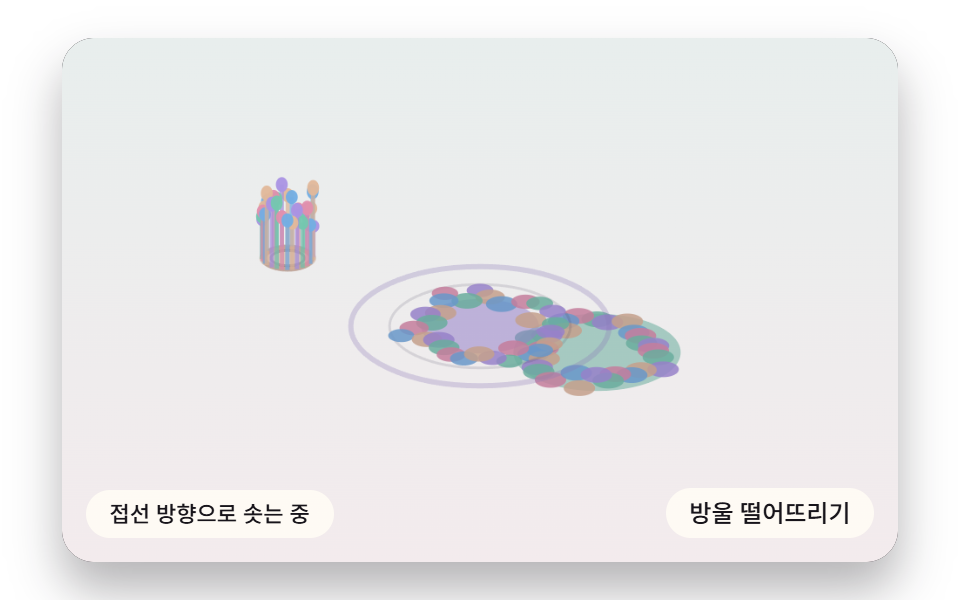 Creative UI06 Ink Rising Off the Impact Ring and Falling Back as a CrownMarble Effect CSS: 9 Ink, Comb and Agate Patterns
 Creative UI05 Lava lamp — blobs rising on buoyancy and heat9 Metaball Effect Scenes, Marching Squares Canvas