01Spring Bars That Grow in Start-Date Order on a Date-to-Pixel Scale
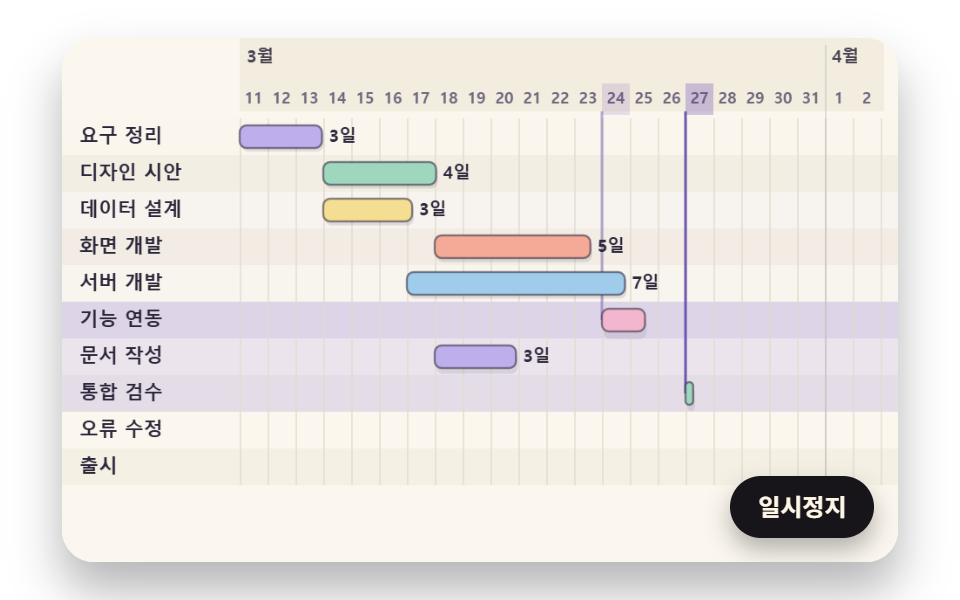
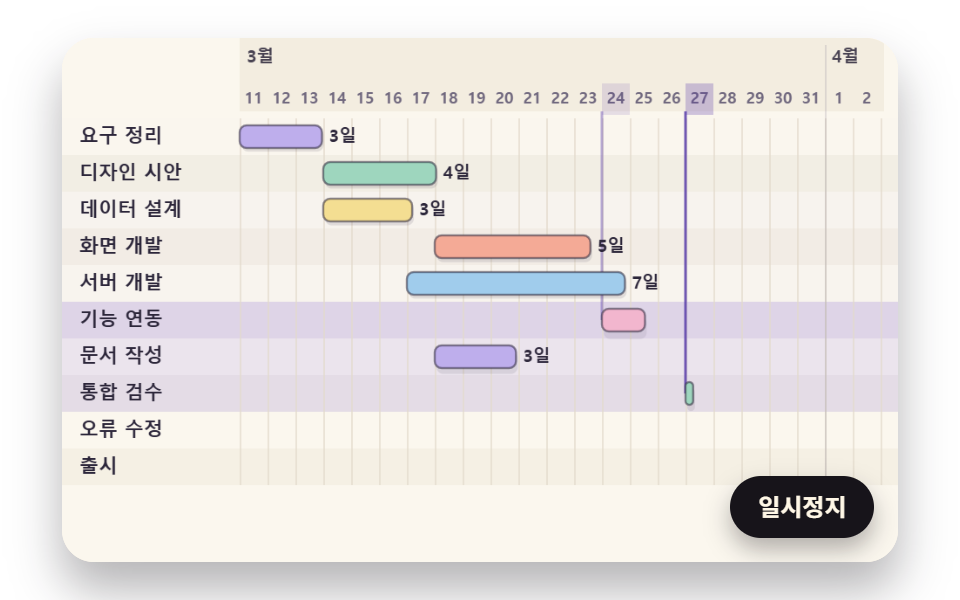
Each date becomes a whole-day count from a fixed start day times one day's width to set a bar's start and length, and bars widen on a damped spring in start-date order, overshooting slightly before they settle.
Best forFirst load of a project management dashboard
BAR_STIFFNESSBAR_DAMPINGBAR_STAGGER_MS
<main class="stage">
<div class="cf is-demo" id="cf">
  <canvas class="cf__canvas" data-role="canvas" width="480" height="300" role="img" aria-label="Ten task bars placed at day count times one day width, springing out in start-date order."></canvas>
  <table class="cf__sr" data-role="table"></table>
  <button class="cf__pause" data-role="pause" type="button" aria-pressed="false">Pause</button>
</div>
</main>
@use "../../../../site/static/demo-tokens" as *;
@include stage($stage-paper);
.cf {
position: relative;
width: min(92vw, calc(160vh - 12.8vw));
aspect-ratio: 480 / 300;
margin: 0 auto;
border-radius: $r-card;
overflow: hidden;
box-shadow: $shadow-raised;
background: $subject-cream;
}
.cf__canvas {
position: absolute;
inset: 0;
display: block;
width: 100%;
height: 100%;
}
.cf__pause {
position: absolute;
right: $sp-3;
bottom: $sp-3;
padding: $sp-1 $sp-3;
border: 2px solid $subject-ink;
border-radius: $r-pill;
background: $subject-ink;
color: $subject-cream;
font-family: inherit;
font-weight: 700;
font-size: 12px;
line-height: 1.6;
cursor: pointer;
box-shadow: $shadow-press;
transition: transform $dur-quick $ease-spring;
}
// 눌린 상태(멈춤) — 바탕과 글자색을 뒤집어 aria-pressed 가 눈에도 보이게
.cf__pause[aria-pressed="true"] {
background: $subject-cream;
color: $subject-ink;
}
.cf__pause:hover {
transform: translateY(-2px);
}
.cf__pause:active {
transform: translateY(1px);
}
.cf__pause:focus-visible {
outline: 3px solid $subject-ink;
outline-offset: 3px;
}
// 상태 줄 — 지금 일정에 무슨 일이 일어났는지 글자로. 시연 중에는 aria-live off, 사람이 처음 손대면 polite
.cf__status {
position: absolute;
left: $sp-3;
bottom: $sp-3;
max-width: calc(100% - 120px);
margin: 0;
padding: $sp-1 $sp-3;
border-radius: $r-pill;
background: $subject-ink;
color: $subject-cream;
font-weight: 700;
font-size: 11px;
line-height: 1.6;
white-space: nowrap;
overflow: hidden;
text-overflow: ellipsis;
pointer-events: none;
}
// 숨김 표 — 화면에서는 1px 로 접어 두고 화면 읽기 도구만 읽는다
.cf__sr {
position: absolute;
width: 1px;
height: 1px;
margin: -1px;
padding: 0;
overflow: hidden;
clip: rect(0 0 0 0);
clip-path: inset(50%);
white-space: nowrap;
border: 0;
}
@media (max-width: 340px) {
.cf__pause,
.cf__status { font-size: 10px; padding: $sp-1 $sp-2; }
}
// 동작 줄이기 — 장면은 스크립트가 최종 배치 한 장으로 멈춘다. 버튼도 떠오르지 않게
@media (prefers-reduced-motion: reduce) {
.cf__pause { transition: none !important; }
.cf__pause:hover,
.cf__pause:active { transform: none !important; }
}html, body {
margin: 0;
overflow: hidden;
}
.stage {
box-sizing: border-box;
min-height: 100vh;
display: grid;
place-items: center;
margin: 0;
background: #ffffff;
font-family: -apple-system, "Segoe UI", "Noto Sans KR", sans-serif;
padding: clamp(8px, 4vw, 24px);
}
.cf {
position: relative;
width: min(92vw, 160vh - 12.8vw);
aspect-ratio: 480/300;
margin: 0 auto;
border-radius: 16px;
overflow: hidden;
box-shadow: 0 14px 24px rgba(23, 20, 26, 0.32);
background: #fff7e6;
}
.cf__canvas {
position: absolute;
inset: 0;
display: block;
width: 100%;
height: 100%;
}
.cf__pause {
position: absolute;
right: 12px;
bottom: 12px;
padding: 4px 12px;
border: 2px solid #17141a;
border-radius: 999px;
background: #17141a;
color: #fff7e6;
font-family: inherit;
font-weight: 700;
font-size: 12px;
line-height: 1.6;
cursor: pointer;
box-shadow: 0 6px 12px rgba(23, 20, 26, 0.32);
transition: transform 220ms cubic-bezier(0.2, 0.8, 0.2, 1);
}
.cf__pause[aria-pressed=true] {
background: #fff7e6;
color: #17141a;
}
.cf__pause:hover {
transform: translateY(-2px);
}
.cf__pause:active {
transform: translateY(1px);
}
.cf__pause:focus-visible {
outline: 3px solid #17141a;
outline-offset: 3px;
}
.cf__status {
position: absolute;
left: 12px;
bottom: 12px;
max-width: calc(100% - 120px);
margin: 0;
padding: 4px 12px;
border-radius: 999px;
background: #17141a;
color: #fff7e6;
font-weight: 700;
font-size: 11px;
line-height: 1.6;
white-space: nowrap;
overflow: hidden;
text-overflow: ellipsis;
pointer-events: none;
}
.cf__sr {
position: absolute;
width: 1px;
height: 1px;
margin: -1px;
padding: 0;
overflow: hidden;
clip: rect(0 0 0 0);
clip-path: inset(50%);
white-space: nowrap;
border: 0;
}
@media (max-width: 340px) {
.cf__pause,
.cf__status {
font-size: 10px;
padding: 4px 8px;
}
}
@media (prefers-reduced-motion: reduce) {
.cf__pause {
transition: none !important;
}
.cf__pause:hover,
.cf__pause:active {
transform: none !important;
}
}(function () {
const root = document.getElementById("cf");
if (!root) return;
// 판 좌표 — 캔버스 안은 늘 480×300. 화면에 보이는 크기와 상관없이 계산은 이 좌표로 한다
const W = 480;
const H = 300;
const TAU = Math.PI * 2;
function clamp(v, lo, hi) { return v < lo ? lo : (v > hi ? hi : v); }
function lerp(a, b, k) { return a + (b - a) * k; }
function smooth(x) { const c = clamp(x, 0, 1); return c * c * (3 - 2 * c); }
// 따라가기 비율 — 1 − e^(−rate·dt). 프레임 시간이 달라도 1초에 같은 만큼 다가간다
function follow(rate, dt) { return 1 - Math.exp(-rate * dt); }
// 시드 고정 난수 — 같은 시드면 같은 일정이 다시 나온다 (32비트 정수 섞기)
function makeRng(seed) {
let s = seed >>> 0;
return function () {
s = (s + 0x6d2b79f5) >>> 0;
let t = s;
t = Math.imul(t ^ (t >>> 15), t | 1);
t ^= t + Math.imul(t ^ (t >>> 7), t | 61);
return ((t ^ (t >>> 14)) >>> 0) / 4294967296;
};
}
function makeSpring(x) { return { x: x, v: 0, to: x }; }
const SPRING_SUBSTEP = 1 / 240;
function stepSpring(s, stiffness, damping, dt) {
let left = dt;
while (left > 1e-9) {
const h = Math.min(SPRING_SUBSTEP, left);
s.v += (stiffness * (s.to - s.x) - damping * s.v) * h;
s.x += s.v * h;
left -= h;
}
}
function snapSpring(s, x) { s.x = x; s.v = 0; s.to = x; }
// ── 날짜 = 정수 일수 ─────────────────────────────────────────
// 날짜 객체를 쓰지 않는다. 기준일을 0 으로 세는 정수 일수(day index)만 다루고, 화면의 월·일 숫자는 아래 월 길이 표로 산수해 만든다
const MONTH_DAYS = [31, 28, 31, 30, 31, 30, 31, 31, 30, 31, 30, 31];
const YEAR_DAYS = 365;
// 기준일(일수 0) = 한 해의 70번째 날 → 표로 세면 3월 11일
const DAY_ZERO_OF_YEAR = 69;
function calendarOf(day) {
let r = ((day + DAY_ZERO_OF_YEAR) % YEAR_DAYS + YEAR_DAYS) % YEAR_DAYS;
let m = 0;
while (r >= MONTH_DAYS[m]) {
r -= MONTH_DAYS[m];
m += 1;
}
return [m + 1, r + 1];
}
const DAY_FMT = 'Day {n}';
const WEEK_FMT = 'Week {n}';
const MONTH_FMT = 'Month {n}';
const SLACK_FMT = '{n}d';
function dayText(day) { return DAY_FMT.replace('{n}', String(day + 1)); }
// 하루 차 계산의 함정 — 시각(시간 단위)끼리 빼서 24 로 나누면, 시계가 한 시간 당겨진 날이 끼었을 때 정수가 아니다(23시간짜리 하루).
// 그래서 바깥에서 들어온 시각은 반올림으로 정수 일수에 붙이고, 그다음부터는 정수끼리만 더하고 뺀다
const HOURS_PER_DAY = 24;
const CLOCK_SHIFT_HOURS = 1;
function hoursToDayIndex(hours) { return Math.round(hours / HOURS_PER_DAY); }
const BASE_TASKS = [
{ name: 'Requirements', dur: 3, deps: [], load: 2 },
{ name: 'Design draft', dur: 4, deps: [0], load: 1 },
{ name: 'Data design', dur: 3, deps: [0], load: 1 },
{ name: 'UI build', dur: 5, deps: [1], load: 2 },
{ name: 'Server build', dur: 7, deps: [2], load: 1 },
{ name: 'Integration', dur: 3, deps: [3, 4], load: 2 },
{ name: 'Docs', dur: 3, deps: [1], load: 1 },
{ name: 'QA review', dur: 3, deps: [5], load: 2 },
{ name: 'Bug fixes', dur: 2, deps: [7], load: 1 },
{ name: 'Launch', dur: 0, deps: [8, 6], load: 0 }
];
function copyTasks(ts) { return ts.map(function (t) { return { name: t.name, dur: t.dur, deps: t.deps.slice(), load: t.load }; }); }
function successorsOf(tasks) {
const out = tasks.map(function () { return []; });
tasks.forEach(function (t, i) { t.deps.forEach(function (p) { out[p].push(i); }); });
return out;
}
function sortByDeps(tasks) {
const succ = successorsOf(tasks);
const waiting = tasks.map(function (t) { return t.deps.length; });
const ready = [];
waiting.forEach(function (w, i) { if (w === 0) {
ready.push(i);
} });
const order = [];
while (ready.length) {
ready.sort(function (a, b) { return a - b; });
const i = ready.shift();
order.push(i);
succ[i].forEach(function (j) { waiting[j] -= 1; if (waiting[j] === 0) {
ready.push(j);
} });
}
const stuck = [];
waiting.forEach(function (w, i) { if (w > 0) {
stuck.push(i);
} });
return { order: order, stuck: stuck };
}
function sweepBoth(tasks, order, minStart) {
const n = tasks.length;
const es = new Array(n).fill(0);
const ef = new Array(n).fill(0);
for (const i of order) {
let s = minStart ? minStart[i] : 0;
for (const p of tasks[i].deps) {
s = Math.max(s, ef[p]);
}
es[i] = s;
ef[i] = s + tasks[i].dur;
}
let end = 0;
for (const i of order) {
end = Math.max(end, ef[i]);
}
const succ = successorsOf(tasks);
const ls = new Array(n).fill(0);
const lf = new Array(n).fill(0);
for (let k = order.length - 1; k >= 0; k -= 1) {
const i = order[k];
let f = end;
for (const j of succ[i]) {
f = Math.min(f, ls[j]);
}
lf[i] = f;
ls[i] = f - tasks[i].dur;
}
const slack = es.map(function (s, i) { return ls[i] - s; });
return { es: es, ef: ef, ls: ls, lf: lf, slack: slack, end: end };
}
function pushFrom(tasks, starts, from) {
const succ = successorsOf(tasks);
const out = starts.slice();
const depth = tasks.map(function () { return -1; });
depth[from] = 0;
const queue = [from];
let head = 0;
// 고리가 있어도 끝나도록 꺼내는 횟수에 상한을 둔다
const limit = tasks.length * tasks.length + 1;
while (head < queue.length && head < limit) {
const i = queue[head];
head += 1;
for (const j of succ[i]) {
let need = 0;
for (const p of tasks[j].deps) {
need = Math.max(need, out[p] + tasks[p].dur);
}
if (need > out[j]) {
out[j] = need;
depth[j] = Math.max(depth[j], depth[i] + 1);
queue.push(j);
}
}
}
return { starts: out, depth: depth };
}
// 날마다 걸린 일감 — 작업이 덮는 날(시작 ≤ 날 < 시작 + 일수)마다 사람 수를 더한다
function dailyLoad(tasks, starts, days) {
const load = new Array(days).fill(0);
tasks.forEach(function (t, i) {
for (let d = starts[i]; d < starts[i] + t.dur; d += 1) {
if (d >= 0 && d < days) {
load[d] += t.load;
}
}
});
return load;
}
// ── 직각 경로 ───────────────────────────────────────────────
// 앞 끝(ex, ey)에서 오른쪽으로 ROUTE_STUB 나간 뒤 아래로 꺾는다. 뒤 시작(sx)이 그 꺾인 자리 + ROUTE_STUB 보다 오른쪽이면 곧장 내려가 오른쪽으로 들어가고,
// 아니면 앞 행 바로 아래 통로(gapY)까지 내려가 왼쪽으로 돌아간 다음 뒤 시작보다 ROUTE_STUB 앞에서 내려가 오른쪽으로 들어간다
const ROUTE_STUB = 7;
function elbowRoute(ex, ey, sx, sy, gapY) {
const x1 = ex + ROUTE_STUB;
if (sx - ROUTE_STUB >= x1) {
return [ex, ey, x1, ey, x1, sy, sx, sy];
}
const x2 = sx - ROUTE_STUB;
return [ex, ey, x1, ey, x1, gapY, x2, gapY, x2, sy, sx, sy];
}
function routeLength(pts) {
let s = 0;
for (let i = 2; i < pts.length; i += 2) {
s += Math.hypot(pts[i] - pts[i - 2], pts[i + 1] - pts[i - 1]);
}
return s;
}
// 경로 위 거리 dist 자리의 점과 그 마디의 방향
function pointOnRoute(pts, dist) {
let left = Math.max(0, dist);
for (let i = 2; i < pts.length; i += 2) {
const dx = pts[i] - pts[i - 2];
const dy = pts[i + 1] - pts[i - 1];
const len = Math.hypot(dx, dy);
if (left <= len || i === pts.length - 2) {
const k = len > 0 ? Math.min(1, left / len) : 0;
return [pts[i - 2] + dx * k, pts[i - 1] + dy * k, len > 0 ? dx / len : 1, len > 0 ? dy / len : 0];
}
left -= len;
}
return [pts[0], pts[1], 1, 0];
}
// 경로를 앞에서부터 dist 만큼만 자른 점 목록 — 화살표가 그려져 나가는 장면에 쓴다
function cutRoute(pts, dist) {
const out = [pts[0], pts[1]];
let left = Math.max(0, dist);
for (let i = 2; i < pts.length; i += 2) {
const len = Math.hypot(pts[i] - pts[i - 2], pts[i + 1] - pts[i - 1]);
if (left >= len) {
out.push(pts[i], pts[i + 1]);
left -= len;
continue;
}
const k = len > 0 ? left / len : 0;
out.push(lerp(pts[i - 2], pts[i], k), lerp(pts[i - 1], pts[i + 1], k));
break;
}
return out;
}
// 장면 시계(초)와 상태 줄 글자 — 장면 계산이 고치고, 화면 쪽이 읽어 그린다
let sceneT = 0;
let simStatus = '';
// 파스텔 팔레트 — 크림 바탕 위 라벤더·민트·버터·산호 막대. 가장 긴 경로·오늘 선·글자는 진한 쪽으로 명도 차를 둔다
const PAPER = [251, 247, 238];
const PAPER_DIM = [243, 237, 224];
const GRID = [226, 218, 204];
const INK = [44, 38, 58];
const INK_SOFT = [112, 104, 126];
const CREAM = [255, 251, 242];
const LAVENDER = [190, 174, 236];
const MINT = [158, 214, 190];
const BUTTER = [244, 222, 146];
const CORAL = [244, 170, 150];
const SKY = [160, 204, 236];
const PINK = [242, 182, 206];
const PATH_DEEP = [86, 56, 168];
const TODAY_DEEP = [190, 72, 60];
const BAR_COLORS = [LAVENDER, MINT, BUTTER, CORAL, SKY, PINK];
function rgba(c, a) {
return 'rgba(' + Math.round(clamp(c[0], 0, 255)) + ',' + Math.round(clamp(c[1], 0, 255)) + ',' + Math.round(clamp(c[2], 0, 255)) + ',' + clamp(a, 0, 1).toFixed(3) + ')';
}
function mix(a, b, k) { return [lerp(a[0], b[0], k), lerp(a[1], b[1], k), lerp(a[2], b[2], k)]; }
// 표 한 줄 — 작업·시작·끝·여유. 끝은 그 작업이 덮는 마지막 날(일수 0 짜리는 시작과 같은 날)
function tableRow(name, start, dur, slack) {
return [name, dayText(start), dayText(start + Math.max(0, dur - 1)), SLACK_FMT.replace('{n}', String(slack))];
}
const canvasEl = root.querySelector('[data-role="canvas"]');
const pauseEl = root.querySelector('[data-role="pause"]');
const tableEl = root.querySelector('[data-role="table"]');
const statusEl = root.querySelector('[data-role="status"]');
const ctxRaw = canvasEl ? canvasEl.getContext('2d') : null;
if (!canvasEl || !ctxRaw || !pauseEl) {
return;
}
const cv = canvasEl;
const ctx = ctxRaw;
const pauseBtn = pauseEl;
const FONT_STACK = 'system-ui, -apple-system, "Segoe UI", "Noto Sans KR", sans-serif';
function fitCanvas() {
// 배율은 2 에서 자른다 — 배율 3 기기에서 화소가 2.25배로 늘어 프레임마다 일이 그만큼 커지지 않게
const dpr = Math.min(window.devicePixelRatio || 1, 2);
cv.width = Math.round(W * dpr);
cv.height = Math.round(H * dpr);
ctx.setTransform(dpr, 0, 0, dpr, 0, 0);
}
function clearStage() {
ctx.fillStyle = rgba(PAPER, 1);
ctx.fillRect(0, 0, W, H);
}
function label(s, x, y, c, a, px, weight, align) {
ctx.font = weight + ' ' + px + 'px ' + FONT_STACK;
ctx.textAlign = align;
ctx.textBaseline = 'middle';
ctx.fillStyle = rgba(c, a);
ctx.fillText(s, x, y);
}
function roundRectPath(x, y, w, h, r) {
const rr = Math.max(0, Math.min(r, w / 2, h / 2));
ctx.beginPath();
ctx.moveTo(x + rr, y);
ctx.lineTo(x + w - rr, y);
ctx.arcTo(x + w, y, x + w, y + rr, rr);
ctx.lineTo(x + w, y + h - rr);
ctx.arcTo(x + w, y + h, x + w - rr, y + h, rr);
ctx.lineTo(x + rr, y + h);
ctx.arcTo(x, y + h, x, y + h - rr, rr);
ctx.lineTo(x, y + rr);
ctx.arcTo(x, y, x + rr, y, rr);
ctx.closePath();
}
// 막대 하나 — 둥근 사각형 채움 + 진한 테두리. 폭이 0 이하이면 그리지 않는다
function bar(x, y, w, h, fill, a, line) {
if (w <= 0.2 || a <= 0) {
return;
}
roundRectPath(x, y, w, h, 4);
ctx.fillStyle = rgba(fill, a);
ctx.fill();
if (line > 0) {
ctx.lineWidth = line;
ctx.strokeStyle = rgba(INK, 0.55 * a);
ctx.stroke();
}
}
// 마일스톤 마름모
function diamond(cx, cy, r, fill, a) {
if (r <= 0.2 || a <= 0) {
return;
}
ctx.beginPath();
ctx.moveTo(cx, cy - r);
ctx.lineTo(cx + r, cy);
ctx.lineTo(cx, cy + r);
ctx.lineTo(cx - r, cy);
ctx.closePath();
ctx.fillStyle = rgba(fill, a);
ctx.fill();
ctx.lineWidth = 1.5;
ctx.strokeStyle = rgba(INK, 0.8 * a);
ctx.stroke();
}
function polyline(pts, c, a, width) {
if (pts.length < 4) {
return;
}
ctx.beginPath();
ctx.moveTo(pts[0], pts[1]);
for (let i = 2; i < pts.length; i += 2) {
ctx.lineTo(pts[i], pts[i + 1]);
}
ctx.lineWidth = width;
ctx.lineJoin = 'round';
ctx.lineCap = 'round';
ctx.strokeStyle = rgba(c, a);
ctx.stroke();
}
function arrowHead(x, y, dx, dy, size, c, a) {
ctx.beginPath();
ctx.moveTo(x, y);
ctx.lineTo(x - dx * size - dy * size * 0.6, y - dy * size + dx * size * 0.6);
ctx.lineTo(x - dx * size + dy * size * 0.6, y - dy * size - dx * size * 0.6);
ctx.closePath();
ctx.fillStyle = rgba(c, a);
ctx.fill();
}
// 빗금 — (x, y, w, h) 안에 45° 줄을 spacing 간격으로. 간격이 좁을수록 짙어 보인다
function hatch(x, y, w, h, spacing, c, a) {
if (w <= 0.5 || a <= 0) {
return;
}
ctx.save();
roundRectPath(x, y, w, h, 3);
ctx.clip();
ctx.beginPath();
for (let s = x - h; s < x + w; s += Math.max(2, spacing)) {
ctx.moveTo(s, y + h);
ctx.lineTo(s + h, y);
}
ctx.lineWidth = 1.6;
ctx.strokeStyle = rgba(c, a);
ctx.stroke();
ctx.restore();
}
// 시간 축 — 위 띠는 월 이름, 아래 띠는 일(월 안의 날 숫자)·주(주차) 층. 층마다 불투명도를 따로 받아 겹쳐 흐려지며 바뀌게 한다.
// 세로 격자도 같은 불투명도로 행 영역(top~bottom)에 긋는다. xOf 는 일수 → 화면 x
function timeAxis(xOf, dayW, d0, d1, left, right, top, bottom, ly) {
ctx.save();
ctx.beginPath();
ctx.rect(left, 0, right - left, H);
ctx.clip();
ctx.fillStyle = rgba(PAPER_DIM, 1);
ctx.fillRect(left, 0, right - left, top - 4);
for (let d = Math.floor(d0); d <= Math.ceil(d1); d += 1) {
const x = xOf(d);
const cal = calendarOf(d);
if (ly.day > 0.01) {
ctx.fillStyle = rgba(GRID, 0.7 * ly.day);
ctx.fillRect(x, top, 1, bottom - top);
if (dayW >= 13) {
label(String(cal[1]), x + dayW / 2, top - 11, INK_SOFT, ly.day, 9, 600, 'center');
}
}
// 주 층 — 글자가 겹치지 않을 만큼(36px) 주를 건너뛰며 적는다
const weekStep = 7 * dayW >= 36 ? 1 : (14 * dayW >= 36 ? 2 : 4);
if (ly.week > 0.01 && d % 7 === 0) {
ctx.fillStyle = rgba(GRID, ly.week);
ctx.fillRect(x, top, 1, bottom - top);
if ((d / 7) % weekStep === 0) {
label(WEEK_FMT.replace('{n}', String(d / 7 + 1)), x + 3, top - 11, INK_SOFT, ly.week, 9, 600, 'left');
}
}
if (cal[1] === 1) {
ctx.fillStyle = rgba(INK_SOFT, 0.18 + 0.4 * ly.month);
ctx.fillRect(x, 4, 1, bottom - 4);
label(MONTH_FMT.replace('{n}', String(cal[0])), x + 4, 11, INK, 0.85, 10, 700, 'left');
// 월 층 — 그달 칸 가운데에 그달 일수(월 길이 표에서)를 적는다
const len = MONTH_DAYS[cal[0] - 1];
if (ly.month > 0.01 && len * dayW >= 30) {
label(SLACK_FMT.replace('{n}', String(len)), x + len * dayW / 2, top - 11, INK_SOFT, ly.month, 9, 700, 'center');
}
}
else if (d === Math.floor(d0)) {
// 왼쪽 끝 월 이름 — 바로 오른쪽에 새 달이 시작하면 겹치므로 적지 않는다
const toNext = MONTH_DAYS[cal[0] - 1] - cal[1] + 1;
if (toNext * dayW >= 44) {
label(MONTH_FMT.replace('{n}', String(cal[0])), Math.max(x, left) + 4, 11, INK, 0.85, 10, 700, 'left');
}
}
}
ctx.restore();
}
// 왼쪽 Task 칸
function rowLabel(name, y, a, bold) {
label(name, 10, y, INK, a, 11, bold ? 800 : 600, 'left');
}
function rowStripe(y, h, i, a) {
if (i % 2 === 1) {
ctx.fillStyle = rgba(PAPER_DIM, 0.75 * a);
ctx.fillRect(0, y, W, h);
}
}
// 움직이는 행 빛 — 그 행 막대의 스프링 속도(k = 0~1)만큼 행 전체가 옅은 라벤더로 밝아진다. 막대가 서면 사라진다
function rowGlow(y, h, k) {
if (k <= 0.01) {
return;
}
ctx.fillStyle = rgba(LAVENDER, 0.42 * clamp(k, 0, 1));
ctx.fillRect(0, y, W, h);
}
// 상태 줄 — 바뀔 때만 글자를 고친다
let shownStatus = '';
function pushStatus() {
if (!statusEl || simStatus === shownStatus) {
return;
}
shownStatus = simStatus;
statusEl.textContent = simStatus;
}
// 숨김 표 — 같은 일정을 작업·시작·끝·여유 열로 읽게. 화면에는 안 보이고 화면 읽기 도구가 읽는다
const TABLE_HEAD = ['Task', 'Start', 'End', 'Slack'];
function fillTable(caption, rows) {
if (!tableEl) {
return;
}
const tb = tableEl;
while (tb.firstChild) {
tb.removeChild(tb.firstChild);
}
const cap = document.createElement('caption');
cap.textContent = caption;
tb.appendChild(cap);
const thead = document.createElement('thead');
const hr = document.createElement('tr');
TABLE_HEAD.forEach(function (h) {
const th = document.createElement('th');
th.scope = 'col';
th.textContent = h;
hr.appendChild(th);
});
thead.appendChild(hr);
tb.appendChild(thead);
const body = document.createElement('tbody');
rows.forEach(function (r) {
const tr = document.createElement('tr');
r.forEach(function (c, k) {
const cell = document.createElement(k === 0 ? 'th' : 'td');
if (k === 0) {
cell.scope = 'row';
}
cell.textContent = c;
tr.appendChild(cell);
});
body.appendChild(tr);
});
tb.appendChild(body);
}
// 01 — 날짜를 픽셀로: x = 막대 칸 왼쪽 + 일수 × 하루 폭. 막대 길이 = 일수 × 하루 폭
const LABEL_W = 96;
const PLOT_X = LABEL_W + 6;
const DAY_WIDTH = 16;
const ROWS_TOP = 46;
const ROW_H = 21;
const BAR_H = 13;
// 폭 성장 스프링 — 0(없음) → 1(제 길이). 감쇠비 = BAR_DAMPING / (2√BAR_STIFFNESS)
const BAR_STIFFNESS = 170;
const BAR_DAMPING = 14;
// 시작일이 이른 순서로 한 막대씩 BAR_STAGGER_MS 늦게 출발
const BAR_STAGGER_MS = 70;
const GROW_START_S = 0.25;
const SHRINK_AT_S = 5.6;
const LOOP_S = 7;
const TABLE_CAPTION = 'Task schedule, grown in start-date order';
const tasks01 = BASE_TASKS;
const plan01 = sweepBoth(tasks01, sortByDeps(tasks01).order, null);
function dayX(d) { return PLOT_X + d * DAY_WIDTH; }
// Start 순위 — 같은 날이면 위 행 먼저
const rank01 = (function () {
const idx = tasks01.map(function (_, i) { return i; });
idx.sort(function (a, b) { return plan01.es[a] - plan01.es[b] || a - b; });
const r = new Array(tasks01.length).fill(0);
idx.forEach(function (i, k) { r[i] = k; });
return r;
})();
const grow01 = tasks01.map(function () { return makeSpring(0); });
function growAt(i) { return GROW_START_S + rank01[i] * BAR_STAGGER_MS / 1000; }
function reset() { grow01.forEach(function (s) { snapSpring(s, 0); }); }
function update(dt) {
grow01.forEach(function (s, i) {
s.to = sceneT >= growAt(i) && sceneT < SHRINK_AT_S ? 1 : 0;
stepSpring(s, BAR_STIFFNESS, BAR_DAMPING, dt);
});
}
function restPose() { grow01.forEach(function (s) { snapSpring(s, 1); }); }
function tableRows() {
return tasks01.map(function (t, i) { return tableRow(t.name, plan01.es[i], t.dur, plan01.slack[i]); });
}
function draw() {
clearStage();
const bottom = ROWS_TOP + tasks01.length * ROW_H;
tasks01.forEach(function (_, i) {
rowStripe(ROWS_TOP + i * ROW_H, ROW_H, i, 1);
rowGlow(ROWS_TOP + i * ROW_H, ROW_H, Math.abs(grow01[i].v) / 6);
});
timeAxis(dayX, DAY_WIDTH, 0, 23, PLOT_X, W - 8, ROWS_TOP, bottom, { day: 1, week: 0, month: 0 });
// 날짜 → 픽셀 안내 — 막대가 출발하는 순간 그 Start 칸(위 눈금)에서 막대 시작 x 로 세로선이 내려오고, 막대가 자라는 만큼 흐려진다
tasks01.forEach(function (_, i) {
if (sceneT < growAt(i) || sceneT >= SHRINK_AT_S) {
return;
}
const a = 1 - smooth(clamp(grow01[i].x, 0, 1));
if (a <= 0.01) {
return;
}
const x = dayX(plan01.es[i]);
ctx.fillStyle = rgba(PATH_DEEP, 0.28 * a);
ctx.fillRect(x, ROWS_TOP - 20, DAY_WIDTH, 18);
ctx.fillStyle = rgba(PATH_DEEP, 0.85 * a);
ctx.fillRect(x - 0.75, ROWS_TOP - 4, 1.5, i * ROW_H + ROW_H / 2 + 4);
});
tasks01.forEach(function (t, i) {
const y = ROWS_TOP + i * ROW_H;
const cy = y + ROW_H / 2;
rowLabel(t.name, cy, 1, false);
const g = grow01[i];
const k = Math.max(0, g.x);
const x0 = dayX(plan01.es[i]);
if (t.dur === 0) {
diamond(dayX(plan01.es[i]), cy, 7 * k, PATH_DEEP, Math.min(1, k * 1.5));
return;
}
const w = t.dur * DAY_WIDTH * k;
// 그림자 — 막대가 빨리 자랄수록(속도 클수록) 더 떠올라 그림자가 아래로 멀어지고 옅어진다
const lift = clamp(Math.abs(g.v) * 0.35, 0, 4);
bar(x0 + 1, y + (ROW_H - BAR_H) / 2 + 2 + lift, w, BAR_H, INK, 0.12 - lift * 0.015, 0);
bar(x0, y + (ROW_H - BAR_H) / 2, w, BAR_H, BAR_COLORS[i % BAR_COLORS.length], 1, 1.2);
// 길이 표시 — 제 길이에 거의 닿았을 때 나타난다
const a = smooth((k - 0.7) / 0.3);
if (a > 0) {
label(SLACK_FMT.replace('{n}', String(t.dur)), x0 + w + 4, cy, INK, a, 10, 700, 'left');
}
});
}
// 한 프레임에 넘기는 시간 상한(초) — 탭을 오래 숨겼다 돌아온 첫 프레임에도 50ms 까지만 계산에 넣는다
const DT_MAX = 0.05;
let paused = false;
const reduceQuery = window.matchMedia('(prefers-reduced-motion: reduce)');
// 페이지를 연 채 동작 줄이기 설정을 바꿔도 change 리스너가 이 값을 다시 읽는다
let still = reduceQuery.matches;
// 자동 시연 중인가 — 사람이 처음 손대면 시연 표시를 떼고 상태 줄을 polite 로 켠다
let demo = root.classList.contains('is-demo');
// 리스너는 한 묶음으로 달고 정리할 때 한 번에 뗀다
const off = new AbortController();
function wake() {
if (!demo) {
return;
}
demo = false;
root.classList.remove('is-demo');
if (statusEl) {
statusEl.setAttribute('aria-live', 'polite');
}
}
// 장면 시계를 dt 만큼 — 한 바퀴(LOOP_S)를 넘으면 처음 배치로 되돌려 다시 시연한다
function advance(dt) {
sceneT += dt;
if (sceneT >= LOOP_S) {
sceneT -= LOOP_S;
reset();
}
update(dt);
}
let rafId = 0;
let lastTs = -1;
function frame(ts) {
if (still || paused) {
rafId = 0;
return;
}
if (lastTs < 0) {
lastTs = ts;
}
const dt = Math.min((ts - lastTs) / 1000, DT_MAX);
lastTs = ts;
if (dt > 0) {
advance(dt);
}
draw();
pushStatus();
rafId = window.requestAnimationFrame(frame);
}
function startLoop() {
if (rafId) {
return;
}
// 시계 다시 맞추기 — 멈췄던 사이의 시간을 첫 프레임 dt 로 넘기지 않는다
lastTs = -1;
rafId = window.requestAnimationFrame(frame);
}
function stopLoop() {
if (rafId) {
window.cancelAnimationFrame(rafId);
rafId = 0;
}
}
// 동작 줄이기 — 루프를 돌리지 않고 시연이 끝난 최종 배치 한 장만 그린다
function showRest() {
stopLoop();
sceneT = 0;
reset();
restPose();
draw();
pushStatus();
}
function play() {
sceneT = 0;
reset();
draw();
pushStatus();
if (!paused) {
startLoop();
}
}
pauseBtn.addEventListener('click', function () {
paused = !paused;
pauseBtn.setAttribute('aria-pressed', paused ? 'true' : 'false');
wake();
if (paused) {
stopLoop();
}
else if (!still) {
startLoop();
}
}, { signal: off.signal });
// 탭이 숨으면 루프를 멈추고, 돌아오면 시계를 다시 맞춰 시작한다 — 숨은 동안의 몇 초가 한 프레임에 몰리지 않게
document.addEventListener('visibilitychange', function () {
if (document.hidden) {
stopLoop();
}
else if (!paused && !still) {
startLoop();
}
}, { signal: off.signal });
// 설정이 페이지를 연 채 바뀌면 — 켜지면 최종 배치로 멈추고, 꺼지면 시연을 처음부터
reduceQuery.addEventListener('change', function () {
still = reduceQuery.matches;
if (still) {
showRest();
}
else {
play();
}
}, { signal: off.signal });
window.addEventListener('resize', function () {
fitCanvas();
draw();
}, { signal: off.signal });
fitCanvas();
fillTable(TABLE_CAPTION, tableRows());
if (still) {
showRest();
}
else {
play();
}
return function () {
stopLoop();
off.abort();
};
})();// ScheduleSpringBars - 같은 항목 vanilla 판 index.html 의 React 포트. 같은 계산을 useEffect 안에서 돌린다.
import { useEffect, useRef } from "react";
import styles from "./ScheduleSpringBars.module.scss";
const cx = (s: string): string => s.split(" ").map((n) => styles[n] ?? n).join(" ");
export default function ScheduleSpringBars() {
const rootRef = useRef<HTMLDivElement | null>(null);
useEffect(() => {
const rootEl = rootRef.current;
if (!rootEl) return;
const root: HTMLElement = rootEl;
type RGB = [number, number, number];
type Pt = [number, number];
// 판 좌표 — 캔버스 안은 늘 480×300. 화면에 보이는 크기와 상관없이 계산은 이 좌표로 한다
const W = 480;
const H = 300;
const TAU = Math.PI * 2;
function clamp(v: number, lo: number, hi: number): number { return v < lo ? lo : (v > hi ? hi : v); }
function lerp(a: number, b: number, k: number): number { return a + (b - a) * k; }
function smooth(x: number): number { const c = clamp(x, 0, 1); return c * c * (3 - 2 * c); }
// 따라가기 비율 — 1 − e^(−rate·dt). 프레임 시간이 달라도 1초에 같은 만큼 다가간다
function follow(rate: number, dt: number): number { return 1 - Math.exp(-rate * dt); }
// 시드 고정 난수 — 같은 시드면 같은 일정이 다시 나온다 (32비트 정수 섞기)
function makeRng(seed: number): () => number {
let s = seed >>> 0;
return function (): number {
s = (s + 0x6d2b79f5) >>> 0;
let t = s;
t = Math.imul(t ^ (t >>> 15), t | 1);
t ^= t + Math.imul(t ^ (t >>> 7), t | 61);
return ((t ^ (t >>> 14)) >>> 0) / 4294967296;
};
}
// ── 감쇠 스프링 ──────────────────────────────────────────────
// 가속 = 단단함 × (목표 − 위치) − 감쇠 × 속도. 속도를 먼저 고친 뒤 위치를 옮기는 적분을 1/240초 잔걸음으로 나눠 돌린다
type Spring = { x: number; v: number; to: number };
function makeSpring(x: number): Spring { return { x: x, v: 0, to: x }; }
const SPRING_SUBSTEP = 1 / 240;
function stepSpring(s: Spring, stiffness: number, damping: number, dt: number): void {
let left = dt;
while (left > 1e-9) {
const h = Math.min(SPRING_SUBSTEP, left);
s.v += (stiffness * (s.to - s.x) - damping * s.v) * h;
s.x += s.v * h;
left -= h;
}
}
function snapSpring(s: Spring, x: number): void { s.x = x; s.v = 0; s.to = x; }
// ── 날짜 = 정수 일수 ─────────────────────────────────────────
// 날짜 객체를 쓰지 않는다. 기준일을 0 으로 세는 정수 일수(day index)만 다루고, 화면의 월·일 숫자는 아래 월 길이 표로 산수해 만든다
const MONTH_DAYS = [31, 28, 31, 30, 31, 30, 31, 31, 30, 31, 30, 31];
const YEAR_DAYS = 365;
// 기준일(일수 0) = 한 해의 70번째 날 → 표로 세면 3월 11일
const DAY_ZERO_OF_YEAR = 69;
function calendarOf(day: number): [number, number] {
let r = ((day + DAY_ZERO_OF_YEAR) % YEAR_DAYS + YEAR_DAYS) % YEAR_DAYS;
let m = 0;
while (r >= MONTH_DAYS[m]) { r -= MONTH_DAYS[m]; m += 1; }
return [m + 1, r + 1];
}
const DAY_FMT = '{n}일차';
const WEEK_FMT = '{n}주차';
const MONTH_FMT = '{n}월';
const SLACK_FMT = '{n}일';
function dayText(day: number): string { return DAY_FMT.replace('{n}', String(day + 1)); }
// 하루 차 계산의 함정 — 시각(시간 단위)끼리 빼서 24 로 나누면, 시계가 한 시간 당겨진 날이 끼었을 때 정수가 아니다(23시간짜리 하루).
// 그래서 바깥에서 들어온 시각은 반올림으로 정수 일수에 붙이고, 그다음부터는 정수끼리만 더하고 뺀다
const HOURS_PER_DAY = 24;
const CLOCK_SHIFT_HOURS = 1;
function hoursToDayIndex(hours: number): number { return Math.round(hours / HOURS_PER_DAY); }
// ── 작업과 의존 ──────────────────────────────────────────────
// dur 는 일수(0 이면 마일스톤), deps 는 끝나야 시작할 수 있는 앞 작업 번호, load 는 그 작업에 붙는 사람 수
type Task = { name: string; dur: number; deps: number[]; load: number };
const BASE_TASKS: Task[] = [
{ name: '요구 정리', dur: 3, deps: [], load: 2 },
{ name: '디자인 시안', dur: 4, deps: [0], load: 1 },
{ name: '데이터 설계', dur: 3, deps: [0], load: 1 },
{ name: '화면 개발', dur: 5, deps: [1], load: 2 },
{ name: '서버 개발', dur: 7, deps: [2], load: 1 },
{ name: '기능 연동', dur: 3, deps: [3, 4], load: 2 },
{ name: '문서 작성', dur: 3, deps: [1], load: 1 },
{ name: '통합 검수', dur: 3, deps: [5], load: 2 },
{ name: '오류 수정', dur: 2, deps: [7], load: 1 },
{ name: '출시', dur: 0, deps: [8, 6], load: 0 }
];
function copyTasks(ts: Task[]): Task[] { return ts.map(function (t: Task): Task { return { name: t.name, dur: t.dur, deps: t.deps.slice(), load: t.load }; }); }
function successorsOf(tasks: Task[]): number[][] {
const out: number[][] = tasks.map(function (): number[] { return []; });
tasks.forEach(function (t: Task, i: number): void { t.deps.forEach(function (p: number): void { out[p].push(i); }); });
return out;
}
// 선후 순서로 줄 세우기 — 앞 작업이 하나도 안 남은(들어오는 화살표 0) 작업부터 꺼내고, 꺼낼 때마다 뒤 작업의 남은 수를 하나 줄인다.
// 꺼낼 것이 사라졌는데 남은 작업이 있으면 그 작업들은 서로를 기다리는 고리(순환 의존)에 걸렸거나 그 뒤에 매달린 것이다 → stuck
type Order = { order: number[]; stuck: number[] };
function sortByDeps(tasks: Task[]): Order {
const succ = successorsOf(tasks);
const waiting = tasks.map(function (t: Task): number { return t.deps.length; });
const ready: number[] = [];
waiting.forEach(function (w: number, i: number): void { if (w === 0) { ready.push(i); } });
const order: number[] = [];
while (ready.length) {
ready.sort(function (a: number, b: number): number { return a - b; });
const i = ready.shift() as number;
order.push(i);
succ[i].forEach(function (j: number): void { waiting[j] -= 1; if (waiting[j] === 0) { ready.push(j); } });
}
const stuck: number[] = [];
waiting.forEach(function (w: number, i: number): void { if (w > 0) { stuck.push(i); } });
return { order: order, stuck: stuck };
}
// 앞뒤 두 번 훑기 — 앞에서: 가장 이른 시작 = 앞 작업 끝 중 가장 늦은 날(과 정해 둔 시작일 중 늦은 쪽).
// 뒤에서: 가장 늦은 끝 = 뒤 작업의 가장 늦은 시작 중 가장 이른 날(뒤 작업이 없으면 전체 끝). 여유 = 가장 늦은 시작 − 가장 이른 시작
type Layers = { day: number; week: number; month: number };
type Sweep = { es: number[]; ef: number[]; ls: number[]; lf: number[]; slack: number[]; end: number };
function sweepBoth(tasks: Task[], order: number[], minStart: number[] | null): Sweep {
const n = tasks.length;
const es: number[] = new Array(n).fill(0);
const ef: number[] = new Array(n).fill(0);
for (const i of order) {
let s = minStart ? minStart[i] : 0;
for (const p of tasks[i].deps) { s = Math.max(s, ef[p]); }
es[i] = s;
ef[i] = s + tasks[i].dur;
}
let end = 0;
for (const i of order) { end = Math.max(end, ef[i]); }
const succ = successorsOf(tasks);
const ls: number[] = new Array(n).fill(0);
const lf: number[] = new Array(n).fill(0);
for (let k = order.length - 1; k >= 0; k -= 1) {
const i = order[k];
let f = end;
for (const j of succ[i]) { f = Math.min(f, ls[j]); }
lf[i] = f;
ls[i] = f - tasks[i].dur;
}
const slack = es.map(function (s: number, i: number): number { return ls[i] - s; });
return { es: es, ef: ef, ls: ls, lf: lf, slack: slack, end: end };
}
// 밀기 전파 — 밀린 작업에서 가까운 뒤 작업부터 너비 우선으로 훑으며, 새 시작 = 앞 작업 끝 중 가장 늦은 날(지금보다 늦을 때만).
// depth 는 밀린 작업에서 몇 단계 뒤인지(-1 이면 여유가 흡수해 안 밀림). 시작이 바뀐 작업만 다시 큐에 넣는다
type Push = { starts: number[]; depth: number[] };
function pushFrom(tasks: Task[], starts: number[], from: number): Push {
const succ = successorsOf(tasks);
const out = starts.slice();
const depth: number[] = tasks.map(function (): number { return -1; });
depth[from] = 0;
const queue: number[] = [from];
let head = 0;
// 고리가 있어도 끝나도록 꺼내는 횟수에 상한을 둔다
const limit = tasks.length * tasks.length + 1;
while (head < queue.length && head < limit) {
const i = queue[head];
head += 1;
for (const j of succ[i]) {
let need = 0;
for (const p of tasks[j].deps) { need = Math.max(need, out[p] + tasks[p].dur); }
if (need > out[j]) {
out[j] = need;
depth[j] = Math.max(depth[j], depth[i] + 1);
queue.push(j);
}
}
}
return { starts: out, depth: depth };
}
// 날마다 걸린 일감 — 작업이 덮는 날(시작 ≤ 날 < 시작 + 일수)마다 사람 수를 더한다
function dailyLoad(tasks: Task[], starts: number[], days: number): number[] {
const load: number[] = new Array(days).fill(0);
tasks.forEach(function (t: Task, i: number): void {
for (let d = starts[i]; d < starts[i] + t.dur; d += 1) { if (d >= 0 && d < days) { load[d] += t.load; } }
});
return load;
}
// ── 직각 경로 ───────────────────────────────────────────────
// 앞 끝(ex, ey)에서 오른쪽으로 ROUTE_STUB 나간 뒤 아래로 꺾는다. 뒤 시작(sx)이 그 꺾인 자리 + ROUTE_STUB 보다 오른쪽이면 곧장 내려가 오른쪽으로 들어가고,
// 아니면 앞 행 바로 아래 통로(gapY)까지 내려가 왼쪽으로 돌아간 다음 뒤 시작보다 ROUTE_STUB 앞에서 내려가 오른쪽으로 들어간다
const ROUTE_STUB = 7;
function elbowRoute(ex: number, ey: number, sx: number, sy: number, gapY: number): number[] {
const x1 = ex + ROUTE_STUB;
if (sx - ROUTE_STUB >= x1) { return [ex, ey, x1, ey, x1, sy, sx, sy]; }
const x2 = sx - ROUTE_STUB;
return [ex, ey, x1, ey, x1, gapY, x2, gapY, x2, sy, sx, sy];
}
function routeLength(pts: number[]): number {
let s = 0;
for (let i = 2; i < pts.length; i += 2) { s += Math.hypot(pts[i] - pts[i - 2], pts[i + 1] - pts[i - 1]); }
return s;
}
// 경로 위 거리 dist 자리의 점과 그 마디의 방향
function pointOnRoute(pts: number[], dist: number): [number, number, number, number] {
let left = Math.max(0, dist);
for (let i = 2; i < pts.length; i += 2) {
const dx = pts[i] - pts[i - 2];
const dy = pts[i + 1] - pts[i - 1];
const len = Math.hypot(dx, dy);
if (left <= len || i === pts.length - 2) {
const k = len > 0 ? Math.min(1, left / len) : 0;
return [pts[i - 2] + dx * k, pts[i - 1] + dy * k, len > 0 ? dx / len : 1, len > 0 ? dy / len : 0];
}
left -= len;
}
return [pts[0], pts[1], 1, 0];
}
// 경로를 앞에서부터 dist 만큼만 자른 점 목록 — 화살표가 그려져 나가는 장면에 쓴다
function cutRoute(pts: number[], dist: number): number[] {
const out: number[] = [pts[0], pts[1]];
let left = Math.max(0, dist);
for (let i = 2; i < pts.length; i += 2) {
const len = Math.hypot(pts[i] - pts[i - 2], pts[i + 1] - pts[i - 1]);
if (left >= len) { out.push(pts[i], pts[i + 1]); left -= len; continue; }
const k = len > 0 ? left / len : 0;
out.push(lerp(pts[i - 2], pts[i], k), lerp(pts[i - 1], pts[i + 1], k));
break;
}
return out;
}
// 장면 시계(초)와 상태 줄 글자 — 장면 계산이 고치고, 화면 쪽이 읽어 그린다
let sceneT = 0;
let simStatus = '';
// 파스텔 팔레트 — 크림 바탕 위 라벤더·민트·버터·산호 막대. 가장 긴 경로·오늘 선·글자는 진한 쪽으로 명도 차를 둔다
const PAPER: RGB = [251, 247, 238];
const PAPER_DIM: RGB = [243, 237, 224];
const GRID: RGB = [226, 218, 204];
const INK: RGB = [44, 38, 58];
const INK_SOFT: RGB = [112, 104, 126];
const CREAM: RGB = [255, 251, 242];
const LAVENDER: RGB = [190, 174, 236];
const MINT: RGB = [158, 214, 190];
const BUTTER: RGB = [244, 222, 146];
const CORAL: RGB = [244, 170, 150];
const SKY: RGB = [160, 204, 236];
const PINK: RGB = [242, 182, 206];
const PATH_DEEP: RGB = [86, 56, 168];
const TODAY_DEEP: RGB = [190, 72, 60];
const BAR_COLORS: RGB[] = [LAVENDER, MINT, BUTTER, CORAL, SKY, PINK];
function rgba(c: RGB, a: number): string {
return 'rgba(' + Math.round(clamp(c[0], 0, 255)) + ',' + Math.round(clamp(c[1], 0, 255)) + ',' + Math.round(clamp(c[2], 0, 255)) + ',' + clamp(a, 0, 1).toFixed(3) + ')';
}
function mix(a: RGB, b: RGB, k: number): RGB { return [lerp(a[0], b[0], k), lerp(a[1], b[1], k), lerp(a[2], b[2], k)]; }
// 표 한 줄 — 작업·시작·끝·여유. 끝은 그 작업이 덮는 마지막 날(일수 0 짜리는 시작과 같은 날)
function tableRow(name: string, start: number, dur: number, slack: number): string[] {
return [name, dayText(start), dayText(start + Math.max(0, dur - 1)), SLACK_FMT.replace('{n}', String(slack))];
}
const canvasEl = root.querySelector('[data-role="canvas"]') as HTMLCanvasElement | null;
const pauseEl = root.querySelector('[data-role="pause"]') as HTMLButtonElement | null;
const tableEl = root.querySelector('[data-role="table"]') as HTMLTableElement | null;
const statusEl = root.querySelector('[data-role="status"]') as HTMLElement | null;
const ctxRaw = canvasEl ? canvasEl.getContext('2d') : null;
if (!canvasEl || !ctxRaw || !pauseEl) { return; }
const cv: HTMLCanvasElement = canvasEl;
const ctx: CanvasRenderingContext2D = ctxRaw;
const pauseBtn: HTMLButtonElement = pauseEl;
const FONT_STACK = 'system-ui, -apple-system, "Segoe UI", "Noto Sans KR", sans-serif';
function fitCanvas(): void {
// 배율은 2 에서 자른다 — 배율 3 기기에서 화소가 2.25배로 늘어 프레임마다 일이 그만큼 커지지 않게
const dpr = Math.min(window.devicePixelRatio || 1, 2);
cv.width = Math.round(W * dpr);
cv.height = Math.round(H * dpr);
ctx.setTransform(dpr, 0, 0, dpr, 0, 0);
}
function clearStage(): void {
ctx.fillStyle = rgba(PAPER, 1);
ctx.fillRect(0, 0, W, H);
}
function label(s: string, x: number, y: number, c: RGB, a: number, px: number, weight: number, align: CanvasTextAlign): void {
ctx.font = weight + ' ' + px + 'px ' + FONT_STACK;
ctx.textAlign = align;
ctx.textBaseline = 'middle';
ctx.fillStyle = rgba(c, a);
ctx.fillText(s, x, y);
}
function roundRectPath(x: number, y: number, w: number, h: number, r: number): void {
const rr = Math.max(0, Math.min(r, w / 2, h / 2));
ctx.beginPath();
ctx.moveTo(x + rr, y);
ctx.lineTo(x + w - rr, y);
ctx.arcTo(x + w, y, x + w, y + rr, rr);
ctx.lineTo(x + w, y + h - rr);
ctx.arcTo(x + w, y + h, x + w - rr, y + h, rr);
ctx.lineTo(x + rr, y + h);
ctx.arcTo(x, y + h, x, y + h - rr, rr);
ctx.lineTo(x, y + rr);
ctx.arcTo(x, y, x + rr, y, rr);
ctx.closePath();
}
// 막대 하나 — 둥근 사각형 채움 + 진한 테두리. 폭이 0 이하이면 그리지 않는다
function bar(x: number, y: number, w: number, h: number, fill: RGB, a: number, line: number): void {
if (w <= 0.2 || a <= 0) { return; }
roundRectPath(x, y, w, h, 4);
ctx.fillStyle = rgba(fill, a);
ctx.fill();
if (line > 0) {
ctx.lineWidth = line;
ctx.strokeStyle = rgba(INK, 0.55 * a);
ctx.stroke();
}
}
// 마일스톤 마름모
function diamond(cx: number, cy: number, r: number, fill: RGB, a: number): void {
if (r <= 0.2 || a <= 0) { return; }
ctx.beginPath();
ctx.moveTo(cx, cy - r);
ctx.lineTo(cx + r, cy);
ctx.lineTo(cx, cy + r);
ctx.lineTo(cx - r, cy);
ctx.closePath();
ctx.fillStyle = rgba(fill, a);
ctx.fill();
ctx.lineWidth = 1.5;
ctx.strokeStyle = rgba(INK, 0.8 * a);
ctx.stroke();
}
function polyline(pts: number[], c: RGB, a: number, width: number): void {
if (pts.length < 4) { return; }
ctx.beginPath();
ctx.moveTo(pts[0], pts[1]);
for (let i = 2; i < pts.length; i += 2) { ctx.lineTo(pts[i], pts[i + 1]); }
ctx.lineWidth = width;
ctx.lineJoin = 'round';
ctx.lineCap = 'round';
ctx.strokeStyle = rgba(c, a);
ctx.stroke();
}
function arrowHead(x: number, y: number, dx: number, dy: number, size: number, c: RGB, a: number): void {
ctx.beginPath();
ctx.moveTo(x, y);
ctx.lineTo(x - dx * size - dy * size * 0.6, y - dy * size + dx * size * 0.6);
ctx.lineTo(x - dx * size + dy * size * 0.6, y - dy * size - dx * size * 0.6);
ctx.closePath();
ctx.fillStyle = rgba(c, a);
ctx.fill();
}
// 빗금 — (x, y, w, h) 안에 45° 줄을 spacing 간격으로. 간격이 좁을수록 짙어 보인다
function hatch(x: number, y: number, w: number, h: number, spacing: number, c: RGB, a: number): void {
if (w <= 0.5 || a <= 0) { return; }
ctx.save();
roundRectPath(x, y, w, h, 3);
ctx.clip();
ctx.beginPath();
for (let s = x - h; s < x + w; s += Math.max(2, spacing)) {
ctx.moveTo(s, y + h);
ctx.lineTo(s + h, y);
}
ctx.lineWidth = 1.6;
ctx.strokeStyle = rgba(c, a);
ctx.stroke();
ctx.restore();
}
// 시간 축 — 위 띠는 월 이름, 아래 띠는 일(월 안의 날 숫자)·주(주차) 층. 층마다 불투명도를 따로 받아 겹쳐 흐려지며 바뀌게 한다.
// 세로 격자도 같은 불투명도로 행 영역(top~bottom)에 긋는다. xOf 는 일수 → 화면 x
function timeAxis(xOf: (d: number) => number, dayW: number, d0: number, d1: number, left: number, right: number, top: number, bottom: number, ly: Layers): void {
ctx.save();
ctx.beginPath();
ctx.rect(left, 0, right - left, H);
ctx.clip();
ctx.fillStyle = rgba(PAPER_DIM, 1);
ctx.fillRect(left, 0, right - left, top - 4);
for (let d = Math.floor(d0); d <= Math.ceil(d1); d += 1) {
const x = xOf(d);
const cal = calendarOf(d);
if (ly.day > 0.01) {
ctx.fillStyle = rgba(GRID, 0.7 * ly.day);
ctx.fillRect(x, top, 1, bottom - top);
if (dayW >= 13) { label(String(cal[1]), x + dayW / 2, top - 11, INK_SOFT, ly.day, 9, 600, 'center'); }
}
// 주 층 — 글자가 겹치지 않을 만큼(36px) 주를 건너뛰며 적는다
const weekStep = 7 * dayW >= 36 ? 1 : (14 * dayW >= 36 ? 2 : 4);
if (ly.week > 0.01 && d % 7 === 0) {
ctx.fillStyle = rgba(GRID, ly.week);
ctx.fillRect(x, top, 1, bottom - top);
if ((d / 7) % weekStep === 0) { label(WEEK_FMT.replace('{n}', String(d / 7 + 1)), x + 3, top - 11, INK_SOFT, ly.week, 9, 600, 'left'); }
}
if (cal[1] === 1) {
ctx.fillStyle = rgba(INK_SOFT, 0.18 + 0.4 * ly.month);
ctx.fillRect(x, 4, 1, bottom - 4);
label(MONTH_FMT.replace('{n}', String(cal[0])), x + 4, 11, INK, 0.85, 10, 700, 'left');
// 월 층 — 그달 칸 가운데에 그달 일수(월 길이 표에서)를 적는다
const len = MONTH_DAYS[cal[0] - 1];
if (ly.month > 0.01 && len * dayW >= 30) { label(SLACK_FMT.replace('{n}', String(len)), x + len * dayW / 2, top - 11, INK_SOFT, ly.month, 9, 700, 'center'); }
} else if (d === Math.floor(d0)) {
// 왼쪽 끝 월 이름 — 바로 오른쪽에 새 달이 시작하면 겹치므로 적지 않는다
const toNext = MONTH_DAYS[cal[0] - 1] - cal[1] + 1;
if (toNext * dayW >= 44) { label(MONTH_FMT.replace('{n}', String(cal[0])), Math.max(x, left) + 4, 11, INK, 0.85, 10, 700, 'left'); }
}
}
ctx.restore();
}
// 왼쪽 작업 이름 칸
function rowLabel(name: string, y: number, a: number, bold: boolean): void {
label(name, 10, y, INK, a, 11, bold ? 800 : 600, 'left');
}
function rowStripe(y: number, h: number, i: number, a: number): void {
if (i % 2 === 1) {
ctx.fillStyle = rgba(PAPER_DIM, 0.75 * a);
ctx.fillRect(0, y, W, h);
}
}
// 움직이는 행 빛 — 그 행 막대의 스프링 속도(k = 0~1)만큼 행 전체가 옅은 라벤더로 밝아진다. 막대가 서면 사라진다
function rowGlow(y: number, h: number, k: number): void {
if (k <= 0.01) { return; }
ctx.fillStyle = rgba(LAVENDER, 0.42 * clamp(k, 0, 1));
ctx.fillRect(0, y, W, h);
}
// 상태 줄 — 바뀔 때만 글자를 고친다
let shownStatus = '';
function pushStatus(): void {
if (!statusEl || simStatus === shownStatus) { return; }
shownStatus = simStatus;
statusEl.textContent = simStatus;
}
// 숨김 표 — 같은 일정을 작업·시작·끝·여유 열로 읽게. 화면에는 안 보이고 화면 읽기 도구가 읽는다
const TABLE_HEAD = ['작업 이름', '시작일', '끝나는 날', '여유 일수'];
function fillTable(caption: string, rows: string[][]): void {
if (!tableEl) { return; }
const tb = tableEl;
while (tb.firstChild) { tb.removeChild(tb.firstChild); }
const cap = document.createElement('caption');
cap.textContent = caption;
tb.appendChild(cap);
const thead = document.createElement('thead');
const hr = document.createElement('tr');
TABLE_HEAD.forEach(function (h: string): void {
const th = document.createElement('th');
th.scope = 'col';
th.textContent = h;
hr.appendChild(th);
});
thead.appendChild(hr);
tb.appendChild(thead);
const body = document.createElement('tbody');
rows.forEach(function (r: string[]): void {
const tr = document.createElement('tr');
r.forEach(function (c: string, k: number): void {
const cell = document.createElement(k === 0 ? 'th' : 'td');
if (k === 0) { (cell as HTMLTableCellElement).scope = 'row'; }
cell.textContent = c;
tr.appendChild(cell);
});
body.appendChild(tr);
});
tb.appendChild(body);
}
// 01 — 날짜를 픽셀로: x = 막대 칸 왼쪽 + 일수 × 하루 폭. 막대 길이 = 일수 × 하루 폭
const LABEL_W = 96;
const PLOT_X = LABEL_W + 6;
const DAY_WIDTH = 16;
const ROWS_TOP = 46;
const ROW_H = 21;
const BAR_H = 13;
// 폭 성장 스프링 — 0(없음) → 1(제 길이). 감쇠비 = BAR_DAMPING / (2√BAR_STIFFNESS)
const BAR_STIFFNESS = 170;
const BAR_DAMPING = 14;
// 시작일이 이른 순서로 한 막대씩 BAR_STAGGER_MS 늦게 출발
const BAR_STAGGER_MS = 70;
const GROW_START_S = 0.25;
const SHRINK_AT_S = 5.6;
const LOOP_S = 7;
const TABLE_CAPTION = '작업 일정표 — 시작일 순 성장';
const tasks01 = BASE_TASKS;
const plan01 = sweepBoth(tasks01, sortByDeps(tasks01).order, null);
function dayX(d: number): number { return PLOT_X + d * DAY_WIDTH; }
// 시작일 순위 — 같은 날이면 위 행 먼저
const rank01: number[] = (function (): number[] {
const idx = tasks01.map(function (_: Task, i: number): number { return i; });
idx.sort(function (a: number, b: number): number { return plan01.es[a] - plan01.es[b] || a - b; });
const r: number[] = new Array(tasks01.length).fill(0);
idx.forEach(function (i: number, k: number): void { r[i] = k; });
return r;
})();
const grow01: Spring[] = tasks01.map(function (): Spring { return makeSpring(0); });
function growAt(i: number): number { return GROW_START_S + rank01[i] * BAR_STAGGER_MS / 1000; }
function reset(): void { grow01.forEach(function (s: Spring): void { snapSpring(s, 0); }); }
function update(dt: number): void {
grow01.forEach(function (s: Spring, i: number): void {
s.to = sceneT >= growAt(i) && sceneT < SHRINK_AT_S ? 1 : 0;
stepSpring(s, BAR_STIFFNESS, BAR_DAMPING, dt);
});
}
function restPose(): void { grow01.forEach(function (s: Spring): void { snapSpring(s, 1); }); }
function tableRows(): string[][] {
return tasks01.map(function (t: Task, i: number): string[] { return tableRow(t.name, plan01.es[i], t.dur, plan01.slack[i]); });
}
function draw(): void {
clearStage();
const bottom = ROWS_TOP + tasks01.length * ROW_H;
tasks01.forEach(function (_: Task, i: number): void {
rowStripe(ROWS_TOP + i * ROW_H, ROW_H, i, 1);
rowGlow(ROWS_TOP + i * ROW_H, ROW_H, Math.abs(grow01[i].v) / 6);
});
timeAxis(dayX, DAY_WIDTH, 0, 23, PLOT_X, W - 8, ROWS_TOP, bottom, { day: 1, week: 0, month: 0 });
// 날짜 → 픽셀 안내 — 막대가 출발하는 순간 그 시작일 칸(위 눈금)에서 막대 시작 x 로 세로선이 내려오고, 막대가 자라는 만큼 흐려진다
tasks01.forEach(function (_: Task, i: number): void {
if (sceneT < growAt(i) || sceneT >= SHRINK_AT_S) { return; }
const a = 1 - smooth(clamp(grow01[i].x, 0, 1));
if (a <= 0.01) { return; }
const x = dayX(plan01.es[i]);
ctx.fillStyle = rgba(PATH_DEEP, 0.28 * a);
ctx.fillRect(x, ROWS_TOP - 20, DAY_WIDTH, 18);
ctx.fillStyle = rgba(PATH_DEEP, 0.85 * a);
ctx.fillRect(x - 0.75, ROWS_TOP - 4, 1.5, i * ROW_H + ROW_H / 2 + 4);
});
tasks01.forEach(function (t: Task, i: number): void {
const y = ROWS_TOP + i * ROW_H;
const cy = y + ROW_H / 2;
rowLabel(t.name, cy, 1, false);
const g = grow01[i];
const k = Math.max(0, g.x);
const x0 = dayX(plan01.es[i]);
if (t.dur === 0) {
diamond(dayX(plan01.es[i]), cy, 7 * k, PATH_DEEP, Math.min(1, k * 1.5));
return;
}
const w = t.dur * DAY_WIDTH * k;
// 그림자 — 막대가 빨리 자랄수록(속도 클수록) 더 떠올라 그림자가 아래로 멀어지고 옅어진다
const lift = clamp(Math.abs(g.v) * 0.35, 0, 4);
bar(x0 + 1, y + (ROW_H - BAR_H) / 2 + 2 + lift, w, BAR_H, INK, 0.12 - lift * 0.015, 0);
bar(x0, y + (ROW_H - BAR_H) / 2, w, BAR_H, BAR_COLORS[i % BAR_COLORS.length], 1, 1.2);
// 길이 표시 — 제 길이에 거의 닿았을 때 나타난다
const a = smooth((k - 0.7) / 0.3);
if (a > 0) { label(SLACK_FMT.replace('{n}', String(t.dur)), x0 + w + 4, cy, INK, a, 10, 700, 'left'); }
});
}
// 한 프레임에 넘기는 시간 상한(초) — 탭을 오래 숨겼다 돌아온 첫 프레임에도 50ms 까지만 계산에 넣는다
const DT_MAX = 0.05;
let paused = false;
const reduceQuery = window.matchMedia('(prefers-reduced-motion: reduce)');
// 페이지를 연 채 동작 줄이기 설정을 바꿔도 change 리스너가 이 값을 다시 읽는다
let still = reduceQuery.matches;
// 자동 시연 중인가 — 사람이 처음 손대면 시연 표시를 떼고 상태 줄을 polite 로 켠다
let demo = root.classList.contains('is-demo');
// 리스너는 한 묶음으로 달고 정리할 때 한 번에 뗀다
const off = new AbortController();
function wake(): void {
if (!demo) { return; }
demo = false;
root.classList.remove('is-demo');
if (statusEl) { statusEl.setAttribute('aria-live', 'polite'); }
}
// 장면 시계를 dt 만큼 — 한 바퀴(LOOP_S)를 넘으면 처음 배치로 되돌려 다시 시연한다
function advance(dt: number): void {
sceneT += dt;
if (sceneT >= LOOP_S) {
sceneT -= LOOP_S;
reset();
}
update(dt);
}
let rafId = 0;
let lastTs = -1;
function frame(ts: number): void {
if (still || paused) { rafId = 0; return; }
if (lastTs < 0) { lastTs = ts; }
const dt = Math.min((ts - lastTs) / 1000, DT_MAX);
lastTs = ts;
if (dt > 0) { advance(dt); }
draw();
pushStatus();
rafId = window.requestAnimationFrame(frame);
}
function startLoop(): void {
if (rafId) { return; }
// 시계 다시 맞추기 — 멈췄던 사이의 시간을 첫 프레임 dt 로 넘기지 않는다
lastTs = -1;
rafId = window.requestAnimationFrame(frame);
}
function stopLoop(): void {
if (rafId) { window.cancelAnimationFrame(rafId); rafId = 0; }
}
// 동작 줄이기 — 루프를 돌리지 않고 시연이 끝난 최종 배치 한 장만 그린다
function showRest(): void {
stopLoop();
sceneT = 0;
reset();
restPose();
draw();
pushStatus();
}
function play(): void {
sceneT = 0;
reset();
draw();
pushStatus();
if (!paused) { startLoop(); }
}
pauseBtn.addEventListener('click', function (): void {
paused = !paused;
pauseBtn.setAttribute('aria-pressed', paused ? 'true' : 'false');
wake();
if (paused) { stopLoop(); } else if (!still) { startLoop(); }
}, { signal: off.signal });
// 탭이 숨으면 루프를 멈추고, 돌아오면 시계를 다시 맞춰 시작한다 — 숨은 동안의 몇 초가 한 프레임에 몰리지 않게
document.addEventListener('visibilitychange', function (): void {
if (document.hidden) { stopLoop(); } else if (!paused && !still) { startLoop(); }
}, { signal: off.signal });
// 설정이 페이지를 연 채 바뀌면 — 켜지면 최종 배치로 멈추고, 꺼지면 시연을 처음부터
reduceQuery.addEventListener('change', function (): void {
still = reduceQuery.matches;
if (still) { showRest(); } else { play(); }
}, { signal: off.signal });
window.addEventListener('resize', function (): void {
fitCanvas();
draw();
}, { signal: off.signal });
fitCanvas();
fillTable(TABLE_CAPTION, tableRows());
if (still) { showRest(); } else { play(); }
return function (): void {
stopLoop();
off.abort();
};
}, []);
return (
<div className={cx("cf") + " is-demo"} ref={rootRef}>
<canvas className={cx("cf__canvas")} data-role="canvas" width={480} height={300} role="img" aria-label="날짜를 일수로 바꿔 하루 폭을 곱한 자리에서 시작일 순서대로 스프링처럼 뻗어 나오는 작업 막대 열 개."></canvas>
<table className={cx("cf__sr")} data-role="table"></table>
<button className={cx("cf__pause")} data-role="pause" type="button" aria-pressed="false">{'일시정지'}</button>
</div>
);
}01 Spring Bars That Grow in Start-Date Order on a Date-to-Pixel Scale — Measured area 53.288% · moving frames 13/23Original by GODRICH · SCSS and React ship in the zip · Gantt Chart JavaScript: 9 Self-Scheduling Views
The post this demo lives in
 Gantt Chart JavaScript: 9 Self-Scheduling ViewsIn Gantt chart JavaScript, when a design draft slips three days, moving one bar makes the schedule lie. 04 pushes later See all demos in this post
If you like this effect - similar demos
 Dashboard UI01 Bars That Grow on a Spring, Overshooting Once Before SettlingBar Chart Animation: 9 Demos From Spring to Race
 Dashboard UI06 A Pie Chart That Unrolls Into a Bar Chart, Slice by SlicePie Chart CSS: 9 Slices That Pop, Tilt and Morph
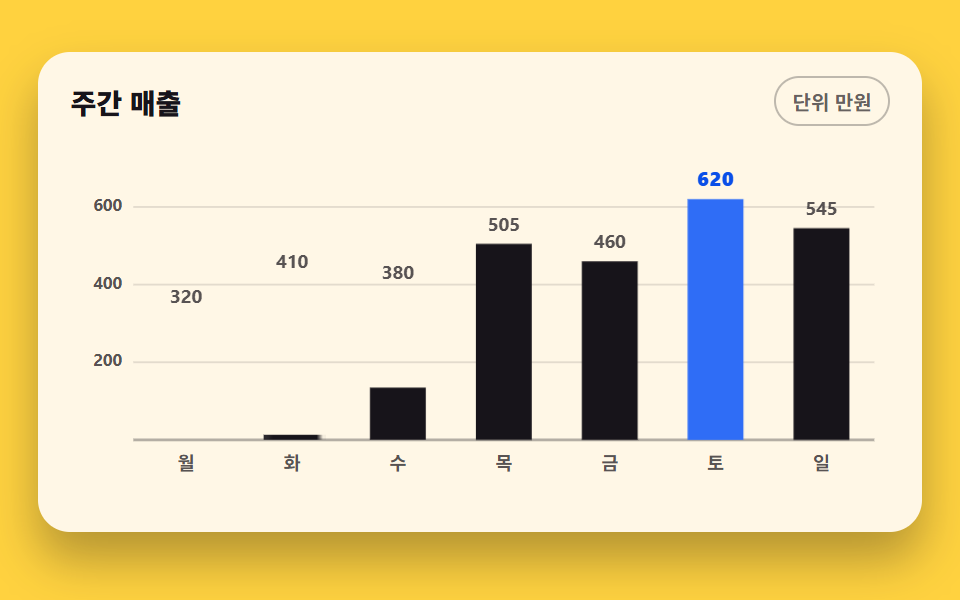 Dashboard UI02 Column bars growing from the baselineCSS Chart Design: 9 SVG Graphs, No Library