05Picker Whose Radar Shape Redraws as You Drag Each Axis Point
Each axis value is converted into an angle and radius to plot a polar point, and the polygon path connecting those points in order is recalculated and redrawn every time a value changes.
Best forMulti-axis inputs like stat sheets or review scorecards
AXIS_COUNTPHASESPERIODS
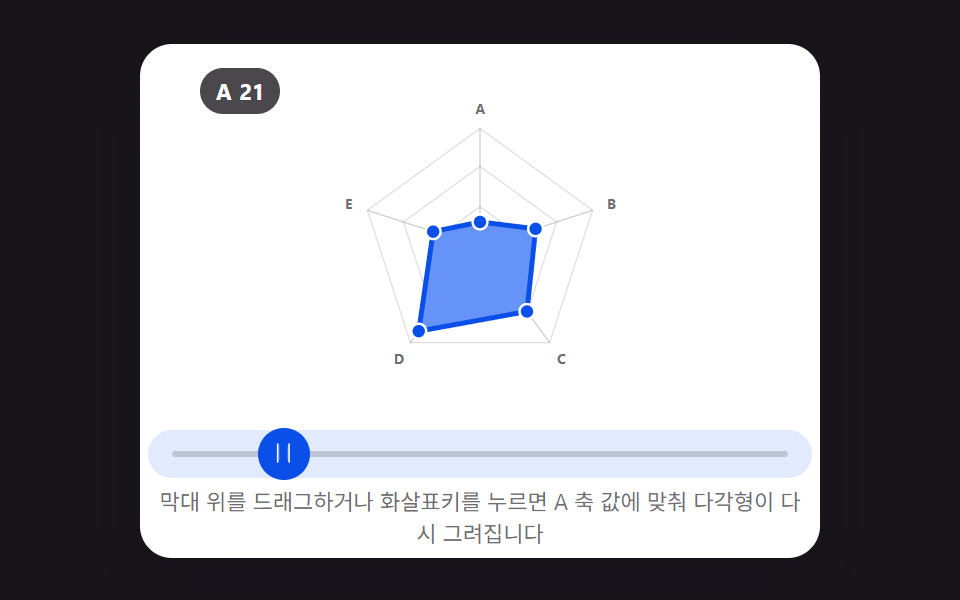
<main class="stage">
<figure class="rd is-demo" id="rd">
  <div class="rd__zone" id="zone">
    <svg class="rd__chart" id="chart" viewBox="0 0 480 300" role="img" aria-label="A radar chart connecting the values of five axes; adjusting axis A's value recalculates the entire polygon path.">
      <g class="rd__grid" id="grid"></g>
      <g class="rd__axes" id="axes"></g>
      <path class="rd__poly" id="poly"></path>
      <g class="rd__pts" id="pts"></g>
    </svg>
    <b class="rd__badge" aria-hidden="true">A <span id="rd-val">60</span></b>
  </div>

  <div class="rd__track" id="track">
    <span class="rd__rail" aria-hidden="true"></span>
    <button class="rd__grab" id="grab" type="button" role="slider" aria-orientation="horizontal"
            aria-label="Choose axis A's value" aria-valuemin="5" aria-valuemax="100"
            aria-valuenow="60" aria-valuetext="Axis A 60">
      <svg class="rd__ic" viewBox="0 0 256 256" aria-hidden="true"><g fill="currentColor"><path d="M96 64v128a8 8 0 0 1-16 0V64a8 8 0 0 1 16 0m88 0v128a8 8 0 0 1-16 0V64a8 8 0 0 1 16 0" opacity=".2"/><path d="M188 32a8 8 0 0 0-8 8v176a8 8 0 0 0 16 0V40a8 8 0 0 0-8-8M76 32a8 8 0 0 0-8 8v176a8 8 0 0 0 16 0V40a8 8 0 0 0-8-8"/></g></svg>
    </button>
  </div>

  <p class="rd__hint">Drag on the bar or press the arrow keys and the polygon redraws to match axis A's value.</p>

  <div class="sr">
    <span aria-live="polite" id="rd-live"></span>
    <table>
      <caption>Value by axis</caption>
      <thead><tr><th>Axis</th><th>Value</th></tr></thead>
      <tbody id="sr-body"></tbody>
    </table>
  </div>
</figure>
</main>@use "../../../../site/static/demo-tokens" as *;
// 레이더 피커 — A 축 값(5~100)을 드래그·키보드로 정하면 B~E 축은 각자 독립된 사인 곡선으로
// 계속 움직이며, 5개 값을 극좌표 점으로 바꿔 이은 다각형 경로(path d 속성)를 매 프레임
// 다시 계산해 그린다. CSS @keyframes 는 0개(다섯 축 모두 매 프레임 실수 값으로 바뀌어
// 선언형으로 못 담는다, 398-01~04 와 같은 이유).
// picker-graph-radar-radius(JS, R)가 레이더 반지름을 정한다.
$duration: $dur-loop;
$easing: $ease-lerp-settle;
$color: $subject-blue;
@include stage($stage-ink);
.sr {
position: absolute; width: 1px; height: 1px; overflow: hidden;
clip-path: inset(50%); white-space: nowrap;
}
.rd {
box-sizing: border-box;
width: min(340px, 92vw);
margin: 0; padding: $sp-1;
display: flex; flex-direction: column; gap: $sp-1; align-items: center;
border-radius: $r-card;
background: $stage-paper;
box-shadow: $shadow-raised;
color: $subject-ink;
}
.rd__zone {
position: relative;
width: min(296px, 100%);
aspect-ratio: 480 / 300;
}
.rd__chart { display: block; width: 100%; height: 100%; overflow: visible; }
.rd__ring { fill: none; stroke: rgba($subject-ink, .14); stroke-width: 1; }
.rd__axis { stroke: rgba($subject-ink, .22); stroke-width: 1; }
.rd__label { font-size: 11px; font-weight: 700; fill: rgba($subject-ink, .62); }
.rd__poly { fill: mix($subject-blue, $stage-paper, 74%); stroke: $subject-blue-deep; stroke-width: 4; stroke-linejoin: round; }
.rd__pt { fill: $subject-blue-deep; stroke: $stage-paper; stroke-width: 2; r: 6; }
.rd__badge {
position: absolute; left: $sp-2; top: $sp-2;
display: flex; align-items: baseline; gap: $sp-1;
padding: $sp-1 $sp-2; border-radius: $r-pill;
background: rgba($subject-ink, .78);
color: $stage-paper; font-weight: 700; font-size: 11px;
font-variant-numeric: tabular-nums;
}
.rd__track {
position: relative;
width: 100%;
height: 24px;
margin: 0 $sp-1;
border-radius: $r-pill;
background: mix($subject-blue, $stage-paper, 14%);
}
.rd__rail {
position: absolute; left: $sp-3; right: $sp-3; top: 50%;
height: 3px; transform: translateY(-50%);
border-radius: $r-pill;
background: rgba($subject-ink, .18);
}
.rd__grab {
position: absolute; top: 50%; left: 50%;
width: 26px; height: 26px;
margin: 0; padding: 0; border: 0; border-radius: 50%;
display: grid; place-items: center;
background: $subject-blue-deep;
color: $stage-paper;
transform: translate(-50%, -50%);
cursor: ew-resize;
touch-action: none;
}
.rd__grab:focus-visible { outline: 2px solid $subject-blue-deep; outline-offset: 2px; }
.rd__ic { width: 13px; height: 13px; }
.rd__hint { margin: 0; padding: 0 $sp-1; font-size: 11px; line-height: 16px; color: rgba($subject-ink, .62); text-align: center; }
@media (max-width: 340px) {
.rd { padding: $sp-2; gap: $sp-1; }
.rd__hint { display: none; }
.rd__zone { width: min(200px, 100%); }
.rd__label { font-size: 9px; }
.rd__grab { width: 22px; height: 22px; }
.rd__badge { font-size: 10px; padding: 0 $sp-1; }
}
// reduce — rAF 루프를 시작하지 않는다. 입력은 current=value 즉시 반영 후 paint() 1회.
@media (prefers-reduced-motion: reduce) {
.rd.is-still .rd__poly { transition: none !important; }
}html, body {
margin: 0;
overflow: hidden;
}
.stage {
box-sizing: border-box;
min-height: 100vh;
display: grid;
place-items: center;
margin: 0;
background: #17141a;
font-family: -apple-system, "Segoe UI", "Noto Sans KR", sans-serif;
padding: clamp(8px, 4vw, 24px);
}
.sr {
position: absolute;
width: 1px;
height: 1px;
overflow: hidden;
clip-path: inset(50%);
white-space: nowrap;
}
.rd {
box-sizing: border-box;
width: min(340px, 92vw);
margin: 0;
padding: 4px;
display: flex;
flex-direction: column;
gap: 4px;
align-items: center;
border-radius: 16px;
background: #ffffff;
box-shadow: 0 14px 24px rgba(23, 20, 26, 0.32);
color: #17141a;
}
.rd__zone {
position: relative;
width: min(296px, 100%);
aspect-ratio: 480/300;
}
.rd__chart {
display: block;
width: 100%;
height: 100%;
overflow: visible;
}
.rd__ring {
fill: none;
stroke: rgba(23, 20, 26, 0.14);
stroke-width: 1;
}
.rd__axis {
stroke: rgba(23, 20, 26, 0.22);
stroke-width: 1;
}
.rd__label {
font-size: 11px;
font-weight: 700;
fill: rgba(23, 20, 26, 0.62);
}
.rd__poly {
fill: rgb(39.6392156863%, 57.631372549%, 97.3882352941%);
stroke: #0a4fe8;
stroke-width: 4;
stroke-linejoin: round;
}
.rd__pt {
fill: #0a4fe8;
stroke: #ffffff;
stroke-width: 2;
r: 6;
}
.rd__badge {
position: absolute;
left: 8px;
top: 8px;
display: flex;
align-items: baseline;
gap: 4px;
padding: 4px 8px;
border-radius: 999px;
background: rgba(23, 20, 26, 0.78);
color: #ffffff;
font-weight: 700;
font-size: 11px;
font-variant-numeric: tabular-nums;
}
.rd__track {
position: relative;
width: 100%;
height: 24px;
margin: 0 4px;
border-radius: 999px;
background: rgb(88.5803921569%, 91.9843137255%, 99.5058823529%);
}
.rd__rail {
position: absolute;
left: 12px;
right: 12px;
top: 50%;
height: 3px;
transform: translateY(-50%);
border-radius: 999px;
background: rgba(23, 20, 26, 0.18);
}
.rd__grab {
position: absolute;
top: 50%;
left: 50%;
width: 26px;
height: 26px;
margin: 0;
padding: 0;
border: 0;
border-radius: 50%;
display: grid;
place-items: center;
background: #0a4fe8;
color: #ffffff;
transform: translate(-50%, -50%);
cursor: ew-resize;
touch-action: none;
}
.rd__grab:focus-visible {
outline: 2px solid #0a4fe8;
outline-offset: 2px;
}
.rd__ic {
width: 13px;
height: 13px;
}
.rd__hint {
margin: 0;
padding: 0 4px;
font-size: 11px;
line-height: 16px;
color: rgba(23, 20, 26, 0.62);
text-align: center;
}
@media (max-width: 340px) {
.rd {
padding: 8px;
gap: 4px;
}
.rd__hint {
display: none;
}
.rd__zone {
width: min(200px, 100%);
}
.rd__label {
font-size: 9px;
}
.rd__grab {
width: 22px;
height: 22px;
}
.rd__badge {
font-size: 10px;
padding: 0 4px;
}
}
@media (prefers-reduced-motion: reduce) {
.rd.is-still .rd__poly {
transition: none !important;
}
}// 실제 동작: pointerdown/move/up 과 keydown 이 Axis A Value(5~100)을 바꾸면, 나머지 B~E 축은
// 각자 독립된 사인 곡선으로 계속 움직이며, 5개 Value 전부를 극좌표 점으로 바꿔 그 점들을
// 순서대로 이은 다각형 경로(path d 속성)를 매 프레임 다시 계산해 그린다.
// CSS @keyframes 없음(다섯 Axis 모두 매 프레임 실수 값으로 바뀌어 선언형으로 못 담는다,
// 398-01~04 와 같은 이유).
var root = document.getElementById('rd');
var zone = document.getElementById('zone');
var track = document.getElementById('track');
var grab = document.getElementById('grab');
var gridG = document.getElementById('grid');
var axesG = document.getElementById('axes');
var polyEl = document.getElementById('poly');
var ptsG = document.getElementById('pts');
var valEl = document.getElementById('rd-val');
var live = document.getElementById('rd-live');
var srBody = document.getElementById('sr-body');
var CX = 240, CY = 158, R = 96; // picker-graph-radar-radius — 레이더 반지름
var AXIS_COUNT = 5;
var LABELS = ['A', 'B', 'C', 'D', 'E'];
var MIN_V = 5, MAX_V = 100;
var LERP_RATE = 0.20;
var STEP = 5;
var PERIODS = [0, 1.5, 1.2, 1.8, 1.4];
var PHASES = [0, 1.1, 2.4, 0.4, 3.3];
var BASE_V = [55, 52, 55, 50, 52];
var AMP_V = [0, 44, 42, 44, 40];
var values = BASE_V.slice();
var current = BASE_V.slice();
var manual = false;
var autoT = 0;
var lastTs = 0;
var trackRect = null;
var rafId = 0;
var pointEls = [];
function reduced() {
return window.matchMedia && window.matchMedia('(prefers-reduced-motion: reduce)').matches;
}
function angleOf(i) { return -90 + (360 / AXIS_COUNT) * i; }
function polar(cx, cy, r, deg) {
var rad = deg * Math.PI / 180;
return { x: cx + r * Math.cos(rad), y: cy + r * Math.sin(rad) };
}
function buildStaticParts() {
var gridHtml = '';
[0.34, 0.68, 1].forEach(function (f) {
var d = '';
for (var i = 0; i < AXIS_COUNT; i++) {
var p = polar(CX, CY, R * f, angleOf(i));
d += (i === 0 ? 'M ' : 'L ') + p.x + ' ' + p.y;
}
gridHtml += '<path class="rd__ring" d="' + d + ' Z"></path>';
});
gridG.innerHTML = gridHtml;
var axesHtml = '';
for (var j = 0; j < AXIS_COUNT; j++) {
var e = polar(CX, CY, R, angleOf(j));
axesHtml += '<line class="rd__axis" x1="' + CX + '" y1="' + CY + '" x2="' + e.x + '" y2="' + e.y + '"></line>';
var lp = polar(CX, CY, R + 16, angleOf(j));
axesHtml += '<text class="rd__label" x="' + lp.x + '" y="' + lp.y + '" text-anchor="middle" dominant-baseline="central">' + LABELS[j] + '</text>';
}
axesG.innerHTML = axesHtml;
var ptsHtml = '';
for (var k = 0; k < AXIS_COUNT; k++) ptsHtml += '<circle class="rd__pt" id="pt' + k + '" r="5"></circle>';
ptsG.innerHTML = ptsHtml;
for (var m = 0; m < AXIS_COUNT; m++) pointEls.push(document.getElementById('pt' + m));
}
function paint() {
var d = '';
for (var i = 0; i < AXIS_COUNT; i++) {
var p = polar(CX, CY, R * (current[i] / 100), angleOf(i));
d += (i === 0 ? 'M ' : 'L ') + p.x + ' ' + p.y;
pointEls[i].setAttribute('cx', String(p.x));
pointEls[i].setAttribute('cy', String(p.y));
}
polyEl.setAttribute('d', d + ' Z');
var rv = Math.round(current[0]);
valEl.textContent = String(rv);
grab.style.left = ((values[0] - MIN_V) / (MAX_V - MIN_V) * 100) + '%';
grab.setAttribute('aria-valuenow', String(Math.round(values[0])));
grab.setAttribute('aria-valuetext', 'Axis A ' + Math.round(values[0]));
var rows = '';
for (var j = 0; j < AXIS_COUNT; j++) rows += '<tr><th>' + LABELS[j] + '</th><td>' + Math.round(current[j]) + '</td></tr>';
srBody.innerHTML = rows;
}
function announce() {
live.textContent = 'Axis A ' + Math.round(current[0]) + ' recomputed';
}
function setValue(v, isManual) {
values[0] = Math.max(MIN_V, Math.min(MAX_V, v));
if (isManual) { manual = true; root.classList.remove('is-demo'); }
}
function fromPointer(clientX) {
if (!trackRect) trackRect = track.getBoundingClientRect();
var ratio = (clientX - trackRect.left) / trackRect.width;
setValue(MIN_V + ratio * (MAX_V - MIN_V), true);
}
function reflectNow() {
current[0] = values[0];
paint();
announce();
}
function onDown(e) {
trackRect = track.getBoundingClientRect();
if (grab.setPointerCapture) { try { grab.setPointerCapture(e.pointerId); } catch (err) {} }
fromPointer(e.clientX);
if (reduced()) reflectNow();
}
function onMove(e) { fromPointer(e.clientX); if (reduced()) reflectNow(); }
function onUp() { announce(); }
function onTrackDown(e) { trackRect = track.getBoundingClientRect(); fromPointer(e.clientX); if (reduced()) reflectNow(); }
function onKey(e) {
var map = { ArrowLeft: -STEP, ArrowDown: -STEP, ArrowRight: STEP, ArrowUp: STEP };
if (e.key === 'Home') { setValue(MIN_V, true); e.preventDefault(); }
else if (e.key === 'End') { setValue(MAX_V, true); e.preventDefault(); }
else if (map[e.key] !== undefined) { setValue(values[0] + map[e.key], true); e.preventDefault(); }
else { return; }
if (reduced()) reflectNow();
}
function onResize() { trackRect = track.getBoundingClientRect(); if (reduced()) paint(); }
function autoStep(dt) {
autoT += dt;
if (!manual) {
var omega0 = 2 * Math.PI / 2.4;
values[0] = 55 + 40 * Math.sin(autoT * omega0);
}
for (var i = 1; i < AXIS_COUNT; i++) {
var omega = 2 * Math.PI / PERIODS[i];
values[i] = BASE_V[i] + AMP_V[i] * Math.sin(autoT * omega + PHASES[i]);
}
}
function frame(ts) {
if (!lastTs) lastTs = ts;
var dt = Math.min(0.05, (ts - lastTs) / 1000);
lastTs = ts;
autoStep(dt);
for (var i = 0; i < AXIS_COUNT; i++) current[i] += (values[i] - current[i]) * LERP_RATE;
paint();
rafId = requestAnimationFrame(frame);
}
buildStaticParts();
grab.addEventListener('pointerdown', onDown);
grab.addEventListener('pointermove', onMove);
grab.addEventListener('pointerup', onUp);
grab.addEventListener('keydown', onKey);
track.addEventListener('pointerdown', onTrackDown);
window.addEventListener('resize', onResize);
if (reduced()) {
root.classList.add('is-still');
current = values.slice();
paint();
} else {
paint();
rafId = requestAnimationFrame(frame);
}// RadarMultiAxisDrag — vanilla 판(run/398/demo/05-picker-graph-radar-multi-axis-drag/index.html) 의 React 포트.
// A 축 값(5~100)을 드래그·키보드로 정하면 B~E 축은 각자 독립된 사인 곡선으로 계속
// 움직이며, 5개 값을 극좌표 점으로 바꿔 이은 다각형 경로를 매 프레임 다시 계산해 그린다.
import { useEffect, useRef } from "react";
import styles from "./RadarMultiAxisDrag.module.scss";
type Box<T> = { current: T };
type KeyEvt = { key: string; preventDefault(): void };
type PtrEvt = { clientX: number; clientY: number; pointerId: number };
const CX = 240, CY = 158, R = 96; // picker-graph-radar-radius — 레이더 반지름
const AXIS_COUNT = 5;
const LABELS = ["A", "B", "C", "D", "E"];
const MIN_V = 5, MAX_V = 100;
const LERP_RATE = 0.20;
const STEP = 5;
const PERIODS = [0, 1.5, 1.2, 1.8, 1.4];
const PHASES = [0, 1.1, 2.4, 0.4, 3.3];
const BASE_V = [55, 52, 55, 50, 52];
const AMP_V = [0, 44, 42, 44, 40];
function angleOf(i: number): number {
return -90 + (360 / AXIS_COUNT) * i;
}
function polar(cx: number, cy: number, r: number, deg: number) {
const rad = (deg * Math.PI) / 180;
return { x: cx + r * Math.cos(rad), y: cy + r * Math.sin(rad) };
}
export default function RadarMultiAxisDrag() {
const rootRef = useRef<HTMLElement | null>(null);
const trackRef = useRef<HTMLDivElement | null>(null);
const grabRef = useRef<HTMLButtonElement | null>(null);
const polyRef = useRef<SVGPathElement | null>(null);
const ptRefs = useRef(new Array(AXIS_COUNT).fill(null)) as Box<(SVGCircleElement | null)[]>;
const valRef = useRef<HTMLElement | null>(null);
const liveRef = useRef<HTMLSpanElement | null>(null);
const srBodyRef = useRef<HTMLTableSectionElement | null>(null);
const values = useRef(BASE_V.slice()) as Box<number[]>;
const current = useRef(BASE_V.slice()) as Box<number[]>;
const manual = useRef(false) as Box<boolean>;
const autoT = useRef(0) as Box<number>;
const lastTs = useRef(0) as Box<number>;
const trackRect = useRef<DOMRect | null>(null) as Box<DOMRect | null>;
const rafId = useRef(0) as Box<number>;
function reduced(): boolean {
return window.matchMedia("(prefers-reduced-motion: reduce)").matches;
}
function paint(): void {
let d = "";
for (let i = 0; i < AXIS_COUNT; i++) {
const p = polar(CX, CY, R * (current.current[i] / 100), angleOf(i));
d += (i === 0 ? "M " : "L ") + p.x + " " + p.y;
ptRefs.current[i]?.setAttribute("cx", String(p.x));
ptRefs.current[i]?.setAttribute("cy", String(p.y));
}
polyRef.current?.setAttribute("d", d + " Z");
const rv = Math.round(current.current[0]);
if (valRef.current) valRef.current.textContent = String(rv);
const grab = grabRef.current;
if (grab) {
grab.style.left = ((values.current[0] - MIN_V) / (MAX_V - MIN_V)) * 100 + "%";
grab.setAttribute("aria-valuenow", String(Math.round(values.current[0])));
grab.setAttribute("aria-valuetext", "A 축 " + Math.round(values.current[0]));
}
if (srBodyRef.current) {
let rows = "";
for (let j = 0; j < AXIS_COUNT; j++) rows += "<tr><th>" + LABELS[j] + "</th><td>" + Math.round(current.current[j]) + "</td></tr>";
srBodyRef.current.innerHTML = rows;
}
}
function announce(): void {
if (liveRef.current) liveRef.current.textContent = "A 축 " + Math.round(current.current[0]) + "로 다시 계산됨";
}
function setValue(v: number, isManual: boolean): void {
values.current[0] = Math.max(MIN_V, Math.min(MAX_V, v));
if (isManual) {
manual.current = true;
rootRef.current?.classList.remove("is-demo");
}
}
function fromPointer(clientX: number): void {
if (!trackRect.current && trackRef.current) trackRect.current = trackRef.current.getBoundingClientRect();
const rect = trackRect.current;
if (!rect) return;
const ratio = (clientX - rect.left) / rect.width;
setValue(MIN_V + ratio * (MAX_V - MIN_V), true);
}
function reflectNow(): void {
current.current[0] = values.current[0];
paint();
announce();
}
function onDown(e: PtrEvt): void {
if (trackRef.current) trackRect.current = trackRef.current.getBoundingClientRect();
const grab = grabRef.current;
if (grab && typeof grab.setPointerCapture === "function") {
try { grab.setPointerCapture(e.pointerId); } catch { /* 캡처 실패는 치명적이지 않다 */ }
}
fromPointer(e.clientX);
if (reduced()) reflectNow();
}
function onMove(e: PtrEvt): void {
fromPointer(e.clientX);
if (reduced()) reflectNow();
}
function onUp(): void {
announce();
}
function onTrackDown(e: PtrEvt): void {
if (trackRef.current) trackRect.current = trackRef.current.getBoundingClientRect();
fromPointer(e.clientX);
if (reduced()) reflectNow();
}
function onKey(e: KeyEvt): void {
const map: Record<string, number> = { ArrowLeft: -STEP, ArrowDown: -STEP, ArrowRight: STEP, ArrowUp: STEP };
if (e.key === "Home") { setValue(MIN_V, true); e.preventDefault(); }
else if (e.key === "End") { setValue(MAX_V, true); e.preventDefault(); }
else if (map[e.key] !== undefined) { setValue(values.current[0] + map[e.key], true); e.preventDefault(); }
else { return; }
if (reduced()) reflectNow();
}
function onResize(): void {
if (trackRef.current) trackRect.current = trackRef.current.getBoundingClientRect();
if (reduced()) paint();
}
function autoStep(dt: number): void {
autoT.current += dt;
if (!manual.current) {
const omega0 = (2 * Math.PI) / 2.4;
values.current[0] = 55 + 40 * Math.sin(autoT.current * omega0);
}
for (let i = 1; i < AXIS_COUNT; i++) {
const omega = (2 * Math.PI) / PERIODS[i];
values.current[i] = BASE_V[i] + AMP_V[i] * Math.sin(autoT.current * omega + PHASES[i]);
}
}
function frame(ts: number): void {
if (!lastTs.current) lastTs.current = ts;
const dt = Math.min(0.05, (ts - lastTs.current) / 1000);
lastTs.current = ts;
autoStep(dt);
for (let i = 0; i < AXIS_COUNT; i++) current.current[i] += (values.current[i] - current.current[i]) * LERP_RATE;
paint();
rafId.current = requestAnimationFrame(frame);
}
useEffect(() => {
window.addEventListener("resize", onResize);
if (reduced()) {
rootRef.current?.classList.add("is-still");
current.current = values.current.slice();
paint();
} else {
paint();
rafId.current = requestAnimationFrame(frame);
}
return () => {
window.removeEventListener("resize", onResize);
cancelAnimationFrame(rafId.current);
};
// eslint-disable-next-line react-hooks/exhaustive-deps
}, []);
const rings = [0.34, 0.68, 1];
return (
<main className={styles.stage}>
<figure className={styles.rd + " is-demo"} ref={rootRef}>
<div className={styles.zone}>
<svg
className={styles.chart}
viewBox="0 0 480 300"
role="img"
aria-label="다섯 축의 값을 이은 레이더 그래프, A 축 값을 조정하면 다각형 경로 전체가 다시 계산된다"
>
<g>
{rings.map((f, ri) => {
let d = "";
for (let i = 0; i < AXIS_COUNT; i++) {
const p = polar(CX, CY, R * f, angleOf(i));
d += (i === 0 ? "M " : "L ") + p.x + " " + p.y;
}
return <path key={ri} className={styles.ring} d={d + " Z"} />;
})}
</g>
<g>
{Array.from({ length: AXIS_COUNT }).map((_, i) => {
const e = polar(CX, CY, R, angleOf(i));
const lp = polar(CX, CY, R + 16, angleOf(i));
return (
<g key={i}>
<line className={styles.axis} x1={CX} y1={CY} x2={e.x} y2={e.y} />
<text className={styles.label} x={lp.x} y={lp.y} textAnchor="middle" dominantBaseline="central">{LABELS[i]}</text>
</g>
);
})}
</g>
<path className={styles.poly} ref={polyRef} />
<g>
{Array.from({ length: AXIS_COUNT }).map((_, i) => (
<circle key={i} className={styles.pt} ref={(el: SVGCircleElement | null) => { ptRefs.current[i] = el; }} r={6} />
))}
</g>
</svg>
<b className={styles.badge} aria-hidden="true">A <span ref={valRef}>55</span></b>
</div>
<div className={styles.track} ref={trackRef} onPointerDown={onTrackDown}>
<span className={styles.rail} aria-hidden="true" />
<button
className={styles.grab}
ref={grabRef}
type="button"
role="slider"
aria-orientation="horizontal"
aria-label="A 축 값 고르기"
aria-valuemin={MIN_V}
aria-valuemax={MAX_V}
aria-valuenow={55}
aria-valuetext="A 축 55"
onPointerDown={onDown}
onPointerMove={onMove}
onPointerUp={onUp}
onKeyDown={onKey}
>
<svg className={styles.ic} viewBox="0 0 256 256" aria-hidden="true"><g fill="currentColor"><path d="M96 64v128a8 8 0 0 1-16 0V64a8 8 0 0 1 16 0m88 0v128a8 8 0 0 1-16 0V64a8 8 0 0 1 16 0" opacity=".2" /><path d="M188 32a8 8 0 0 0-8 8v176a8 8 0 0 0 16 0V40a8 8 0 0 0-8-8M76 32a8 8 0 0 0-8 8v176a8 8 0 0 0 16 0V40a8 8 0 0 0-8-8" /></g></svg>
</button>
</div>
<p className={styles.hint}>막대 위를 드래그하거나 화살표키를 누르면 A 축 값에 맞춰 다각형이 다시 그려집니다</p>
<div className={styles.sr}>
<span aria-live="polite" ref={liveRef} />
<table>
<caption>축별 값</caption>
<thead><tr><th>축</th><th>값</th></tr></thead>
<tbody ref={srBodyRef} />
</table>
</div>
</figure>
</main>
);
}05 Picker Whose Radar Shape Redraws as You Drag Each Axis Point — Measured area 9.604% · moving frames 23/23Original by GODRICH · SCSS and React ship in the zip · 9 Graph Animation CSS Pickers With Live Recompute
The post this demo lives in
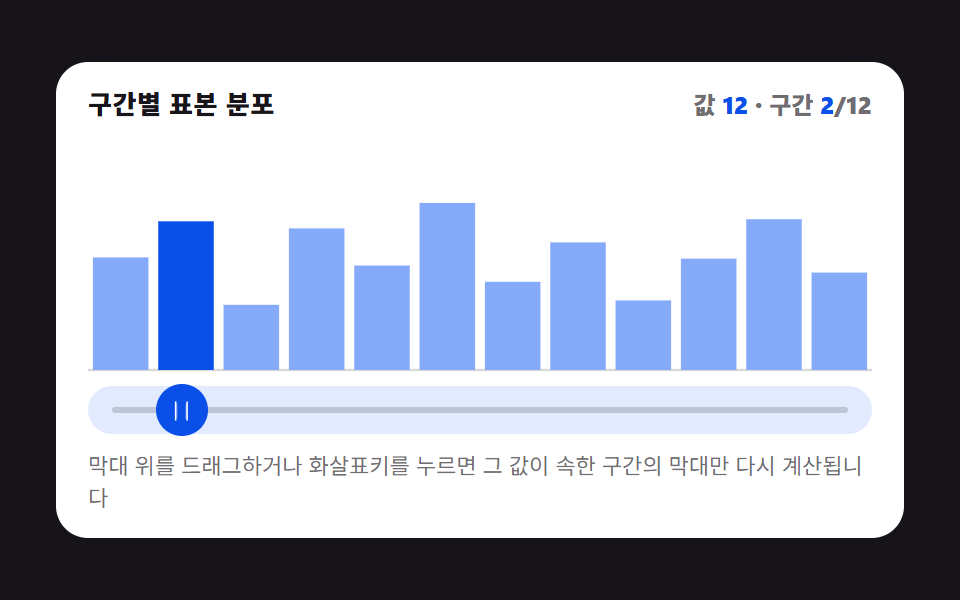 9 Graph Animation CSS Pickers With Live RecomputeMove a bar by pixel and the graph drifts from its value. So nine pickers recompute: bar height from a bucket value, a ga See all demos in this post
If you like this effect - similar demos
 Pickers01 Saturation and brightness square you dragCustom Color Picker: 9 JS Parts, No Library
 Pickers04 Span bar whose two handles push each other9 time picker ui patterns, from a point to a span
 Pickers03 Keyboard-arrow value toggle — each time a direction value changes, a highlighted-cell value moves across the gridDate Picker UI: 9 Popover & Calendar Patterns