08A Morph That Compares the Same Data as Rectangles and Circles
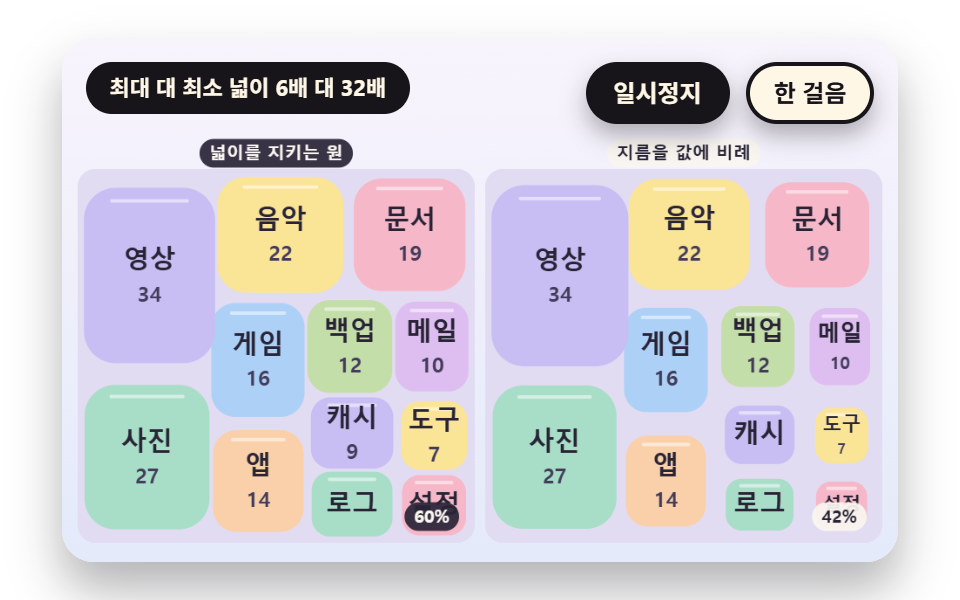
For each cell the radius r = √(area × FILL / π) keeps the area ratios, so a rectangle turns into a circle scaled down by the same factor. The center is interpolated from the rectangle center to the circle layout center, overlapping circles push apart, and the board on the right makes the diameter proportional to the value so large values look far bigger than they are as the contrast.
Best forComparisons that show how chart type changes the size impression
FILLpushApartPUSH_ROUNDS
<main class="stage">
<div class="vj is-demo" id="vj">
  <div class="vj__pad" data-role="pad" tabindex="0" role="application" aria-label="Treemap stage: arrow keys move between cells, Enter picks, P pauses, N steps once, R restarts">
    <canvas class="vj__canvas" data-role="canvas" width="480" height="300" role="img" aria-label="Twelve cells morph from rectangles into circles and back. Left circles use an area-keeping radius while right circles take their diameter in proportion to the value so large values look much bigger, and circles that overlap push each other apart. The corner number is the share of the board covered by the circle areas"></canvas>
  </div>
  <p class="vj__status" data-role="status" aria-live="off">Treemap demo</p>
  <div class="vj__ctrl">
    <button class="vj__pause" data-role="pause" type="button" aria-pressed="false">Pause</button>
    <button class="vj__step" data-role="step" type="button">Step</button>
  </div>
  <p class="vj__done" data-role="done" role="status" aria-live="polite"></p>
</div>
</main>
@use "../../../../site/static/demo-tokens" as *;
@include stage($stage-paper);
.vj {
position: relative;
width: min(92vw, calc(160vh - 12.8vw));
aspect-ratio: 480 / 300;
margin: 0 auto;
border-radius: $r-card;
overflow: hidden;
box-shadow: $shadow-raised;
background: $subject-cream;
}
// 무대 상자 — 여기서 시작한 터치만 칸 누르기로 읽는다(touch-action: none 은 이 상자에만). 무대 밖 터치는 페이지 스크롤 그대로
.vj__pad {
position: absolute;
inset: 0;
border-radius: inherit;
outline: none;
touch-action: none;
cursor: pointer;
}
// 바깥 .vj 가 넘침을 자르므로 포커스 테두리는 안쪽으로 들인다
.vj__pad:focus-visible {
outline: 3px solid $subject-ink;
outline-offset: -3px;
}
.vj__canvas {
position: absolute;
inset: 0;
display: block;
width: 100%;
height: 100%;
}
.vj__ctrl {
position: absolute;
right: $sp-3;
top: $sp-3;
display: flex;
gap: $sp-2;
}
.vj__pause,
.vj__step {
padding: $sp-1 $sp-3;
border: 2px solid $subject-ink;
border-radius: $r-pill;
background: $subject-ink;
color: $subject-cream;
font-family: inherit;
font-weight: 700;
font-size: 12px;
line-height: 1.6;
cursor: pointer;
box-shadow: $shadow-press;
transition: transform $dur-quick $ease-spring;
}
.vj__step {
background: $subject-cream;
color: $subject-ink;
}
// 스크린리더에만 읽히는 완료 알림
.vj__done {
position: absolute;
width: 1px;
height: 1px;
margin: 0;
overflow: hidden;
clip-path: inset(50%);
white-space: nowrap;
}
// 눌린 상태(멈춤) — 바탕과 글자색을 뒤집어 aria-pressed 가 눈에도 보이게
.vj__pause[aria-pressed="true"] {
background: $subject-cream;
color: $subject-ink;
}
.vj__pause:hover,
.vj__step:hover {
transform: translateY(-2px);
}
.vj__pause:active,
.vj__step:active {
transform: translateY(1px);
}
.vj__pause:focus-visible,
.vj__step:focus-visible {
outline: 3px solid $subject-ink;
outline-offset: 3px;
}
// 상태 줄 — 지금 장면의 수치를 글자로. 시연 중에는 aria-live off, 사람이 처음 손대면 polite
.vj__status {
position: absolute;
left: $sp-3;
top: $sp-3;
max-width: calc(100% - 190px);
margin: 0;
padding: $sp-1 $sp-3;
border-radius: $r-pill;
background: $subject-ink;
color: $subject-cream;
font-weight: 700;
font-size: 11px;
line-height: 1.6;
white-space: nowrap;
overflow: hidden;
text-overflow: ellipsis;
pointer-events: none;
}
@media (max-width: 340px) {
.vj__pause,
.vj__step,
.vj__status { font-size: 10px; padding: 0 $sp-2; }
}
// 움직임 줄이기 — 장면은 스크립트가 정지 장면 한 장으로 멈춘다. 버튼도 떠오르지 않게
@media (prefers-reduced-motion: reduce) {
.vj__pause,
.vj__step { transition: none !important; }
.vj__pause:hover,
.vj__pause:active,
.vj__step:hover,
.vj__step:active { transform: none !important; }
}html, body {
margin: 0;
overflow: hidden;
}
.stage {
box-sizing: border-box;
min-height: 100vh;
display: grid;
place-items: center;
margin: 0;
background: #ffffff;
font-family: -apple-system, "Segoe UI", "Noto Sans KR", sans-serif;
padding: clamp(8px, 4vw, 24px);
}
.vj {
position: relative;
width: min(92vw, 160vh - 12.8vw);
aspect-ratio: 480/300;
margin: 0 auto;
border-radius: 16px;
overflow: hidden;
box-shadow: 0 14px 24px rgba(23, 20, 26, 0.32);
background: #fff7e6;
}
.vj__pad {
position: absolute;
inset: 0;
border-radius: inherit;
outline: none;
touch-action: none;
cursor: pointer;
}
.vj__pad:focus-visible {
outline: 3px solid #17141a;
outline-offset: -3px;
}
.vj__canvas {
position: absolute;
inset: 0;
display: block;
width: 100%;
height: 100%;
}
.vj__ctrl {
position: absolute;
right: 12px;
top: 12px;
display: flex;
gap: 8px;
}
.vj__pause,
.vj__step {
padding: 4px 12px;
border: 2px solid #17141a;
border-radius: 999px;
background: #17141a;
color: #fff7e6;
font-family: inherit;
font-weight: 700;
font-size: 12px;
line-height: 1.6;
cursor: pointer;
box-shadow: 0 6px 12px rgba(23, 20, 26, 0.32);
transition: transform 220ms cubic-bezier(0.2, 0.8, 0.2, 1);
}
.vj__step {
background: #fff7e6;
color: #17141a;
}
.vj__done {
position: absolute;
width: 1px;
height: 1px;
margin: 0;
overflow: hidden;
clip-path: inset(50%);
white-space: nowrap;
}
.vj__pause[aria-pressed=true] {
background: #fff7e6;
color: #17141a;
}
.vj__pause:hover,
.vj__step:hover {
transform: translateY(-2px);
}
.vj__pause:active,
.vj__step:active {
transform: translateY(1px);
}
.vj__pause:focus-visible,
.vj__step:focus-visible {
outline: 3px solid #17141a;
outline-offset: 3px;
}
.vj__status {
position: absolute;
left: 12px;
top: 12px;
max-width: calc(100% - 190px);
margin: 0;
padding: 4px 12px;
border-radius: 999px;
background: #17141a;
color: #fff7e6;
font-weight: 700;
font-size: 11px;
line-height: 1.6;
white-space: nowrap;
overflow: hidden;
text-overflow: ellipsis;
pointer-events: none;
}
@media (max-width: 340px) {
.vj__pause,
.vj__step,
.vj__status {
font-size: 10px;
padding: 0 8px;
}
}
@media (prefers-reduced-motion: reduce) {
.vj__pause,
.vj__step {
transition: none !important;
}
.vj__pause:hover,
.vj__pause:active,
.vj__step:hover,
.vj__step:active {
transform: none !important;
}
}(function () {
const root = document.getElementById("vj");
if (!root) return;
// 무대 좌표 — 캔버스 안 계산은 늘 480×300. 화면에 보이는 크기와 상관없다
const W = 480;
const H = 300;
const TAU = Math.PI * 2;
function clamp(v, lo, hi) { return v < lo ? lo : (v > hi ? hi : v); }
function lerp(a, b, k) { return a + (b - a) * k; }
function ease(x) { const c = clamp(x, 0, 1); return c * c * (3 - 2 * c); }
// 끝에서 한 번 넘쳤다 돌아오는 곡선 — 칸이 자리에 튀어 나올 때
function backOut(x) {
const c = clamp(x, 0, 1) - 1;
return 1 + 2.70158 * c * c * c + 1.70158 * c * c;
}
// 시드 고정 난수 — 선형 합동 생성기(곱 1664525, 더함 1013904223). 같은 시드면 같은 수열
function seeded(seed) {
let s = (seed >>> 0) || 1;
return function () {
s = (Math.imul(s, 1664525) + 1013904223) >>> 0;
return s / 4294967296;
};
}
// 파스텔 팔레트 — 칸은 연한 면, 글자는 늘 진한 잉크
const BG_TOP = [248, 244, 252];
const BG_BOT = [228, 234, 250];
const BED = [226, 220, 242];
const INK = [40, 36, 54];
const INK2 = [66, 60, 90];
const PAPER = [250, 246, 240];
const NEUTRAL = [234, 232, 240];
const ROSE = [244, 162, 186];
const MINT = [148, 212, 182];
const TILES = [
[200, 190, 244], [168, 222, 200], [250, 228, 150], [246, 184, 200],
[172, 208, 246], [250, 208, 170], [196, 222, 170], [222, 190, 240],
];
function mix(a, b, k) { return [lerp(a[0], b[0], k), lerp(a[1], b[1], k), lerp(a[2], b[2], k)]; }
function rgba(c, a) {
return 'rgba(' + Math.round(clamp(c[0], 0, 255)) + ',' + Math.round(clamp(c[1], 0, 255)) + ',' + Math.round(clamp(c[2], 0, 255)) + ',' + clamp(a, 0, 1).toFixed(3) + ')';
}
// 장면 시계(초)·판 반복 번호·시간표 — 시간표는 (시각, 할 일) 목록이고 시각이 지나면 한 번씩 부른다
let sceneT = 0;
let lap = 0;
let script = [];
let evAt = 0;
function inset(r, p) {
return { x: r.x + p, y: r.y + p, w: Math.max(0, r.w - 2 * p), h: Math.max(0, r.h - 2 * p) };
}
function aspectOf(r) {
if (r.w <= 1e-6 || r.h <= 1e-6) {
return 99;
}
return r.w >= r.h ? r.w / r.h : r.h / r.w;
}
// 한 줄의 최악 가로세로 비 — areas 는 그 줄 칸들의 넓이, side 는 줄을 놓을 짧은 변의 길이
function worstRow(areas, side) {
let s = 0;
let mx = 0;
let mn = Infinity;
for (const a of areas) {
s += a;
if (a > mx) {
mx = a;
}
if (a < mn) {
mn = a;
}
}
const s2 = s * s;
const d2 = side * side;
return Math.max(d2 * mx / s2, s2 / (d2 * mn));
}
function squarify(vals, R) {
const n = vals.length;
const idx = [];
let total = 0;
for (let i = 0; i < n; i += 1) {
idx.push(i);
total += Math.max(vals[i], 1e-6);
}
idx.sort(function (a, b) { return vals[b] - vals[a] || a - b; });
const k = R.w * R.h / total;
const rects = [];
const rowOf = [];
for (let i = 0; i < n; i += 1) {
rects.push({ x: R.x, y: R.y, w: 0, h: 0 });
rowOf.push(0);
}
const rows = [];
let rx = R.x;
let ry = R.y;
let rw = R.w;
let rh = R.h;
let at = 0;
while (at < n) {
const side = Math.max(Math.min(rw, rh), 1e-6);
const row = [];
const areas = [];
let cur = Infinity;
while (at < n) {
const a = Math.max(vals[idx[at]], 1e-6) * k;
const next = areas.slice();
next.push(a);
const wr = worstRow(next, side);
if (areas.length > 0 && wr > cur) {
break;
}
areas.push(a);
row.push(idx[at]);
cur = wr;
at += 1;
}
let s = 0;
for (const a of areas) {
s += a;
}
if (rw >= rh) {
const cw = s / Math.max(rh, 1e-6);
let y = ry;
row.forEach(function (id, j) {
const h = areas[j] / Math.max(cw, 1e-6);
rects[id] = { x: rx, y: y, w: cw, h: h };
rowOf[id] = rows.length;
y += h;
});
rx += cw;
rw -= cw;
}
else {
const ch = s / Math.max(rw, 1e-6);
let x = rx;
row.forEach(function (id, j) {
const w = areas[j] / Math.max(ch, 1e-6);
rects[id] = { x: x, y: ry, w: w, h: ch };
rowOf[id] = rows.length;
x += w;
});
ry += ch;
rh -= ch;
}
rows.push(row);
}
return { rects: rects, rowOf: rowOf, rows: rows };
}
// One direction slice — 줄을 나누지 않고 입력 순서대로 세로 띠로만 자른다
function slice(vals, R) {
let total = 0;
for (const v of vals) {
total += Math.max(v, 1e-6);
}
let x = R.x;
return vals.map(function (v) {
const w = R.w * Math.max(v, 1e-6) / total;
const r = { x: x, y: R.y, w: w, h: R.h };
x += w;
return r;
});
}
function worstAspect(rs) {
let m = 1;
for (const r of rs) {
const a = aspectOf(r);
if (a > m) {
m = a;
}
}
return m;
}
function meanAspect(rs) {
let s = 0;
for (const r of rs) {
s += aspectOf(r);
}
return rs.length ? s / rs.length : 1;
}
// 스프링 — 네 변(왼·위·오른·아래)을 따로 목표로 끌어당긴다. k 는 스프링 상수, zeta 는 감쇠비
function springStep(cur, vel, tgt, k, zeta, dt) {
const c = 2 * zeta * Math.sqrt(k);
const n = Math.max(1, Math.ceil(dt * 120));
const h = dt / n;
for (let s = 0; s < n; s += 1) {
for (let j = 0; j < cur.length; j += 1) {
vel[j] += (-k * (cur[j] - tgt[j]) - c * vel[j]) * h;
cur[j] += vel[j] * h;
}
}
}
function edgesOf(r) { return [r.x, r.y, r.x + r.w, r.y + r.h]; }
function rectOf(e) { return { x: e[0], y: e[1], w: e[2] - e[0], h: e[3] - e[1] }; }
// ── 자체 가상 데이터 ──────────────────────────────────────
const NAMES = [
'Video', 'Photos', 'Music', 'Docs', 'Games', 'Apps', 'Backup', 'Mail', 'Cache', 'Logs', 'Tools', 'Config',
'Fonts', 'Books', 'Maps', 'Translate', 'Sketch', 'Audio', 'Templates', 'Zips', 'Temp', 'Shared', 'Archive', 'Other',
];
// 큰 순서로 놓인 값 24개
const BASE = [34, 27, 22, 19, 16, 14, 12, 10, 9, 8, 7, 6, 5.5, 5, 4.4, 4, 3.4, 3, 2.6, 2.3, 2, 1.7, 1.5, 1.3];
function leafOf(name, v) { return { name: name, v: v, kids: [] }; }
function groupOf(name, kids) {
let s = 0;
for (const k of kids) {
s += k.v;
}
return { name: name, v: s, kids: kids };
}
function sumOf(vals) { let s = 0; for (const v of vals) {
s += v;
} return s; }
function pct(v, total) { return String(Math.round(v / total * 1000) / 10); }
// ── 라벨 맞춤 ─────────────────────────────────────────────
// 글자 너비는 문자 수 × 글자 크기 × CHAR_W 로 어림 — 한글 한 자가 글자 크기만큼 차지하니 CHAR_W 는 1
const CHAR_W = 1;
const FONT_MAX = 15;
const FONT_STEP = 2;
const HIDE_MIN = 8;
function estW(s, px) { return s.length * px * CHAR_W; }
// 칸 안쪽(양쪽 3px 여백)에 들어가는 가장 큰 글자 크기 — 최소 크기에서도 넘치면 0(감춤)
function fitPx(s, r) {
for (let px = FONT_MAX; px >= HIDE_MIN; px -= FONT_STEP) {
if (estW(s, px) <= r.w - 6 && px * 1.3 <= r.h - 4) {
return px;
}
}
return 0;
}
const canvasEl = root.querySelector('[data-role="canvas"]');
const padEl = root.querySelector('[data-role="pad"]');
const pauseEl = root.querySelector('[data-role="pause"]');
const statusEl = root.querySelector('[data-role="status"]');
const stepEl = root.querySelector('[data-role="step"]');
const doneEl = root.querySelector('[data-role="done"]');
const ctxRaw = canvasEl ? canvasEl.getContext('2d') : null;
if (!canvasEl || !ctxRaw || !pauseEl || !padEl || !stepEl || !doneEl) {
return;
}
const cv = canvasEl;
const ctx = ctxRaw;
const pauseBtn = pauseEl;
const stepBtn = stepEl;
const doneP = doneEl;
const pad = padEl;
// 외부 웹폰트는 부르지 않는다 — 기기에 있는 Fonts 목록만
const FONT_STACK = 'system-ui, -apple-system, "Segoe UI", "Noto Sans KR", sans-serif';
let dpr = 1;
function fitCanvas() {
// 배율은 2 에서 자른다 — 배율 3 기기에서 화소가 2.25배로 늘지 않게
dpr = Math.min(window.devicePixelRatio || 1, 2);
cv.width = Math.round(W * dpr);
cv.height = Math.round(H * dpr);
ctx.setTransform(dpr, 0, 0, dpr, 0, 0);
}
function skyFill(top, bot) {
const g = ctx.createLinearGradient(0, 0, 0, H);
g.addColorStop(0, rgba(top, 1));
g.addColorStop(1, rgba(bot, 1));
ctx.fillStyle = g;
ctx.fillRect(0, 0, W, H);
}
function disc(x, y, r, c, a) {
if (r <= 0.2 || a <= 0) {
return;
}
ctx.beginPath();
ctx.arc(x, y, r, 0, TAU);
ctx.fillStyle = rgba(c, a);
ctx.fill();
}
function box(x, y, w, h, r, c, a) {
if (w <= 0.2 || h <= 0.2 || a <= 0) {
return;
}
ctx.beginPath();
ctx.roundRect(x, y, w, h, Math.max(0, Math.min(r, w / 2, h / 2)));
ctx.fillStyle = rgba(c, a);
ctx.fill();
}
function outline(x, y, w, h, r, width, c, a) {
if (w <= 0.2 || h <= 0.2 || a <= 0) {
return;
}
ctx.beginPath();
ctx.roundRect(x, y, w, h, Math.max(0, Math.min(r, w / 2, h / 2)));
ctx.lineWidth = width;
ctx.strokeStyle = rgba(c, a);
ctx.stroke();
}
function text(s, x, y, c, a, px, weight, align) {
ctx.font = weight + ' ' + px + 'px ' + FONT_STACK;
ctx.textAlign = align;
ctx.textBaseline = 'middle';
ctx.fillStyle = rgba(c, a);
ctx.fillText(s, x, y);
}
// 글자 이름표 — 바탕 알약 위에 글자
function tag(s, x, y, bg, fg, px, align) {
ctx.font = '700 ' + px + 'px ' + FONT_STACK;
const w = ctx.measureText(s).width + px * 1.1;
const left = align === 'center' ? x - w / 2 : (align === 'right' ? x - w : x);
box(left, y - px * 0.82, w, px * 1.64, px * 0.82, bg, 0.92);
text(s, left + w / 2, y + 0.5, fg, 1, px, 700, 'center');
}
// 판 자리 — 왼쪽 판·오른쪽 판(대비판)·한 판짜리 히어로. 위쪽은 상태 줄·버튼 자리
const PANEL_L = { x: 12, y: 78, w: 222, h: 208 };
const PANEL_R = { x: 246, y: 78, w: 222, h: 208 };
const PANEL_ONE = { x: 12, y: 60, w: 456, h: 228 };
// 판 바닥 — 칸 사이 틈으로 비치는 연보라
function bed(R) {
box(R.x - 3, R.y - 3, R.w + 6, R.h + 6, 10, BED, 1);
}
function panelTags(a, b) {
tag(a, PANEL_L.x + PANEL_L.w / 2, 66, INK, PAPER, 10, 'center');
tag(b, PANEL_R.x + PANEL_R.w / 2, 66, PAPER, INK, 10, 'center');
}
// 칸 한 장 — 둥근 면과 윗면 하이라이트. pop 은 자리에 튀어 나오는 배율(1 이면 그대로)
function tile(r, c, a, pop) {
if (a <= 0 || pop <= 0) {
return;
}
const cx = r.x + r.w / 2;
const cy = r.y + r.h / 2;
const w = Math.max(0, (r.w - 2) * pop);
const h = Math.max(0, (r.h - 2) * pop);
box(cx - w / 2, cy - h / 2, w, h, 5, c, a);
if (h > 12 && w > 8) {
box(cx - w / 2 + 2, cy - h / 2 + 1.5, w - 4, 2, 1, [255, 255, 255], 0.5 * a);
}
}
// 칸 안 글자 — 맞는 크기가 있으면 이름(과 자리가 되면 아래 줄 부제), 없으면 감춘다
function cellText(r, name, sub, a) {
const px = fitPx(name, r);
if (px === 0 || a <= 0) {
return;
}
const cx = r.x + r.w / 2;
const cy = r.y + r.h / 2;
const two = sub !== '' && r.h >= px * 2.6 && estW(sub, px - 3) <= r.w - 6;
text(name, cx, cy - (two ? px * 0.55 : 0), INK, a, px, 700, 'center');
if (two) {
text(sub, cx, cy + px * 0.75, INK2, a, px - 3, 600, 'center');
}
}
let shownStatus = '';
function pushStatus(s) {
if (!statusEl || s === shownStatus) {
return;
}
shownStatus = s;
statusEl.textContent = s;
}
let paused = false;
const reduceQuery = window.matchMedia('(prefers-reduced-motion: reduce)');
// 페이지를 연 채 움직임 줄이기 설정을 바꿔도 change 리스너가 다시 읽는다
let still = reduceQuery.matches;
// 자동 시연 표시 — 사람이 처음 손대면 떼고 상태 줄을 polite 로 켠다
let demo = root.classList.contains('is-demo');
const off = new AbortController();
// 사람이 직접 하는 중이면 시간표는 멈추고 애니메이션만 흐른다
let manual = false;
// curOn 이면 키보드 칸 고르기가 켜진 것 — ki 가 hits() 안 번호
let curOn = false;
let ki = 0;
function wake() {
if (!demo) {
return;
}
demo = false;
root.classList.remove('is-demo');
if (statusEl) {
statusEl.setAttribute('aria-live', 'polite');
}
}
function takeOver() {
if (manual) {
return;
}
manual = true;
onTake();
wake();
if (!curOn) {
curOn = true;
ki = 0;
}
}
// 한 판 시연이 끝났음을 스크린리더에 한 번만 알린다 — 판이 되풀이돼도 다시 읽지 않는다
let doneSaid = false;
function checkDone() {
if (!manual && !doneSaid && sceneT >= LAP_S - 0.6) {
doneSaid = true;
doneP.textContent = statusText();
}
}
function advance(dt) {
sceneT += dt;
if (!manual) {
while (evAt < script.length && script[evAt].t <= sceneT) {
const ev = script[evAt];
evAt += 1;
ev.f();
}
if (sceneT >= LAP_S) {
lap += 1;
begin();
return;
}
}
update(dt);
}
// 첫 판은 START_S 만큼 앞서 시작한다 — 칸이 이미 움직이는 중인 장면에서 보인다
function runTo(t) {
while (sceneT < t - 1e-6) {
advance(Math.min(1 / 30, t - sceneT));
}
}
function begin() {
sceneT = 0;
evAt = 0;
script = [];
build();
if (lap === 0 && !still) {
runTo(START_S);
}
}
const DT_MAX = 0.05;
const SETTLE_FRAMES = 8;
const SETTLE_DT = 0.04;
function drawCursor() {
if (!curOn) {
return;
}
const hs = hits();
if (hs.length === 0) {
return;
}
const h = hs[clamp(ki, 0, hs.length - 1)];
outline(h.x + 1, h.y + 1, h.w - 2, h.h - 2, 5, 3, INK, 1);
outline(h.x - 1, h.y - 1, h.w + 2, h.h + 2, 6, 1.5, PAPER, 0.9);
}
function cursorLabel() {
const hs = hits();
return hs.length === 0 ? statusText() : hs[clamp(ki, 0, hs.length - 1)].label;
}
function showNow() {
draw();
drawCursor();
pushStatus(curOn ? cursorLabel() : statusText());
checkDone();
}
let rafId = 0;
let lastTs = -1;
function frame(ts) {
if (still || paused) {
rafId = 0;
return;
}
if (lastTs < 0) {
lastTs = ts;
}
const dt = Math.min((ts - lastTs) / 1000, DT_MAX);
lastTs = ts;
if (dt > 0) {
advance(dt);
}
showNow();
rafId = window.requestAnimationFrame(frame);
}
function startLoop() {
if (rafId) {
return;
}
// 멈췄던 사이의 시간을 첫 프레임 dt 로 넘기지 않는다
lastTs = -1;
rafId = window.requestAnimationFrame(frame);
}
function stopLoop() {
if (rafId) {
window.cancelAnimationFrame(rafId);
rafId = 0;
}
}
// 움직임 줄이기 — 루프 없이 배치가 끝난 정지 장면 한 장
function showRest() {
stopLoop();
lap = 0;
sceneT = 0;
evAt = 0;
script = [];
build();
runTo(REST_S);
showNow();
}
// 움직임 줄이기이거나 멈춘 채 입력이 들어오면 트윈 없이 곧바로 끝 배치로 — 시간을 3초 흘려 스프링·애니메이션을 다 끝낸다
function settleStill() {
for (let k = 0; k < 90; k += 1) {
sceneT += 1 / 30;
update(1 / 30);
}
}
function play() {
begin();
showNow();
if (!paused) {
startLoop();
}
}
function togglePause() {
paused = !paused;
pauseBtn.setAttribute('aria-pressed', paused ? 'true' : 'false');
wake();
if (paused) {
stopLoop();
}
else if (!still) {
startLoop();
}
}
function restart() {
manual = false;
curOn = false;
doneSaid = false;
lap += 1;
begin();
for (let k = 0; k < SETTLE_FRAMES; k += 1) {
update(SETTLE_DT);
}
showNow();
}
// Step — 멈춘 채 시간표의 다음 일 하나를 부른다. 더 부를 일이 없거나 직접 하던 중이면 다음 판을 연다
function stepOnce() {
wake();
if (!paused) {
paused = true;
pauseBtn.setAttribute('aria-pressed', 'true');
stopLoop();
}
if (manual || evAt >= script.length) {
restart();
return;
}
sceneT = Math.max(sceneT, script[evAt].t);
advance(0);
for (let k = 0; k < SETTLE_FRAMES; k += 1) {
sceneT += SETTLE_DT;
update(SETTLE_DT);
}
showNow();
}
function moveCur(d) {
const n = hits().length;
if (n === 0) {
return;
}
ki = (ki + d + n) % n;
}
function actCur(i) {
onAct(i);
// 멈춘 채·움직임 줄이기에서도 입력이 화면에 바로 반영되게 한다
if (still || paused) {
settleStill();
}
}
pauseBtn.addEventListener('click', togglePause, { signal: off.signal });
stepBtn.addEventListener('click', stepOnce, { signal: off.signal });
// 키보드 — 무대에 포커스가 있을 때만. 방향키는 칸 이동, Enter·Space 는 칸 고르기, P 는 Pause, N 은 Step, R 은 다시
pad.addEventListener('keydown', function (e) {
if (e.altKey || e.ctrlKey || e.metaKey) {
return;
}
const k = e.key;
if (k === 'ArrowLeft' || k === 'ArrowUp') {
e.preventDefault();
takeOver();
moveCur(-1);
showNow();
}
else if (k === 'ArrowRight' || k === 'ArrowDown') {
e.preventDefault();
takeOver();
moveCur(1);
showNow();
}
else if (k === 'Enter' || k === ' ') {
e.preventDefault();
takeOver();
actCur(ki);
showNow();
}
else if (k === 'p' || k === 'P') {
togglePause();
}
else if (k === 'n' || k === 'N') {
stepOnce();
}
else if (k === 'r' || k === 'R') {
restart();
}
}, { signal: off.signal });
// 마우스·터치 — 누른 자리의 칸을 고른다
pad.addEventListener('click', function (e) {
const rect = cv.getBoundingClientRect();
const px = (e.clientX - rect.left) / rect.width * W;
const py = (e.clientY - rect.top) / rect.height * H;
const hs = hits();
let at = -1;
for (let i = 0; i < hs.length; i += 1) {
if (px >= hs[i].x && px <= hs[i].x + hs[i].w && py >= hs[i].y && py <= hs[i].y + hs[i].h) {
at = i;
}
}
if (at < 0) {
return;
}
takeOver();
ki = at;
actCur(at);
showNow();
}, { signal: off.signal });
// 탭이 숨으면 멈추고, 돌아오면 시계를 다시 맞춰 시작 — 숨은 동안의 몇 초가 한 프레임에 몰리지 않게
document.addEventListener('visibilitychange', function () {
if (document.hidden) {
stopLoop();
}
else if (!paused && !still) {
startLoop();
}
}, { signal: off.signal });
// 설정이 바뀌면 — 켜지면 배치가 끝난 한 장, 꺼지면 다시 움직인다
reduceQuery.addEventListener('change', function () {
still = reduceQuery.matches;
if (still) {
showRest();
}
else {
lap = 0;
play();
}
}, { signal: off.signal });
window.addEventListener('resize', function () {
fitCanvas();
showNow();
}, { signal: off.signal });
// 08 — 같은 데이터를 사각 칸과 원으로 오간다. 왼쪽은 넓이를 지키는 반지름 r = √(넓이 × FILL / π), 오른쪽은 지름을 값에 비례시킨다. 원끼리 겹치면 밀어낸다
const CELL_N = 12;
const FILL = 0.6;
const MORPH_S = 1.6;
const PUSH_ROUNDS = 80;
const LAP_S = 9.6;
const START_S = 0.5;
const REST_S = 2.6;
let vals = [];
let rectsL = [];
let rectsR = [];
let ballsL = [];
let ballsR = [];
let mp = 0;
let mTgt = 0;
// 사각형 중심에서 시작해 겹친 원을 서로 밀어내고 판 안으로 되돌리는 일을 PUSH_ROUNDS 번 되풀이
function pushApart(rs, radii, R) {
const bs = rs.map(function (r, i) { return { x: r.x + r.w / 2, y: r.y + r.h / 2, r: radii[i] }; });
for (let round = 0; round < PUSH_ROUNDS; round += 1) {
for (let i = 0; i < bs.length; i += 1) {
for (let j = i + 1; j < bs.length; j += 1) {
const dx = bs[j].x - bs[i].x;
const dy = bs[j].y - bs[i].y;
const d = Math.max(Math.hypot(dx, dy), 1e-6);
const over = bs[i].r + bs[j].r + 1.5 - d;
if (over > 0) {
const ux = dx / d;
const uy = dy / d;
// 작은 원이 더 많이 밀려난다
const wi = bs[j].r / (bs[i].r + bs[j].r);
bs[i].x -= ux * over * wi;
bs[i].y -= uy * over * wi;
bs[j].x += ux * over * (1 - wi);
bs[j].y += uy * over * (1 - wi);
}
}
}
for (const b of bs) {
b.x = clamp(b.x, R.x + b.r, R.x + R.w - b.r);
b.y = clamp(b.y, R.y + b.r, R.y + R.h - b.r);
}
}
return bs;
}
function build() {
vals = BASE.slice(0, CELL_N);
rectsL = squarify(vals, PANEL_L).rects;
rectsR = squarify(vals, PANEL_R).rects;
const radL = rectsL.map(function (r) { return Math.sqrt(r.w * r.h * FILL / Math.PI); });
// 오른쪽은 가장 큰 칸 지름을 왼쪽 가장 큰 원보다 10% 키우고 나머지를 값에 비례
const rBig = radL[0] * 1.1;
const radR = vals.map(function (v) { return rBig * v / vals[0]; });
ballsL = pushApart(rectsL, radL, PANEL_L);
ballsR = pushApart(rectsR, radR, PANEL_R);
mp = 0;
mTgt = 0;
[[0.5, 1], [4.3, 0], [5.9, 1], [8.3, 0]].forEach(function (c) {
script.push({ t: c[0], f: function () { mTgt = c[1]; } });
});
}
function update(dt) {
if (dt <= 0) {
return;
}
// 1.6초에 걸쳐 일정한 속도로 오가고 곡선은 그릴 때 입힌다
mp = mTgt > mp ? Math.min(mTgt, mp + dt / MORPH_S) : Math.max(mTgt, mp - dt / MORPH_S);
}
// 칸 하나 — 사각형과 원 사이를 p 로 오간다
function drawShape(r, b, i, p) {
const e = ease(p);
const cx = lerp(r.x + r.w / 2, b.x, e);
const cy = lerp(r.y + r.h / 2, b.y, e);
const w = lerp(r.w - 2, b.r * 2, e);
const h = lerp(r.h - 2, b.r * 2, e);
const col = TILES[i % 8];
box(cx - w / 2, cy - h / 2, w, h, lerp(5, Math.min(w, h) / 2, e), col, 1);
if (h > 12 && w > 8) {
box(cx - w / 2 + w * 0.2, cy - h / 2 + 1.5 + h * 0.05, w * 0.6, 2, 1, [255, 255, 255], 0.5);
}
cellText({ x: cx - w / 2, y: cy - h / 2, w: w, h: h }, NAMES[i], String(vals[i]), 1);
}
function areaShare(bs, R) {
let s = 0;
for (const b of bs) {
s += Math.PI * b.r * b.r;
}
return s / (R.w * R.h);
}
function draw() {
skyFill(BG_TOP, BG_BOT);
panelTags('Area-keeping circles', 'Diameter by value');
bed(PANEL_L);
bed(PANEL_R);
for (let i = CELL_N - 1; i >= 0; i -= 1) {
drawShape(rectsL[i], ballsL[i], i, mp);
drawShape(rectsR[i], ballsR[i], i, mp);
}
tag(Math.round(areaShare(ballsL, PANEL_L) * 100) + '%', PANEL_L.x + PANEL_L.w - 6, PANEL_L.y + PANEL_L.h - 12, INK, PAPER, 10, 'right');
tag(Math.round(areaShare(ballsR, PANEL_R) * 100) + '%', PANEL_R.x + PANEL_R.w - 6, PANEL_R.y + PANEL_R.h - 12, PAPER, INK, 10, 'right');
}
function statusText() {
const ratioL = (ballsL[0].r * ballsL[0].r) / (ballsL[CELL_N - 1].r * ballsL[CELL_N - 1].r);
const ratioR = (ballsR[0].r * ballsR[0].r) / (ballsR[CELL_N - 1].r * ballsR[CELL_N - 1].r);
return 'Max to min area {a}x vs {b}x'.replace('{a}', String(Math.round(ratioL))).replace('{b}', String(Math.round(ratioR)));
}
function hits() {
return rectsL.map(function (r, i) {
const b = ballsL[i];
const e = ease(mp);
const w = lerp(r.w, b.r * 2, e);
const h = lerp(r.h, b.r * 2, e);
const cx = lerp(r.x + r.w / 2, b.x, e);
const cy = lerp(r.y + r.h / 2, b.y, e);
return { x: cx - w / 2, y: cy - h / 2, w: w, h: h, label: '{n} value {v} - {p}% of total'.replace('{n}', NAMES[i]).replace('{v}', String(vals[i])).replace('{p}', pct(vals[i], sumOf(vals))) };
});
}
// 고른 칸을 누르면 모든 칸이 사각형과 원 사이를 오간다
function onAct(_i) { mTgt = mTgt > 0.5 ? 0 : 1; }
function onTake() { return; }
fitCanvas();
if (still) {
showRest();
}
else {
play();
}
return function () {
stopLoop();
off.abort();
};
})();// CirclePackMorphCompare - 같은 항목 vanilla index.html 의 React 판. 같은 계산을 useEffect 안에서 돌린다
import { useEffect, useRef } from "react";
import styles from "./CirclePackMorphCompare.module.scss";
const cx = (s: string): string => s.split(" ").map((n) => styles[n] ?? n).join(" ");
export default function CirclePackMorphCompare() {
const rootRef = useRef<HTMLDivElement | null>(null);
useEffect(() => {
const rootEl = rootRef.current;
if (!rootEl) return;
const root: HTMLElement = rootEl;
type RGB = [number, number, number];
type RGBA = [number, number, number, number];
// 무대 좌표 — 캔버스 안 계산은 늘 480×300. 화면에 보이는 크기와 상관없다
const W = 480;
const H = 300;
const TAU = Math.PI * 2;
function clamp(v: number, lo: number, hi: number): number { return v < lo ? lo : (v > hi ? hi : v); }
function lerp(a: number, b: number, k: number): number { return a + (b - a) * k; }
function ease(x: number): number { const c = clamp(x, 0, 1); return c * c * (3 - 2 * c); }
// 끝에서 한 번 넘쳤다 돌아오는 곡선 — 칸이 자리에 튀어 나올 때
function backOut(x: number): number {
const c = clamp(x, 0, 1) - 1;
return 1 + 2.70158 * c * c * c + 1.70158 * c * c;
}
// 시드 고정 난수 — 선형 합동 생성기(곱 1664525, 더함 1013904223). 같은 시드면 같은 수열
function seeded(seed: number): () => number {
let s = (seed >>> 0) || 1;
return function (): number {
s = (Math.imul(s, 1664525) + 1013904223) >>> 0;
return s / 4294967296;
};
}
// 파스텔 팔레트 — 칸은 연한 면, 글자는 늘 진한 잉크
const BG_TOP: RGB = [248, 244, 252];
const BG_BOT: RGB = [228, 234, 250];
const BED: RGB = [226, 220, 242];
const INK: RGB = [40, 36, 54];
const INK2: RGB = [66, 60, 90];
const PAPER: RGB = [250, 246, 240];
const NEUTRAL: RGB = [234, 232, 240];
const ROSE: RGB = [244, 162, 186];
const MINT: RGB = [148, 212, 182];
const TILES: RGB[] = [
[200, 190, 244], [168, 222, 200], [250, 228, 150], [246, 184, 200],
[172, 208, 246], [250, 208, 170], [196, 222, 170], [222, 190, 240],
];
function mix(a: RGB, b: RGB, k: number): RGB { return [lerp(a[0], b[0], k), lerp(a[1], b[1], k), lerp(a[2], b[2], k)]; }
function rgba(c: RGB, a: number): string {
return 'rgba(' + Math.round(clamp(c[0], 0, 255)) + ',' + Math.round(clamp(c[1], 0, 255)) + ',' + Math.round(clamp(c[2], 0, 255)) + ',' + clamp(a, 0, 1).toFixed(3) + ')';
}
// 장면 시계(초)·판 반복 번호·시간표 — 시간표는 (시각, 할 일) 목록이고 시각이 지나면 한 번씩 부른다
let sceneT = 0;
let lap = 0;
type Ev = { t: number; f: () => void };
let script: Ev[] = [];
let evAt = 0;
// ── 트리맵 계산 ───────────────────────────────────────────
type Rect = { x: number; y: number; w: number; h: number };
// 키보드·클릭 대상 — 칸 하나의 사각형(캔버스 좌표)과 읽어 줄 문장
type Hit = { x: number; y: number; w: number; h: number; label: string };
function inset(r: Rect, p: number): Rect {
return { x: r.x + p, y: r.y + p, w: Math.max(0, r.w - 2 * p), h: Math.max(0, r.h - 2 * p) };
}
function aspectOf(r: Rect): number {
if (r.w <= 1e-6 || r.h <= 1e-6) { return 99; }
return r.w >= r.h ? r.w / r.h : r.h / r.w;
}
// 한 줄의 최악 가로세로 비 — areas 는 그 줄 칸들의 넓이, side 는 줄을 놓을 짧은 변의 길이
function worstRow(areas: number[], side: number): number {
let s = 0;
let mx = 0;
let mn = Infinity;
for (const a of areas) { s += a; if (a > mx) { mx = a; } if (a < mn) { mn = a; } }
const s2 = s * s;
const d2 = side * side;
return Math.max(d2 * mx / s2, s2 / (d2 * mn));
}
// 줄 단위 배치 — 값을 큰 순서로 세우고, 줄에 칸을 더할 때마다 그 줄의 최악 비를 다시 재서 나빠지기 직전에 줄을 닫는다
type Lay = { rects: Rect[]; rowOf: number[]; rows: number[][] };
function squarify(vals: number[], R: Rect): Lay {
const n = vals.length;
const idx: number[] = [];
let total = 0;
for (let i = 0; i < n; i += 1) { idx.push(i); total += Math.max(vals[i], 1e-6); }
idx.sort(function (a: number, b: number): number { return vals[b] - vals[a] || a - b; });
const k = R.w * R.h / total;
const rects: Rect[] = [];
const rowOf: number[] = [];
for (let i = 0; i < n; i += 1) { rects.push({ x: R.x, y: R.y, w: 0, h: 0 }); rowOf.push(0); }
const rows: number[][] = [];
let rx = R.x;
let ry = R.y;
let rw = R.w;
let rh = R.h;
let at = 0;
while (at < n) {
const side = Math.max(Math.min(rw, rh), 1e-6);
const row: number[] = [];
const areas: number[] = [];
let cur = Infinity;
while (at < n) {
const a = Math.max(vals[idx[at]], 1e-6) * k;
const next = areas.slice();
next.push(a);
const wr = worstRow(next, side);
if (areas.length > 0 && wr > cur) { break; }
areas.push(a);
row.push(idx[at]);
cur = wr;
at += 1;
}
let s = 0;
for (const a of areas) { s += a; }
if (rw >= rh) {
const cw = s / Math.max(rh, 1e-6);
let y = ry;
row.forEach(function (id: number, j: number): void {
const h = areas[j] / Math.max(cw, 1e-6);
rects[id] = { x: rx, y: y, w: cw, h: h };
rowOf[id] = rows.length;
y += h;
});
rx += cw;
rw -= cw;
} else {
const ch = s / Math.max(rw, 1e-6);
let x = rx;
row.forEach(function (id: number, j: number): void {
const w = areas[j] / Math.max(ch, 1e-6);
rects[id] = { x: x, y: ry, w: w, h: ch };
rowOf[id] = rows.length;
x += w;
});
ry += ch;
rh -= ch;
}
rows.push(row);
}
return { rects: rects, rowOf: rowOf, rows: rows };
}
// 한 방향 슬라이스 — 줄을 나누지 않고 입력 순서대로 세로 띠로만 자른다
function slice(vals: number[], R: Rect): Rect[] {
let total = 0;
for (const v of vals) { total += Math.max(v, 1e-6); }
let x = R.x;
return vals.map(function (v: number): Rect {
const w = R.w * Math.max(v, 1e-6) / total;
const r = { x: x, y: R.y, w: w, h: R.h };
x += w;
return r;
});
}
function worstAspect(rs: Rect[]): number {
let m = 1;
for (const r of rs) { const a = aspectOf(r); if (a > m) { m = a; } }
return m;
}
function meanAspect(rs: Rect[]): number {
let s = 0;
for (const r of rs) { s += aspectOf(r); }
return rs.length ? s / rs.length : 1;
}
// 스프링 — 네 변(왼·위·오른·아래)을 따로 목표로 끌어당긴다. k 는 스프링 상수, zeta 는 감쇠비
function springStep(cur: number[], vel: number[], tgt: number[], k: number, zeta: number, dt: number): void {
const c = 2 * zeta * Math.sqrt(k);
const n = Math.max(1, Math.ceil(dt * 120));
const h = dt / n;
for (let s = 0; s < n; s += 1) {
for (let j = 0; j < cur.length; j += 1) {
vel[j] += (-k * (cur[j] - tgt[j]) - c * vel[j]) * h;
cur[j] += vel[j] * h;
}
}
}
function edgesOf(r: Rect): number[] { return [r.x, r.y, r.x + r.w, r.y + r.h]; }
function rectOf(e: number[]): Rect { return { x: e[0], y: e[1], w: e[2] - e[0], h: e[3] - e[1] }; }
// ── 자체 가상 데이터 ──────────────────────────────────────
const NAMES: string[] = [
'영상', '사진', '음악', '문서', '게임', '앱', '백업', '메일', '캐시', '로그', '도구', '설정',
'글꼴', '책', '지도', '번역', '스케치', '녹음', '템플릿', '압축', '임시', '공유', '보관', '기타',
];
// 큰 순서로 놓인 값 24개
const BASE: number[] = [34, 27, 22, 19, 16, 14, 12, 10, 9, 8, 7, 6, 5.5, 5, 4.4, 4, 3.4, 3, 2.6, 2.3, 2, 1.7, 1.5, 1.3];
// 계층 한 칸 — name 은 NAMES 번호, 잎이면 v 가 값이고 가지면 kids 값의 합
type Tree = { name: number; v: number; kids: Tree[] };
function leafOf(name: number, v: number): Tree { return { name: name, v: v, kids: [] }; }
function groupOf(name: number, kids: Tree[]): Tree {
let s = 0;
for (const k of kids) { s += k.v; }
return { name: name, v: s, kids: kids };
}
function sumOf(vals: number[]): number { let s = 0; for (const v of vals) { s += v; } return s; }
function pct(v: number, total: number): string { return String(Math.round(v / total * 1000) / 10); }
// ── 라벨 맞춤 ─────────────────────────────────────────────
// 글자 너비는 문자 수 × 글자 크기 × CHAR_W 로 어림 — 한글 한 자가 글자 크기만큼 차지하니 CHAR_W 는 1
const CHAR_W = 1;
const FONT_MAX = 15;
const FONT_STEP = 2;
const HIDE_MIN = 8;
function estW(s: string, px: number): number { return s.length * px * CHAR_W; }
// 칸 안쪽(양쪽 3px 여백)에 들어가는 가장 큰 글자 크기 — 최소 크기에서도 넘치면 0(감춤)
function fitPx(s: string, r: Rect): number {
for (let px = FONT_MAX; px >= HIDE_MIN; px -= FONT_STEP) {
if (estW(s, px) <= r.w - 6 && px * 1.3 <= r.h - 4) { return px; }
}
return 0;
}
const canvasEl = root.querySelector('[data-role="canvas"]') as HTMLCanvasElement | null;
const padEl = root.querySelector('[data-role="pad"]') as HTMLElement | null;
const pauseEl = root.querySelector('[data-role="pause"]') as HTMLButtonElement | null;
const statusEl = root.querySelector('[data-role="status"]') as HTMLElement | null;
const stepEl = root.querySelector('[data-role="step"]') as HTMLButtonElement | null;
const doneEl = root.querySelector('[data-role="done"]') as HTMLElement | null;
const ctxRaw = canvasEl ? canvasEl.getContext('2d') : null;
if (!canvasEl || !ctxRaw || !pauseEl || !padEl || !stepEl || !doneEl) { return; }
const cv: HTMLCanvasElement = canvasEl;
const ctx: CanvasRenderingContext2D = ctxRaw;
const pauseBtn: HTMLButtonElement = pauseEl;
const stepBtn: HTMLButtonElement = stepEl;
const doneP: HTMLElement = doneEl;
const pad: HTMLElement = padEl;
// 외부 웹폰트는 부르지 않는다 — 기기에 있는 글꼴 목록만
const FONT_STACK = 'system-ui, -apple-system, "Segoe UI", "Noto Sans KR", sans-serif';
let dpr = 1;
function fitCanvas(): void {
// 배율은 2 에서 자른다 — 배율 3 기기에서 화소가 2.25배로 늘지 않게
dpr = Math.min(window.devicePixelRatio || 1, 2);
cv.width = Math.round(W * dpr);
cv.height = Math.round(H * dpr);
ctx.setTransform(dpr, 0, 0, dpr, 0, 0);
}
function skyFill(top: RGB, bot: RGB): void {
const g = ctx.createLinearGradient(0, 0, 0, H);
g.addColorStop(0, rgba(top, 1));
g.addColorStop(1, rgba(bot, 1));
ctx.fillStyle = g;
ctx.fillRect(0, 0, W, H);
}
function disc(x: number, y: number, r: number, c: RGB, a: number): void {
if (r <= 0.2 || a <= 0) { return; }
ctx.beginPath();
ctx.arc(x, y, r, 0, TAU);
ctx.fillStyle = rgba(c, a);
ctx.fill();
}
function box(x: number, y: number, w: number, h: number, r: number, c: RGB, a: number): void {
if (w <= 0.2 || h <= 0.2 || a <= 0) { return; }
ctx.beginPath();
ctx.roundRect(x, y, w, h, Math.max(0, Math.min(r, w / 2, h / 2)));
ctx.fillStyle = rgba(c, a);
ctx.fill();
}
function outline(x: number, y: number, w: number, h: number, r: number, width: number, c: RGB, a: number): void {
if (w <= 0.2 || h <= 0.2 || a <= 0) { return; }
ctx.beginPath();
ctx.roundRect(x, y, w, h, Math.max(0, Math.min(r, w / 2, h / 2)));
ctx.lineWidth = width;
ctx.strokeStyle = rgba(c, a);
ctx.stroke();
}
function text(s: string, x: number, y: number, c: RGB, a: number, px: number, weight: number, align: CanvasTextAlign): void {
ctx.font = weight + ' ' + px + 'px ' + FONT_STACK;
ctx.textAlign = align;
ctx.textBaseline = 'middle';
ctx.fillStyle = rgba(c, a);
ctx.fillText(s, x, y);
}
// 글자 이름표 — 바탕 알약 위에 글자
function tag(s: string, x: number, y: number, bg: RGB, fg: RGB, px: number, align: CanvasTextAlign): void {
ctx.font = '700 ' + px + 'px ' + FONT_STACK;
const w = ctx.measureText(s).width + px * 1.1;
const left = align === 'center' ? x - w / 2 : (align === 'right' ? x - w : x);
box(left, y - px * 0.82, w, px * 1.64, px * 0.82, bg, 0.92);
text(s, left + w / 2, y + 0.5, fg, 1, px, 700, 'center');
}
// 판 자리 — 왼쪽 판·오른쪽 판(대비판)·한 판짜리 히어로. 위쪽은 상태 줄·버튼 자리
const PANEL_L: Rect = { x: 12, y: 78, w: 222, h: 208 };
const PANEL_R: Rect = { x: 246, y: 78, w: 222, h: 208 };
const PANEL_ONE: Rect = { x: 12, y: 60, w: 456, h: 228 };
// 판 바닥 — 칸 사이 틈으로 비치는 연보라
function bed(R: Rect): void {
box(R.x - 3, R.y - 3, R.w + 6, R.h + 6, 10, BED, 1);
}
function panelTags(a: string, b: string): void {
tag(a, PANEL_L.x + PANEL_L.w / 2, 66, INK, PAPER, 10, 'center');
tag(b, PANEL_R.x + PANEL_R.w / 2, 66, PAPER, INK, 10, 'center');
}
// 칸 한 장 — 둥근 면과 윗면 하이라이트. pop 은 자리에 튀어 나오는 배율(1 이면 그대로)
function tile(r: Rect, c: RGB, a: number, pop: number): void {
if (a <= 0 || pop <= 0) { return; }
const cx = r.x + r.w / 2;
const cy = r.y + r.h / 2;
const w = Math.max(0, (r.w - 2) * pop);
const h = Math.max(0, (r.h - 2) * pop);
box(cx - w / 2, cy - h / 2, w, h, 5, c, a);
if (h > 12 && w > 8) { box(cx - w / 2 + 2, cy - h / 2 + 1.5, w - 4, 2, 1, [255, 255, 255], 0.5 * a); }
}
// 칸 안 글자 — 맞는 크기가 있으면 이름(과 자리가 되면 아래 줄 부제), 없으면 감춘다
function cellText(r: Rect, name: string, sub: string, a: number): void {
const px = fitPx(name, r);
if (px === 0 || a <= 0) { return; }
const cx = r.x + r.w / 2;
const cy = r.y + r.h / 2;
const two = sub !== '' && r.h >= px * 2.6 && estW(sub, px - 3) <= r.w - 6;
text(name, cx, cy - (two ? px * 0.55 : 0), INK, a, px, 700, 'center');
if (two) { text(sub, cx, cy + px * 0.75, INK2, a, px - 3, 600, 'center'); }
}
let shownStatus = '';
function pushStatus(s: string): void {
if (!statusEl || s === shownStatus) { return; }
shownStatus = s;
statusEl.textContent = s;
}
let paused = false;
const reduceQuery = window.matchMedia('(prefers-reduced-motion: reduce)');
// 페이지를 연 채 움직임 줄이기 설정을 바꿔도 change 리스너가 다시 읽는다
let still = reduceQuery.matches;
// 자동 시연 표시 — 사람이 처음 손대면 떼고 상태 줄을 polite 로 켠다
let demo = root.classList.contains('is-demo');
const off = new AbortController();
// 사람이 직접 하는 중이면 시간표는 멈추고 애니메이션만 흐른다
let manual = false;
// curOn 이면 키보드 칸 고르기가 켜진 것 — ki 가 hits() 안 번호
let curOn = false;
let ki = 0;
function wake(): void {
if (!demo) { return; }
demo = false;
root.classList.remove('is-demo');
if (statusEl) { statusEl.setAttribute('aria-live', 'polite'); }
}
function takeOver(): void {
if (manual) { return; }
manual = true;
onTake();
wake();
if (!curOn) { curOn = true; ki = 0; }
}
// 한 판 시연이 끝났음을 스크린리더에 한 번만 알린다 — 판이 되풀이돼도 다시 읽지 않는다
let doneSaid = false;
function checkDone(): void {
if (!manual && !doneSaid && sceneT >= LAP_S - 0.6) {
doneSaid = true;
doneP.textContent = statusText();
}
}
function advance(dt: number): void {
sceneT += dt;
if (!manual) {
while (evAt < script.length && script[evAt].t <= sceneT) {
const ev = script[evAt];
evAt += 1;
ev.f();
}
if (sceneT >= LAP_S) { lap += 1; begin(); return; }
}
update(dt);
}
// 첫 판은 START_S 만큼 앞서 시작한다 — 칸이 이미 움직이는 중인 장면에서 보인다
function runTo(t: number): void {
while (sceneT < t - 1e-6) { advance(Math.min(1 / 30, t - sceneT)); }
}
function begin(): void {
sceneT = 0;
evAt = 0;
script = [];
build();
if (lap === 0 && !still) { runTo(START_S); }
}
const DT_MAX = 0.05;
const SETTLE_FRAMES = 8;
const SETTLE_DT = 0.04;
function drawCursor(): void {
if (!curOn) { return; }
const hs = hits();
if (hs.length === 0) { return; }
const h = hs[clamp(ki, 0, hs.length - 1)];
outline(h.x + 1, h.y + 1, h.w - 2, h.h - 2, 5, 3, INK, 1);
outline(h.x - 1, h.y - 1, h.w + 2, h.h + 2, 6, 1.5, PAPER, 0.9);
}
function cursorLabel(): string {
const hs = hits();
return hs.length === 0 ? statusText() : hs[clamp(ki, 0, hs.length - 1)].label;
}
function showNow(): void {
draw();
drawCursor();
pushStatus(curOn ? cursorLabel() : statusText());
checkDone();
}
let rafId = 0;
let lastTs = -1;
function frame(ts: number): void {
if (still || paused) { rafId = 0; return; }
if (lastTs < 0) { lastTs = ts; }
const dt = Math.min((ts - lastTs) / 1000, DT_MAX);
lastTs = ts;
if (dt > 0) { advance(dt); }
showNow();
rafId = window.requestAnimationFrame(frame);
}
function startLoop(): void {
if (rafId) { return; }
// 멈췄던 사이의 시간을 첫 프레임 dt 로 넘기지 않는다
lastTs = -1;
rafId = window.requestAnimationFrame(frame);
}
function stopLoop(): void {
if (rafId) { window.cancelAnimationFrame(rafId); rafId = 0; }
}
// 움직임 줄이기 — 루프 없이 배치가 끝난 정지 장면 한 장
function showRest(): void {
stopLoop();
lap = 0;
sceneT = 0;
evAt = 0;
script = [];
build();
runTo(REST_S);
showNow();
}
// 움직임 줄이기이거나 멈춘 채 입력이 들어오면 트윈 없이 곧바로 끝 배치로 — 시간을 3초 흘려 스프링·애니메이션을 다 끝낸다
function settleStill(): void {
for (let k = 0; k < 90; k += 1) { sceneT += 1 / 30; update(1 / 30); }
}
function play(): void {
begin();
showNow();
if (!paused) { startLoop(); }
}
function togglePause(): void {
paused = !paused;
pauseBtn.setAttribute('aria-pressed', paused ? 'true' : 'false');
wake();
if (paused) { stopLoop(); } else if (!still) { startLoop(); }
}
function restart(): void {
manual = false;
curOn = false;
doneSaid = false;
lap += 1;
begin();
for (let k = 0; k < SETTLE_FRAMES; k += 1) { update(SETTLE_DT); }
showNow();
}
// 한 걸음 — 멈춘 채 시간표의 다음 일 하나를 부른다. 더 부를 일이 없거나 직접 하던 중이면 다음 판을 연다
function stepOnce(): void {
wake();
if (!paused) {
paused = true;
pauseBtn.setAttribute('aria-pressed', 'true');
stopLoop();
}
if (manual || evAt >= script.length) {
restart();
return;
}
sceneT = Math.max(sceneT, script[evAt].t);
advance(0);
for (let k = 0; k < SETTLE_FRAMES; k += 1) { sceneT += SETTLE_DT; update(SETTLE_DT); }
showNow();
}
function moveCur(d: number): void {
const n = hits().length;
if (n === 0) { return; }
ki = (ki + d + n) % n;
}
function actCur(i: number): void {
onAct(i);
// 멈춘 채·움직임 줄이기에서도 입력이 화면에 바로 반영되게 한다
if (still || paused) { settleStill(); }
}
pauseBtn.addEventListener('click', togglePause, { signal: off.signal });
stepBtn.addEventListener('click', stepOnce, { signal: off.signal });
// 키보드 — 무대에 포커스가 있을 때만. 방향키는 칸 이동, Enter·Space 는 칸 고르기, P 는 일시정지, N 은 한 걸음, R 은 다시
pad.addEventListener('keydown', function (e: KeyboardEvent): void {
if (e.altKey || e.ctrlKey || e.metaKey) { return; }
const k = e.key;
if (k === 'ArrowLeft' || k === 'ArrowUp') {
e.preventDefault();
takeOver();
moveCur(-1);
showNow();
} else if (k === 'ArrowRight' || k === 'ArrowDown') {
e.preventDefault();
takeOver();
moveCur(1);
showNow();
} else if (k === 'Enter' || k === ' ') {
e.preventDefault();
takeOver();
actCur(ki);
showNow();
} else if (k === 'p' || k === 'P') {
togglePause();
} else if (k === 'n' || k === 'N') {
stepOnce();
} else if (k === 'r' || k === 'R') {
restart();
}
}, { signal: off.signal });
// 마우스·터치 — 누른 자리의 칸을 고른다
pad.addEventListener('click', function (e: MouseEvent): void {
const rect = cv.getBoundingClientRect();
const px = (e.clientX - rect.left) / rect.width * W;
const py = (e.clientY - rect.top) / rect.height * H;
const hs = hits();
let at = -1;
for (let i = 0; i < hs.length; i += 1) {
if (px >= hs[i].x && px <= hs[i].x + hs[i].w && py >= hs[i].y && py <= hs[i].y + hs[i].h) { at = i; }
}
if (at < 0) { return; }
takeOver();
ki = at;
actCur(at);
showNow();
}, { signal: off.signal });
// 탭이 숨으면 멈추고, 돌아오면 시계를 다시 맞춰 시작 — 숨은 동안의 몇 초가 한 프레임에 몰리지 않게
document.addEventListener('visibilitychange', function (): void {
if (document.hidden) { stopLoop(); } else if (!paused && !still) { startLoop(); }
}, { signal: off.signal });
// 설정이 바뀌면 — 켜지면 배치가 끝난 한 장, 꺼지면 다시 움직인다
reduceQuery.addEventListener('change', function (): void {
still = reduceQuery.matches;
if (still) { showRest(); } else { lap = 0; play(); }
}, { signal: off.signal });
window.addEventListener('resize', function (): void {
fitCanvas();
showNow();
}, { signal: off.signal });
// 08 — 같은 데이터를 사각 칸과 원으로 오간다. 왼쪽은 넓이를 지키는 반지름 r = √(넓이 × FILL / π), 오른쪽은 지름을 값에 비례시킨다. 원끼리 겹치면 밀어낸다
const CELL_N = 12;
const FILL = 0.6;
const MORPH_S = 1.6;
const PUSH_ROUNDS = 80;
const LAP_S = 9.6;
const START_S = 0.5;
const REST_S = 2.6;
type Ball = { x: number; y: number; r: number };
let vals: number[] = [];
let rectsL: Rect[] = [];
let rectsR: Rect[] = [];
let ballsL: Ball[] = [];
let ballsR: Ball[] = [];
let mp = 0;
let mTgt = 0;
// 사각형 중심에서 시작해 겹친 원을 서로 밀어내고 판 안으로 되돌리는 일을 PUSH_ROUNDS 번 되풀이
function pushApart(rs: Rect[], radii: number[], R: Rect): Ball[] {
const bs: Ball[] = rs.map(function (r: Rect, i: number): Ball { return { x: r.x + r.w / 2, y: r.y + r.h / 2, r: radii[i] }; });
for (let round = 0; round < PUSH_ROUNDS; round += 1) {
for (let i = 0; i < bs.length; i += 1) {
for (let j = i + 1; j < bs.length; j += 1) {
const dx = bs[j].x - bs[i].x;
const dy = bs[j].y - bs[i].y;
const d = Math.max(Math.hypot(dx, dy), 1e-6);
const over = bs[i].r + bs[j].r + 1.5 - d;
if (over > 0) {
const ux = dx / d;
const uy = dy / d;
// 작은 원이 더 많이 밀려난다
const wi = bs[j].r / (bs[i].r + bs[j].r);
bs[i].x -= ux * over * wi; bs[i].y -= uy * over * wi;
bs[j].x += ux * over * (1 - wi); bs[j].y += uy * over * (1 - wi);
}
}
}
for (const b of bs) {
b.x = clamp(b.x, R.x + b.r, R.x + R.w - b.r);
b.y = clamp(b.y, R.y + b.r, R.y + R.h - b.r);
}
}
return bs;
}
function build(): void {
vals = BASE.slice(0, CELL_N);
rectsL = squarify(vals, PANEL_L).rects;
rectsR = squarify(vals, PANEL_R).rects;
const radL = rectsL.map(function (r: Rect): number { return Math.sqrt(r.w * r.h * FILL / Math.PI); });
// 오른쪽은 가장 큰 칸 지름을 왼쪽 가장 큰 원보다 10% 키우고 나머지를 값에 비례
const rBig = radL[0] * 1.1;
const radR = vals.map(function (v: number): number { return rBig * v / vals[0]; });
ballsL = pushApart(rectsL, radL, PANEL_L);
ballsR = pushApart(rectsR, radR, PANEL_R);
mp = 0;
mTgt = 0;
[[0.5, 1], [4.3, 0], [5.9, 1], [8.3, 0]].forEach(function (c: number[]): void {
script.push({ t: c[0], f: function (): void { mTgt = c[1]; } });
});
}
function update(dt: number): void {
if (dt <= 0) { return; }
// 1.6초에 걸쳐 일정한 속도로 오가고 곡선은 그릴 때 입힌다
mp = mTgt > mp ? Math.min(mTgt, mp + dt / MORPH_S) : Math.max(mTgt, mp - dt / MORPH_S);
}
// 칸 하나 — 사각형과 원 사이를 p 로 오간다
function drawShape(r: Rect, b: Ball, i: number, p: number): void {
const e = ease(p);
const cx = lerp(r.x + r.w / 2, b.x, e);
const cy = lerp(r.y + r.h / 2, b.y, e);
const w = lerp(r.w - 2, b.r * 2, e);
const h = lerp(r.h - 2, b.r * 2, e);
const col = TILES[i % 8];
box(cx - w / 2, cy - h / 2, w, h, lerp(5, Math.min(w, h) / 2, e), col, 1);
if (h > 12 && w > 8) { box(cx - w / 2 + w * 0.2, cy - h / 2 + 1.5 + h * 0.05, w * 0.6, 2, 1, [255, 255, 255], 0.5); }
cellText({ x: cx - w / 2, y: cy - h / 2, w: w, h: h }, NAMES[i], String(vals[i]), 1);
}
function areaShare(bs: Ball[], R: Rect): number {
let s = 0;
for (const b of bs) { s += Math.PI * b.r * b.r; }
return s / (R.w * R.h);
}
function draw(): void {
skyFill(BG_TOP, BG_BOT);
panelTags('넓이를 지키는 원', '지름을 값에 비례');
bed(PANEL_L);
bed(PANEL_R);
for (let i = CELL_N - 1; i >= 0; i -= 1) {
drawShape(rectsL[i], ballsL[i], i, mp);
drawShape(rectsR[i], ballsR[i], i, mp);
}
tag(Math.round(areaShare(ballsL, PANEL_L) * 100) + '%', PANEL_L.x + PANEL_L.w - 6, PANEL_L.y + PANEL_L.h - 12, INK, PAPER, 10, 'right');
tag(Math.round(areaShare(ballsR, PANEL_R) * 100) + '%', PANEL_R.x + PANEL_R.w - 6, PANEL_R.y + PANEL_R.h - 12, PAPER, INK, 10, 'right');
}
function statusText(): string {
const ratioL = (ballsL[0].r * ballsL[0].r) / (ballsL[CELL_N - 1].r * ballsL[CELL_N - 1].r);
const ratioR = (ballsR[0].r * ballsR[0].r) / (ballsR[CELL_N - 1].r * ballsR[CELL_N - 1].r);
return '최대 대 최소 넓이 {a}배 대 {b}배'.replace('{a}', String(Math.round(ratioL))).replace('{b}', String(Math.round(ratioR)));
}
function hits(): Hit[] {
return rectsL.map(function (r: Rect, i: number): Hit {
const b = ballsL[i];
const e = ease(mp);
const w = lerp(r.w, b.r * 2, e);
const h = lerp(r.h, b.r * 2, e);
const cx = lerp(r.x + r.w / 2, b.x, e);
const cy = lerp(r.y + r.h / 2, b.y, e);
return { x: cx - w / 2, y: cy - h / 2, w: w, h: h, label: '{n} 값 {v} · 전체의 {p}%'.replace('{n}', NAMES[i]).replace('{v}', String(vals[i])).replace('{p}', pct(vals[i], sumOf(vals))) };
});
}
// 고른 칸을 누르면 모든 칸이 사각형과 원 사이를 오간다
function onAct(_i: number): void { mTgt = mTgt > 0.5 ? 0 : 1; }
function onTake(): void { return; }
fitCanvas();
if (still) { showRest(); } else { play(); }
return function (): void {
stopLoop();
off.abort();
};
}, []);
return (
<div className={cx("vj") + " is-demo"} ref={rootRef}>
<div className={cx("vj__pad")} data-role="pad" tabIndex={0} role="application" aria-label={'트리맵 시연 무대 — 방향키로 칸 이동, Enter 로 고르기, P 로 일시정지, N 으로 한 걸음, R 로 다시'}>
<canvas className={cx("vj__canvas")} data-role="canvas" width={480} height={300} role="img" aria-label={'열두 칸이 사각형에서 원으로 모양을 바꿨다 돌아온다. 왼쪽 원은 넓이를 지키는 반지름이고 오른쪽 원은 지름이 값에 비례해 큰 값이 훨씬 커 보이며, 원끼리 겹치면 서로 밀어낸다. 구석 숫자는 원 넓이의 합이 판에서 차지하는 비율이다'}></canvas>
</div>
<p className={cx("vj__status")} data-role="status" aria-live="off">{'트리맵 시연'}</p>
<div className={cx("vj__ctrl")}>
<button className={cx("vj__pause")} data-role="pause" type="button" aria-pressed="false">{'일시정지'}</button>
<button className={cx("vj__step")} data-role="step" type="button">{'한 걸음'}</button>
</div>
<p className={cx("vj__done")} data-role="done" role="status" aria-live="polite"></p>
</div>
);
}08 A Morph That Compares the Same Data as Rectangles and Circles — Measured area 26.478% · moving frames 12/23Original by GODRICH · SCSS and React ship in the zip · Treemap Chart: 9 Canvas Layout Scenes
The post this demo lives in
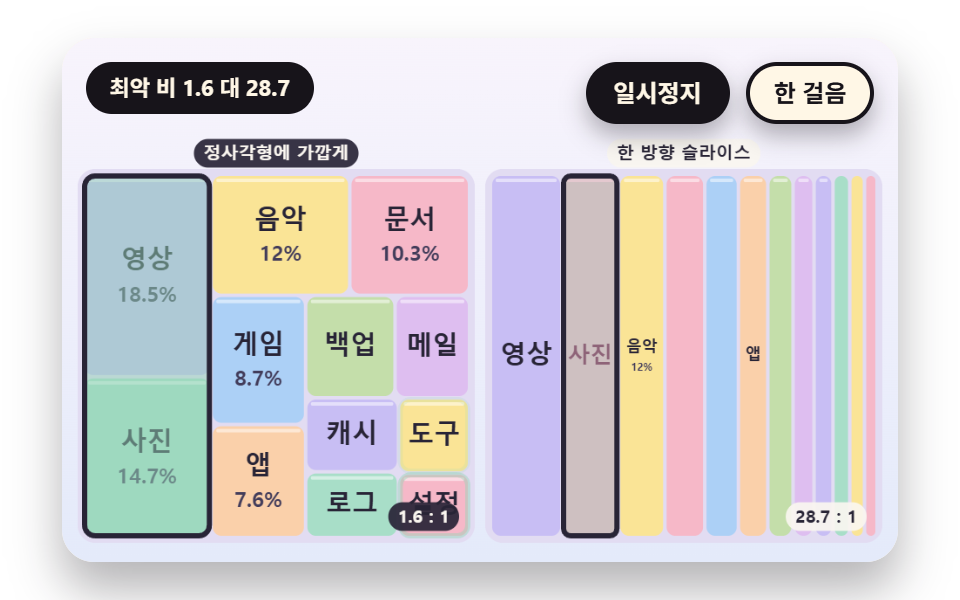 Treemap Chart: 9 Canvas Layout ScenesHow does a treemap chart split cells? 01 re-measures the worst ratio as each cell joins a row, 02 springs cells to new s See all demos in this post
If you like this effect - similar demos
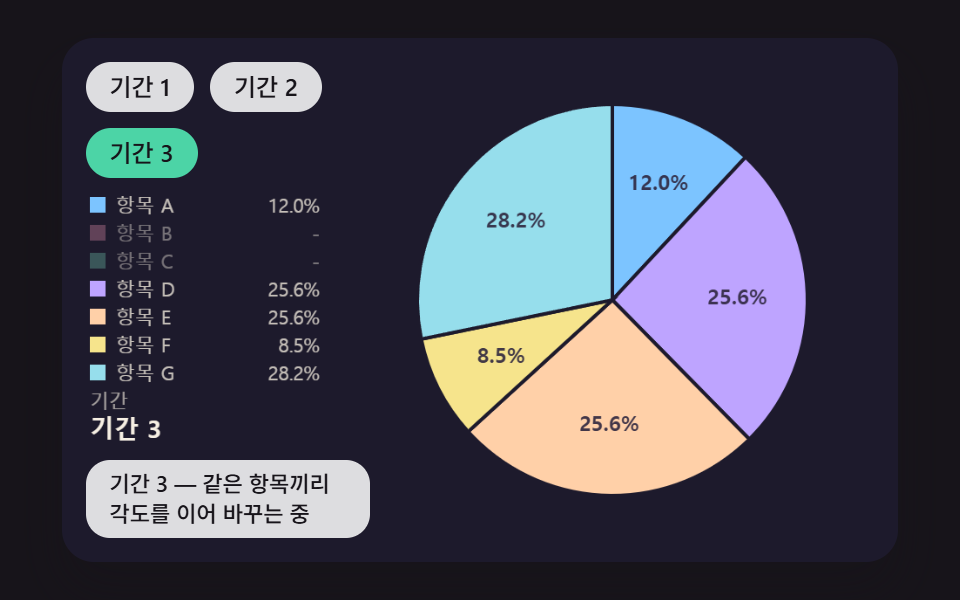 Dashboard UI04 A Pie Chart That Glides Its Slice Angles to New Shares When the Period ChangesPie Chart CSS: 9 Slices That Pop, Tilt and Morph
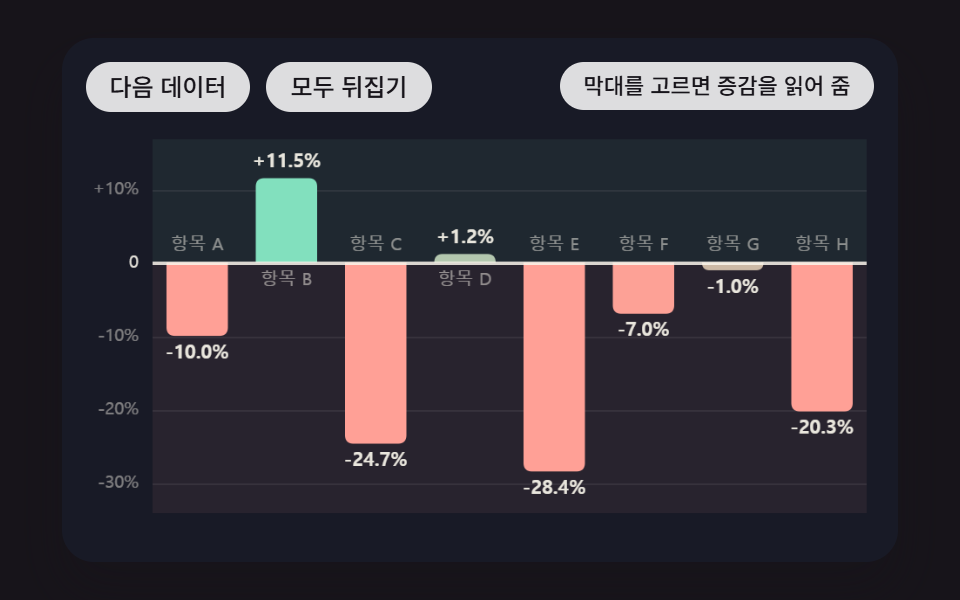 Dashboard UI09 Diverging Bars Split Up and Down From a Zero Line That Moves With the DataBar Chart Animation: 9 Demos From Spring to Race
 Dashboard UI06 Stacked and grouped show the same numbers twiceChart UI Design: 9 Interactions You Can Drag