02Waterfall Bridge Chart Connecting Each Rise and Fall
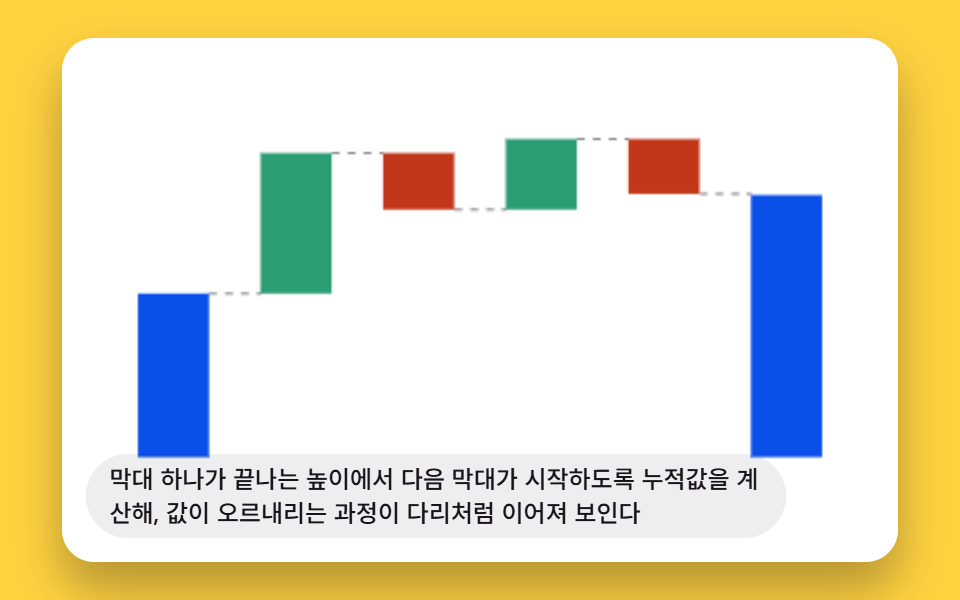
Each bar starts exactly where the previous one's running total ended, so the rises and falls read as a connected bridge.
Best forMonthly revenue bridge for a briefing slide
BAR_GROW_MSBAR_STAGGER_MSCOLOR_DOWN
<main class="stage">
<div class="wfb is-demo" id="wfbRoot">
  <canvas class="wfb__canvas" id="wfbCanvas" width="480" height="300"></canvas>
  <p class="wfb__caption">The cumulative value is calculated so each bar starts exactly where the previous one ended, making the rises and falls look bridged together.</p>
</div>
</main>
@use "../../../../site/static/demo-tokens" as *;
@include stage($stage-yellow);
.wfb {
position: relative;
width: min(92vw, calc(160vh - 12.8vw));
aspect-ratio: 480 / 300;
margin: 0 auto;
border-radius: $r-card;
overflow: hidden;
box-shadow: $shadow-raised;
background: $stage-paper;
}
.wfb__canvas {
display: block;
width: 100%;
height: 100%;
}
.wfb__caption {
position: absolute;
left: $sp-3;
bottom: $sp-3;
max-width: 78%;
margin: 0;
padding: $sp-1 $sp-3;
border-radius: $r-pill;
background: rgba(23, 20, 26, .07);
color: $subject-ink;
font-weight: 500;
font-size: 12px;
line-height: 1.4;
pointer-events: none;
}
@media (max-width: 340px) {
.wfb__caption { font-size: 10px; padding: $sp-1 $sp-2; }
}
@media (prefers-reduced-motion: reduce) {
.wfb { cursor: default; }
}html, body {
margin: 0;
overflow: hidden;
}
.stage {
box-sizing: border-box;
min-height: 100vh;
display: grid;
place-items: center;
margin: 0;
background: #ffd23f;
font-family: -apple-system, "Segoe UI", "Noto Sans KR", sans-serif;
padding: clamp(8px, 4vw, 24px);
}
.wfb {
position: relative;
width: min(92vw, 160vh - 12.8vw);
aspect-ratio: 480/300;
margin: 0 auto;
border-radius: 16px;
overflow: hidden;
box-shadow: 0 14px 24px rgba(23, 20, 26, 0.32);
background: #ffffff;
}
.wfb__canvas {
display: block;
width: 100%;
height: 100%;
}
.wfb__caption {
position: absolute;
left: 12px;
bottom: 12px;
max-width: 78%;
margin: 0;
padding: 4px 12px;
border-radius: 999px;
background: rgba(23, 20, 26, 0.07);
color: #17141a;
font-weight: 500;
font-size: 12px;
line-height: 1.4;
pointer-events: none;
}
@media (max-width: 340px) {
.wfb__caption {
font-size: 10px;
padding: 4px 8px;
}
}
@media (prefers-reduced-motion: reduce) {
.wfb {
cursor: default;
}
}(function () {
// 기법: 시작·종료 총합과 4개 증감값에서 누적값 배열을 계산해 막대 y 위치를 실제 값에 그대로
// 매핑하고(하드코딩 좌표 없음), 막대마다 순서대로 지연을 두어 이전 누적값에서 다음 누적값
// 쪽으로 높이가 자라도록 그린다. 다 자란 막대 사이는 점선으로 이어 다리처럼 보이게 한다.
var root = document.getElementById('wfbRoot');
var canvas = document.getElementById('wfbCanvas');
var ctx = canvas.getContext('2d');
var wrap = canvas.parentElement;
function seedRand(seed) {
var s = seed >>> 0;
return function () { s = (s * 1664525 + 1013904223) >>> 0; return s / 4294967296; };
}
var rand = seedRand(425021);
var deltas = [18 + rand() * 22, -(10 + rand() * 20), 14 + rand() * 26, -(8 + rand() * 18)];
var startVal = 40 + rand() * 10;
var running = [startVal];
for (var di = 0; di < deltas.length; di += 1) running.push(running[running.length - 1] + deltas[di]);
var endVal = running[running.length - 1];
var BAR_GROW_MS = 260;
var BAR_STAGGER_MS = 210;
function clamp(v, a, b) { return Math.max(a, Math.min(b, v)); }
function lerp(a, b, t) { return a + (b - a) * t; }
function easeOutCubic(x) { return 1 - Math.pow(1 - x, 3); }
// bars[0]·bars[5] 는 총합, bars[1..4] 는 증감. base/top 은 애니메이션이 자라나는 기준점(anchor)이다.
var bars = [
{ kind: 'total', value: startVal, anchor: 0, target: startVal },
{ kind: 'delta', value: deltas[0], anchor: running[0], target: running[1] },
{ kind: 'delta', value: deltas[1], anchor: running[1], target: running[2] },
{ kind: 'delta', value: deltas[2], anchor: running[2], target: running[3] },
{ kind: 'delta', value: deltas[3], anchor: running[3], target: running[4] },
{ kind: 'total', value: endVal, anchor: 0, target: endVal }
];
var COLOR_TOTAL = '#0a4fe8';
var COLOR_UP = '#2b9d74';
var COLOR_DOWN = '#c2361a';
var LOOP_MS = 2000;
var T0 = 200;
var cw = 480, ch = 300;
function draw(nowMs) {
var phase = reduce ? 1500 : (nowMs % LOOP_MS);
var t = Math.max(0, phase - T0);
ctx.clearRect(0, 0, cw, ch);
var fadeAlpha = 1;
if (phase > 1650) fadeAlpha = 1 - clamp((phase - 1650) / (1950 - 1650), 0, 1);
var maxVal = startVal;
var i;
for (i = 0; i < running.length; i += 1) maxVal = Math.max(maxVal, running[i]);
maxVal *= 1.12;
var marginX = cw * 0.06;
var chartTop = ch * 0.12;
var chartBottom = ch * 0.8;
var chartH = chartBottom - chartTop;
var scaleY = chartH / maxVal;
function yFor(v) { return chartBottom - v * scaleY; }
var n = bars.length;
var slotW = (cw - marginX * 2) / n;
var barW = slotW * 0.58;
ctx.globalAlpha = fadeAlpha;
// 다 자란 막대 사이 점선 연결선
ctx.setLineDash([4, 4]);
ctx.strokeStyle = 'rgba(23,20,26,.55)';
ctx.lineWidth = 1;
for (i = 0; i < n - 1; i += 1) {
var p1 = easeOutCubic(clamp((t - bars[i].delay) / BAR_GROW_MS, 0, 1));
if (p1 < 1) continue;
var x1 = marginX + slotW * i + (slotW - barW) / 2 + barW;
var x2 = marginX + slotW * (i + 1) + (slotW - barW) / 2;
var boundaryVal = i === 0 ? startVal : running[i];
var y = yFor(boundaryVal);
ctx.beginPath();
ctx.moveTo(x1, y);
ctx.lineTo(x2, y);
ctx.stroke();
}
ctx.setLineDash([]);
for (i = 0; i < n; i += 1) {
var b = bars[i];
var delay = i * BAR_STAGGER_MS;
var progress = easeOutCubic(clamp((t - delay) / BAR_GROW_MS, 0, 1));
var currentVal = lerp(b.anchor, b.target, progress);
var topVal = Math.max(b.anchor, currentVal);
var botVal = Math.min(b.anchor, currentVal);
var x = marginX + slotW * i + (slotW - barW) / 2;
var y1 = yFor(topVal);
var y2 = yFor(botVal);
var color = b.kind === 'total' ? COLOR_TOTAL : (b.value >= 0 ? COLOR_UP : COLOR_DOWN);
ctx.fillStyle = color;
ctx.fillRect(x, y1, barW, Math.max(1, y2 - y1));
}
ctx.globalAlpha = 1;
}
// 막대별 지연을 미리 붙여 둔다(연결선 계산에서도 재사용)
for (var bi = 0; bi < bars.length; bi += 1) bars[bi].delay = bi * BAR_STAGGER_MS;
function fit() {
var r = wrap.getBoundingClientRect();
cw = Math.max(1, Math.round(r.width));
ch = Math.max(1, Math.round(r.height));
canvas.width = cw; canvas.height = ch;
draw(elapsed);
}
var reduce = window.matchMedia('(prefers-reduced-motion: reduce)').matches;
var elapsed = 0;
if (reduce) root.classList.remove('is-demo');
var lastTs = null;
function tick(ts) {
if (lastTs === null) lastTs = ts;
var dt = Math.min(ts - lastTs, 48);
lastTs = ts;
if (!reduce) { elapsed += dt; draw(elapsed); }
requestAnimationFrame(tick);
}
fit();
window.addEventListener('resize', fit);
draw(elapsed);
requestAnimationFrame(tick);
})();import { useEffect, useRef } from "react";
import styles from "./ChartAdvancedWaterfallBridgeConnector.module.scss";
type Bar = { kind: "total" | "delta"; value: number; anchor: number; target: number; delay: number };
export default function ChartAdvancedWaterfallBridgeConnector() {
const rootRef = useRef<HTMLDivElement>(null);
const canvasRef = useRef<HTMLCanvasElement>(null);
useEffect(() => {
const root = rootRef.current;
const canvas = canvasRef.current;
if (!root || !canvas) return;
const ctx = canvas.getContext("2d");
if (!ctx) return;
const wrap = canvas.parentElement as HTMLElement;
function seedRand(seed: number) {
let s = seed >>> 0;
return function () { s = (s * 1664525 + 1013904223) >>> 0; return s / 4294967296; };
}
const rand = seedRand(425021);
const deltas = [18 + rand() * 22, -(10 + rand() * 20), 14 + rand() * 26, -(8 + rand() * 18)];
const startVal = 40 + rand() * 10;
const running = [startVal];
for (let di = 0; di < deltas.length; di += 1) running.push(running[running.length - 1] + deltas[di]);
const endVal = running[running.length - 1];
const BAR_GROW_MS = 260;
const BAR_STAGGER_MS = 210;
function clamp(v: number, a: number, b: number) { return Math.max(a, Math.min(b, v)); }
function lerp(a: number, b: number, t: number) { return a + (b - a) * t; }
function easeOutCubic(x: number) { return 1 - Math.pow(1 - x, 3); }
// bars[0]·bars[5] 는 총합, bars[1..4] 는 증감. anchor/target 은 애니메이션이 자라나는 기준점이다.
const bars: Bar[] = [
{ kind: "total", value: startVal, anchor: 0, target: startVal, delay: 0 },
{ kind: "delta", value: deltas[0], anchor: running[0], target: running[1], delay: BAR_STAGGER_MS },
{ kind: "delta", value: deltas[1], anchor: running[1], target: running[2], delay: BAR_STAGGER_MS * 2 },
{ kind: "delta", value: deltas[2], anchor: running[2], target: running[3], delay: BAR_STAGGER_MS * 3 },
{ kind: "delta", value: deltas[3], anchor: running[3], target: running[4], delay: BAR_STAGGER_MS * 4 },
{ kind: "total", value: endVal, anchor: 0, target: endVal, delay: BAR_STAGGER_MS * 5 }
];
const COLOR_TOTAL = "#0a4fe8";
const COLOR_UP = "#2b9d74";
const COLOR_DOWN = "#c2361a";
const LOOP_MS = 2000;
const T0 = 200;
let cw = 480, ch = 300;
function draw(nowMs: number) {
const phase = reduce ? 1500 : (nowMs % LOOP_MS);
const t = Math.max(0, phase - T0);
ctx!.clearRect(0, 0, cw, ch);
let fadeAlpha = 1;
if (phase > 1650) fadeAlpha = 1 - clamp((phase - 1650) / (1950 - 1650), 0, 1);
let maxVal = startVal;
let i;
for (i = 0; i < running.length; i += 1) maxVal = Math.max(maxVal, running[i]);
maxVal *= 1.12;
const marginX = cw * 0.06;
const chartTop = ch * 0.12;
const chartBottom = ch * 0.8;
const chartH = chartBottom - chartTop;
const scaleY = chartH / maxVal;
function yFor(v: number) { return chartBottom - v * scaleY; }
const n = bars.length;
const slotW = (cw - marginX * 2) / n;
const barW = slotW * 0.58;
ctx!.globalAlpha = fadeAlpha;
ctx!.setLineDash([4, 4]);
ctx!.strokeStyle = "rgba(23,20,26,.55)";
ctx!.lineWidth = 1;
for (i = 0; i < n - 1; i += 1) {
const p1 = easeOutCubic(clamp((t - bars[i].delay) / BAR_GROW_MS, 0, 1));
if (p1 < 1) continue;
const x1 = marginX + slotW * i + (slotW - barW) / 2 + barW;
const x2 = marginX + slotW * (i + 1) + (slotW - barW) / 2;
const boundaryVal = i === 0 ? startVal : running[i];
const y = yFor(boundaryVal);
ctx!.beginPath();
ctx!.moveTo(x1, y);
ctx!.lineTo(x2, y);
ctx!.stroke();
}
ctx!.setLineDash([]);
for (i = 0; i < n; i += 1) {
const b = bars[i];
const progress = easeOutCubic(clamp((t - b.delay) / BAR_GROW_MS, 0, 1));
const currentVal = lerp(b.anchor, b.target, progress);
const topVal = Math.max(b.anchor, currentVal);
const botVal = Math.min(b.anchor, currentVal);
const x = marginX + slotW * i + (slotW - barW) / 2;
const y1 = yFor(topVal);
const y2 = yFor(botVal);
const color = b.kind === "total" ? COLOR_TOTAL : (b.value >= 0 ? COLOR_UP : COLOR_DOWN);
ctx!.fillStyle = color;
ctx!.fillRect(x, y1, barW, Math.max(1, y2 - y1));
}
ctx!.globalAlpha = 1;
}
function fit() {
const r = wrap.getBoundingClientRect();
cw = Math.max(1, Math.round(r.width));
ch = Math.max(1, Math.round(r.height));
canvas!.width = cw; canvas!.height = ch;
draw(elapsed);
}
const reduce = window.matchMedia("(prefers-reduced-motion: reduce)").matches;
let elapsed = 0;
if (reduce) root.classList.remove("is-demo");
let lastTs: number | null = null;
let raf = 0;
function tick(ts: number) {
if (lastTs === null) lastTs = ts;
const dt = Math.min(ts - lastTs, 48);
lastTs = ts;
if (!reduce) { elapsed += dt; draw(elapsed); }
raf = requestAnimationFrame(tick);
}
fit();
window.addEventListener("resize", fit);
draw(elapsed);
raf = requestAnimationFrame(tick);
return () => {
cancelAnimationFrame(raf);
window.removeEventListener("resize", fit);
};
}, []);
return (
<main className={styles.stage}>
<div className={`${styles.wfb} is-demo`} ref={rootRef}>
<canvas className={styles.wfb__canvas} ref={canvasRef} width={480} height={300} />
<p className={styles.wfb__caption}>막대 하나가 끝나는 높이에서 다음 막대가 시작하도록 누적값을 계산해, 값이 오르내리는 과정이 다리처럼 이어져 보인다</p>
</div>
</main>
);
}02 Waterfall Bridge Chart Connecting Each Rise and Fall — Measured area 10.019% · moving frames 22/23Original by GODRICH · SCSS and React ship in the zip · 9 Data Visualization Chart Types With Real Math
The post this demo lives in
 9 Data Visualization Chart Types With Real MathA data visualization chart types set built from real math, not screenshots. Three of the nine flow like ribbons, three b See all demos in this post