09Candlestick Chart Drawing Open-High-Low-Close With Body and Wick
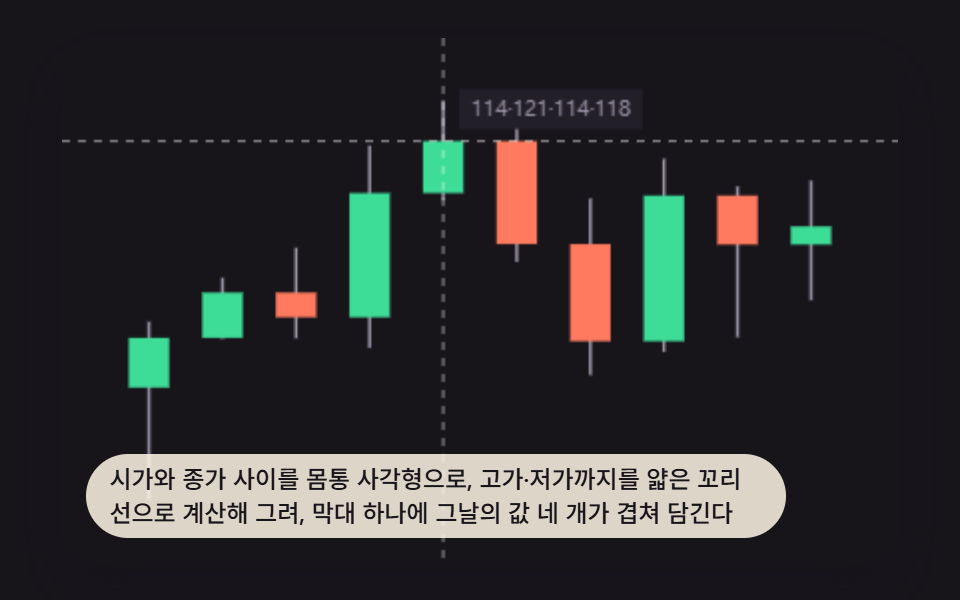
The gap between open and close is drawn as a solid body, while the reach up to the high and down to the low becomes a thin wick, packing four values into one bar.
Best forCoded stock or exchange-rate history panel
CANDLE_REVEAL_STAGGER_MSgrowPnearestCandle
<main class="stage">
<div class="cdl is-demo" id="cdlRoot">
  <canvas class="cdl__canvas" id="cdlCanvas" width="480" height="300"></canvas>
  <div class="cdl__kbd" id="cdlKbd" tabindex="0" aria-label="Browse candles"></div>
  <p class="cdl__caption">The range between the open and close is drawn as a rectangular body, and the reach to the high and low as a thin wick line, so one bar holds four values of the day layered together</p>
</div>
</main>
@use "../../../../site/static/demo-tokens" as *;
@include stage($stage-ink);
.cdl {
position: relative;
width: min(92vw, calc(160vh - 12.8vw));
aspect-ratio: 480 / 300;
margin: 0 auto;
border-radius: $r-card;
overflow: hidden;
box-shadow: $shadow-raised;
background: $stage-ink;
}
.cdl__canvas {
display: block;
width: 100%;
height: 100%;
}
.cdl__kbd {
position: absolute;
inset: 0;
background: transparent;
outline-offset: -2px;
pointer-events: none;
}
.cdl__kbd:focus-visible {
outline: 2px solid $subject-blue-light;
}
.cdl__caption {
position: absolute;
left: $sp-3;
bottom: $sp-3;
max-width: 78%;
margin: 0;
padding: $sp-1 $sp-3;
border-radius: $r-pill;
background: rgba(255, 247, 230, .85);
color: $subject-ink;
font-weight: 500;
font-size: 12px;
line-height: 1.4;
pointer-events: none;
}
@media (max-width: 340px) {
.cdl__caption { font-size: 10px; padding: $sp-1 $sp-2; }
}
@media (prefers-reduced-motion: reduce) {
.cdl { cursor: default; }
}html, body {
margin: 0;
overflow: hidden;
}
.stage {
box-sizing: border-box;
min-height: 100vh;
display: grid;
place-items: center;
margin: 0;
background: #17141a;
font-family: -apple-system, "Segoe UI", "Noto Sans KR", sans-serif;
padding: clamp(8px, 4vw, 24px);
}
.cdl {
position: relative;
width: min(92vw, 160vh - 12.8vw);
aspect-ratio: 480/300;
margin: 0 auto;
border-radius: 16px;
overflow: hidden;
box-shadow: 0 14px 24px rgba(23, 20, 26, 0.32);
background: #17141a;
}
.cdl__canvas {
display: block;
width: 100%;
height: 100%;
}
.cdl__kbd {
position: absolute;
inset: 0;
background: transparent;
outline-offset: -2px;
pointer-events: none;
}
.cdl__kbd:focus-visible {
outline: 2px solid #5b8cf8;
}
.cdl__caption {
position: absolute;
left: 12px;
bottom: 12px;
max-width: 78%;
margin: 0;
padding: 4px 12px;
border-radius: 999px;
background: rgba(255, 247, 230, 0.85);
color: #17141a;
font-weight: 500;
font-size: 12px;
line-height: 1.4;
pointer-events: none;
}
@media (max-width: 340px) {
.cdl__caption {
font-size: 10px;
padding: 4px 8px;
}
}
@media (prefers-reduced-motion: reduce) {
.cdl {
cursor: default;
}
}(function () {
// 기법: 시가·종가 사이를 몸통 사각형, 고가·저가 사이를 얇은 꼬리선으로 실제 값 좌표에 맞춰
// 계산해 그린다. 등장할 때는 값 위치는 고정한 채 중심에서부터 높이만 커지도록(진행도 스케일)
// 그려 부드럽게 나타나게 하고, 포인터·화살표 키로 특정 막대를 가리키면 크로스헤어와 함께
// 시가·고가·저가·종가 네 숫자를 칩에 표시한다.
var root = document.getElementById('cdlRoot');
var canvas = document.getElementById('cdlCanvas');
var kbdEl = document.getElementById('cdlKbd');
var ctx = canvas.getContext('2d');
var wrap = canvas.parentElement;
function seedRand(seed) {
var s = seed >>> 0;
return function () { s = (s * 1664525 + 1013904223) >>> 0; return s / 4294967296; };
}
var rand = seedRand(425091);
var CANDLE_COUNT = 10;
var candles = [];
var price = 100;
for (var i = 0; i < CANDLE_COUNT; i += 1) {
var open = price;
var vol = 4 + rand() * 10;
var close = open + (rand() - 0.5) * 2 * vol;
var high = Math.max(open, close) + rand() * vol * 0.6;
var low = Math.min(open, close) - rand() * vol * 0.6;
candles.push({ open: open, close: close, high: high, low: low });
price = close;
}
var scaleMin = Math.min.apply(null, candles.map(function (c) { return c.low; }));
var scaleMax = Math.max.apply(null, candles.map(function (c) { return c.high; }));
var CANDLE_REVEAL_STAGGER_MS = 110, CANDLE_REVEAL_DUR_MS = 160;
var hoverIndex = -1;
var lastUserInputAt = -9999;
var LOOP_MS = 2000;
var T0 = 200;
var ALL_DONE_MS = T0 + (CANDLE_COUNT - 1) * CANDLE_REVEAL_STAGGER_MS + CANDLE_REVEAL_DUR_MS;
var cw = 480, ch = 300;
function clamp(v, lo, hi) { return Math.max(lo, Math.min(hi, v)); }
function easeOutCubic(x) { return 1 - Math.pow(1 - x, 3); }
function candleX(idx) {
var padX = cw * 0.06;
var slot = (cw - padX * 2) / CANDLE_COUNT;
return padX + slot * (idx + 0.5);
}
function priceY(v) {
var padY = ch * 0.12;
return ch - padY - (ch - padY * 2) * (v - scaleMin) / (scaleMax - scaleMin);
}
function growP(idx, t) {
return clamp((t - T0 - idx * CANDLE_REVEAL_STAGGER_MS) / CANDLE_REVEAL_DUR_MS, 0, 1);
}
function nearestCandle(x) {
var best = 0, bestD = Infinity;
for (var k = 0; k < CANDLE_COUNT; k += 1) {
var d = Math.abs(candleX(k) - x);
if (d < bestD) { bestD = d; best = k; }
}
return best;
}
function render(elapsedMs) {
var t = elapsedMs % LOOP_MS;
ctx.clearRect(0, 0, cw, ch);
var padX = cw * 0.06;
var slot = (cw - padX * 2) / CANDLE_COUNT;
var bw = slot * 0.55;
for (var idx = 0; idx < CANDLE_COUNT; idx += 1) {
var c = candles[idx];
var grow = easeOutCubic(growP(idx, t));
var x = candleX(idx);
var wickTopFull = priceY(c.high), wickBotFull = priceY(c.low);
var wickCenter = (wickTopFull + wickBotFull) / 2;
var wickHalf = (wickBotFull - wickTopFull) / 2 * grow;
ctx.strokeStyle = '#9a93a6';
ctx.lineWidth = 1.5;
ctx.beginPath();
ctx.moveTo(x, wickCenter - wickHalf);
ctx.lineTo(x, wickCenter + wickHalf);
ctx.stroke();
var bodyTopFull = priceY(Math.max(c.open, c.close));
var bodyBotFull = priceY(Math.min(c.open, c.close));
var bodyCenter = (bodyTopFull + bodyBotFull) / 2;
var bodyHalf = Math.max(1, (bodyBotFull - bodyTopFull) / 2 * grow);
var up = c.close >= c.open;
ctx.fillStyle = up ? '#3ddc97' : '#ff7a5e';
ctx.fillRect(x - bw / 2, bodyCenter - bodyHalf, bw, bodyHalf * 2);
}
if (hoverIndex >= 0) {
var hc = candles[hoverIndex];
var hx = candleX(hoverIndex);
var hy = priceY(hc.close);
ctx.setLineDash([4, 4]);
ctx.strokeStyle = 'rgba(255,255,255,.55)';
ctx.lineWidth = 1;
ctx.beginPath(); ctx.moveTo(hx, 0); ctx.lineTo(hx, ch); ctx.stroke();
ctx.beginPath(); ctx.moveTo(0, hy); ctx.lineTo(cw, hy); ctx.stroke();
ctx.setLineDash([]);
var label = Math.round(hc.open) + '·' + Math.round(hc.high) + '·' + Math.round(hc.low) + '·' + Math.round(hc.close);
ctx.font = '11px sans-serif';
var padChip = 6;
var textW = ctx.measureText(label).width;
var chipW = textW + padChip * 2, chipH = 20;
var chipX = clamp(hx + 8, 4, cw - chipW - 4);
var chipY = Math.max(4, hy - chipH - 6);
ctx.fillStyle = '#231f28';
ctx.fillRect(chipX, chipY, chipW, chipH);
ctx.fillStyle = '#9a93a6';
ctx.textBaseline = 'middle';
ctx.fillText(label, chipX + padChip, chipY + chipH / 2);
}
}
function setHoverIndex(idx) {
hoverIndex = clamp(idx, -1, CANDLE_COUNT - 1);
render(elapsed);
}
canvas.addEventListener('pointermove', function (e) {
var rect = canvas.getBoundingClientRect();
var x = (e.clientX - rect.left) * (cw / rect.width);
lastUserInputAt = elapsed;
setHoverIndex(nearestCandle(x));
});
canvas.addEventListener('pointerleave', function () {
setHoverIndex(-1);
});
kbdEl.addEventListener('keydown', function (e) {
e.preventDefault();
if (e.key === 'ArrowLeft') {
lastUserInputAt = elapsed;
setHoverIndex(hoverIndex < 0 ? 0 : hoverIndex - 1);
} else if (e.key === 'ArrowRight') {
lastUserInputAt = elapsed;
setHoverIndex(hoverIndex < 0 ? 0 : hoverIndex + 1);
}
});
function autoDemoStep(elapsedMs) {
var t = elapsedMs % LOOP_MS;
if (elapsedMs - lastUserInputAt >= 800 && t >= ALL_DONE_MS) {
var span = Math.max(1, LOOP_MS - ALL_DONE_MS);
var frac = (t - ALL_DONE_MS) / span;
hoverIndex = Math.min(CANDLE_COUNT - 1, Math.floor(frac * CANDLE_COUNT));
}
render(elapsedMs);
}
function fit() {
var r = wrap.getBoundingClientRect();
cw = Math.max(1, Math.round(r.width));
ch = Math.max(1, Math.round(r.height));
canvas.width = cw; canvas.height = ch;
render(elapsed);
}
var reduce = window.matchMedia('(prefers-reduced-motion: reduce)').matches;
var elapsed = reduce ? ALL_DONE_MS + 50 : 0;
if (reduce) root.classList.remove('is-demo');
var lastTs = null;
function tick(ts) {
if (lastTs === null) lastTs = ts;
var dt = Math.min(ts - lastTs, 48);
lastTs = ts;
if (!reduce) {
elapsed += dt;
autoDemoStep(elapsed);
}
requestAnimationFrame(tick);
}
fit();
window.addEventListener('resize', fit);
render(elapsed);
requestAnimationFrame(tick);
})();import { useEffect, useRef } from "react";
import styles from "./ChartAdvancedCandlestickOhlcWick.module.scss";
type Candle = { open: number; close: number; high: number; low: number };
export default function ChartAdvancedCandlestickOhlcWick() {
const rootRef = useRef<HTMLDivElement>(null);
const canvasRef = useRef<HTMLCanvasElement>(null);
const kbdRef = useRef<HTMLDivElement>(null);
useEffect(() => {
const root = rootRef.current;
const canvas = canvasRef.current;
const kbdEl = kbdRef.current;
if (!root || !canvas || !kbdEl) return;
const ctx = canvas.getContext("2d");
if (!ctx) return;
const wrap = canvas.parentElement as HTMLElement;
function seedRand(seed: number) {
let s = seed >>> 0;
return function () { s = (s * 1664525 + 1013904223) >>> 0; return s / 4294967296; };
}
const rand = seedRand(425091);
const CANDLE_COUNT = 10;
const candles: Candle[] = [];
let price = 100;
for (let i = 0; i < CANDLE_COUNT; i += 1) {
const open = price;
const vol = 4 + rand() * 10;
const close = open + (rand() - 0.5) * 2 * vol;
const high = Math.max(open, close) + rand() * vol * 0.6;
const low = Math.min(open, close) - rand() * vol * 0.6;
candles.push({ open: open, close: close, high: high, low: low });
price = close;
}
const scaleMin = Math.min.apply(null, candles.map((c) => c.low));
const scaleMax = Math.max.apply(null, candles.map((c) => c.high));
const CANDLE_REVEAL_STAGGER_MS = 110, CANDLE_REVEAL_DUR_MS = 160;
let hoverIndex = -1;
let lastUserInputAt = -9999;
const LOOP_MS = 2000;
const T0 = 200;
const ALL_DONE_MS = T0 + (CANDLE_COUNT - 1) * CANDLE_REVEAL_STAGGER_MS + CANDLE_REVEAL_DUR_MS;
let cw = 480, ch = 300;
function clamp(v: number, lo: number, hi: number) { return Math.max(lo, Math.min(hi, v)); }
function easeOutCubic(x: number) { return 1 - Math.pow(1 - x, 3); }
function candleX(idx: number) {
const padX = cw * 0.06;
const slot = (cw - padX * 2) / CANDLE_COUNT;
return padX + slot * (idx + 0.5);
}
function priceY(v: number) {
const padY = ch * 0.12;
return ch - padY - (ch - padY * 2) * (v - scaleMin) / (scaleMax - scaleMin);
}
function growP(idx: number, t: number) {
return clamp((t - T0 - idx * CANDLE_REVEAL_STAGGER_MS) / CANDLE_REVEAL_DUR_MS, 0, 1);
}
function nearestCandle(x: number) {
let best = 0, bestD = Infinity;
for (let k = 0; k < CANDLE_COUNT; k += 1) {
const d = Math.abs(candleX(k) - x);
if (d < bestD) { bestD = d; best = k; }
}
return best;
}
function render(elapsedMs: number) {
const t = elapsedMs % LOOP_MS;
ctx!.clearRect(0, 0, cw, ch);
const padX = cw * 0.06;
const slot = (cw - padX * 2) / CANDLE_COUNT;
const bw = slot * 0.55;
for (let idx = 0; idx < CANDLE_COUNT; idx += 1) {
const c = candles[idx];
const grow = easeOutCubic(growP(idx, t));
const x = candleX(idx);
const wickTopFull = priceY(c.high), wickBotFull = priceY(c.low);
const wickCenter = (wickTopFull + wickBotFull) / 2;
const wickHalf = (wickBotFull - wickTopFull) / 2 * grow;
ctx!.strokeStyle = "#9a93a6";
ctx!.lineWidth = 1.5;
ctx!.beginPath();
ctx!.moveTo(x, wickCenter - wickHalf);
ctx!.lineTo(x, wickCenter + wickHalf);
ctx!.stroke();
const bodyTopFull = priceY(Math.max(c.open, c.close));
const bodyBotFull = priceY(Math.min(c.open, c.close));
const bodyCenter = (bodyTopFull + bodyBotFull) / 2;
const bodyHalf = Math.max(1, (bodyBotFull - bodyTopFull) / 2 * grow);
const up = c.close >= c.open;
ctx!.fillStyle = up ? "#3ddc97" : "#ff7a5e";
ctx!.fillRect(x - bw / 2, bodyCenter - bodyHalf, bw, bodyHalf * 2);
}
if (hoverIndex >= 0) {
const hc = candles[hoverIndex];
const hx = candleX(hoverIndex);
const hy = priceY(hc.close);
ctx!.setLineDash([4, 4]);
ctx!.strokeStyle = "rgba(255,255,255,.55)";
ctx!.lineWidth = 1;
ctx!.beginPath(); ctx!.moveTo(hx, 0); ctx!.lineTo(hx, ch); ctx!.stroke();
ctx!.beginPath(); ctx!.moveTo(0, hy); ctx!.lineTo(cw, hy); ctx!.stroke();
ctx!.setLineDash([]);
const label = Math.round(hc.open) + "·" + Math.round(hc.high) + "·" + Math.round(hc.low) + "·" + Math.round(hc.close);
ctx!.font = "11px sans-serif";
const padChip = 6;
const textW = ctx!.measureText(label).width;
const chipW = textW + padChip * 2, chipH = 20;
const chipX = clamp(hx + 8, 4, cw - chipW - 4);
const chipY = Math.max(4, hy - chipH - 6);
ctx!.fillStyle = "#231f28";
ctx!.fillRect(chipX, chipY, chipW, chipH);
ctx!.fillStyle = "#9a93a6";
ctx!.textBaseline = "middle";
ctx!.fillText(label, chipX + padChip, chipY + chipH / 2);
}
}
function setHoverIndex(idx: number) {
hoverIndex = clamp(idx, -1, CANDLE_COUNT - 1);
render(elapsed);
}
function onPointerMove(e: PointerEvent) {
const rect = canvas!.getBoundingClientRect();
const x = (e.clientX - rect.left) * (cw / rect.width);
lastUserInputAt = elapsed;
setHoverIndex(nearestCandle(x));
}
function onPointerLeave() { setHoverIndex(-1); }
function onKeyDown(e: KeyboardEvent) {
e.preventDefault();
if (e.key === "ArrowLeft") {
lastUserInputAt = elapsed;
setHoverIndex(hoverIndex < 0 ? 0 : hoverIndex - 1);
} else if (e.key === "ArrowRight") {
lastUserInputAt = elapsed;
setHoverIndex(hoverIndex < 0 ? 0 : hoverIndex + 1);
}
}
canvas.addEventListener("pointermove", onPointerMove);
canvas.addEventListener("pointerleave", onPointerLeave);
kbdEl.addEventListener("keydown", onKeyDown);
function autoDemoStep(elapsedMs: number) {
const t = elapsedMs % LOOP_MS;
if (elapsedMs - lastUserInputAt >= 800 && t >= ALL_DONE_MS) {
const span = Math.max(1, LOOP_MS - ALL_DONE_MS);
const frac = (t - ALL_DONE_MS) / span;
hoverIndex = Math.min(CANDLE_COUNT - 1, Math.floor(frac * CANDLE_COUNT));
}
render(elapsedMs);
}
function fit() {
const r = wrap.getBoundingClientRect();
cw = Math.max(1, Math.round(r.width));
ch = Math.max(1, Math.round(r.height));
canvas!.width = cw; canvas!.height = ch;
render(elapsed);
}
const reduce = window.matchMedia("(prefers-reduced-motion: reduce)").matches;
let elapsed = reduce ? ALL_DONE_MS + 50 : 0;
if (reduce) root.classList.remove("is-demo");
let lastTs: number | null = null;
let raf = 0;
function tick(ts: number) {
if (lastTs === null) lastTs = ts;
const dt = Math.min(ts - lastTs, 48);
lastTs = ts;
if (!reduce) {
elapsed += dt;
autoDemoStep(elapsed);
}
raf = requestAnimationFrame(tick);
}
fit();
window.addEventListener("resize", fit);
render(elapsed);
raf = requestAnimationFrame(tick);
return () => {
cancelAnimationFrame(raf);
window.removeEventListener("resize", fit);
canvas.removeEventListener("pointermove", onPointerMove);
canvas.removeEventListener("pointerleave", onPointerLeave);
kbdEl.removeEventListener("keydown", onKeyDown);
};
}, []);
return (
<main className={styles.stage}>
<div className={`${styles.cdl} is-demo`} ref={rootRef}>
<canvas className={styles.cdl__canvas} ref={canvasRef} width={480} height={300} />
<div className={styles.cdl__kbd} ref={kbdRef} tabIndex={0} aria-label="캔들 탐색" />
<p className={styles.cdl__caption}>시가와 종가 사이를 몸통 사각형으로, 고가·저가까지를 얇은 꼬리선으로 계산해 그려, 막대 하나에 그날의 값 네 개가 겹쳐 담긴다</p>
</div>
</main>
);
}09 Candlestick Chart Drawing Open-High-Low-Close With Body and Wick — Measured area 13.603% · moving frames 23/23Original by GODRICH · SCSS and React ship in the zip · 9 Data Visualization Chart Types With Real Math
The post this demo lives in
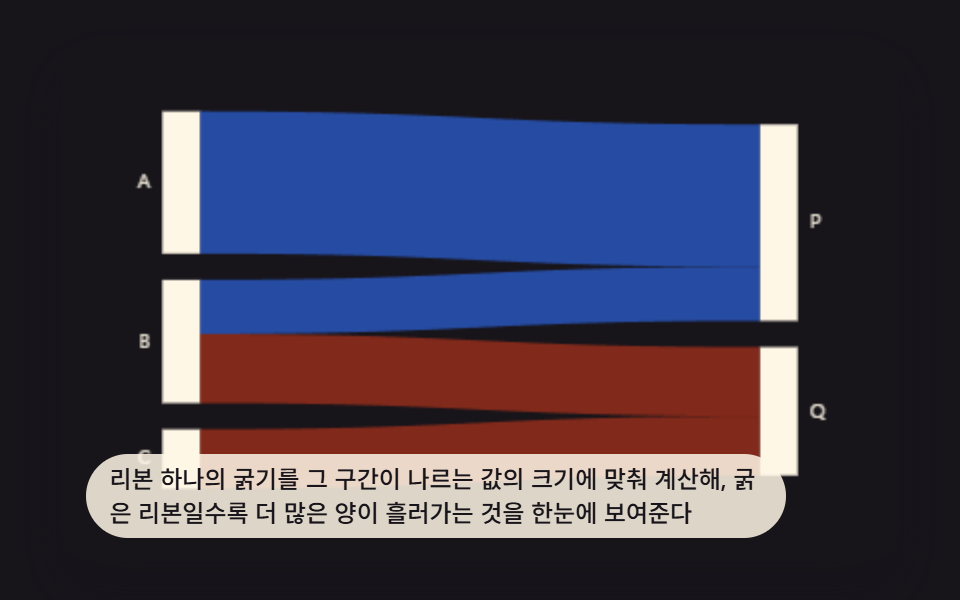 9 Data Visualization Chart Types With Real MathA data visualization chart types set built from real math, not screenshots. Three of the nine flow like ribbons, three b See all demos in this post
If you like this effect - similar demos
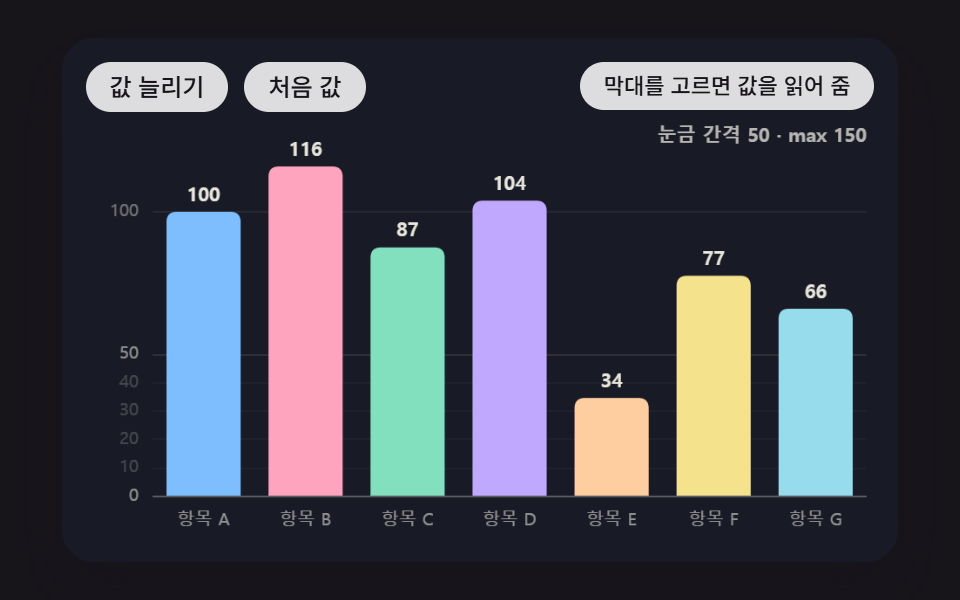 Dashboard UI05 An Axis That Re-Picks 1-2-5 Ticks and Shrinks Along With the BarsBar Chart Animation: 9 Demos From Spring to Race
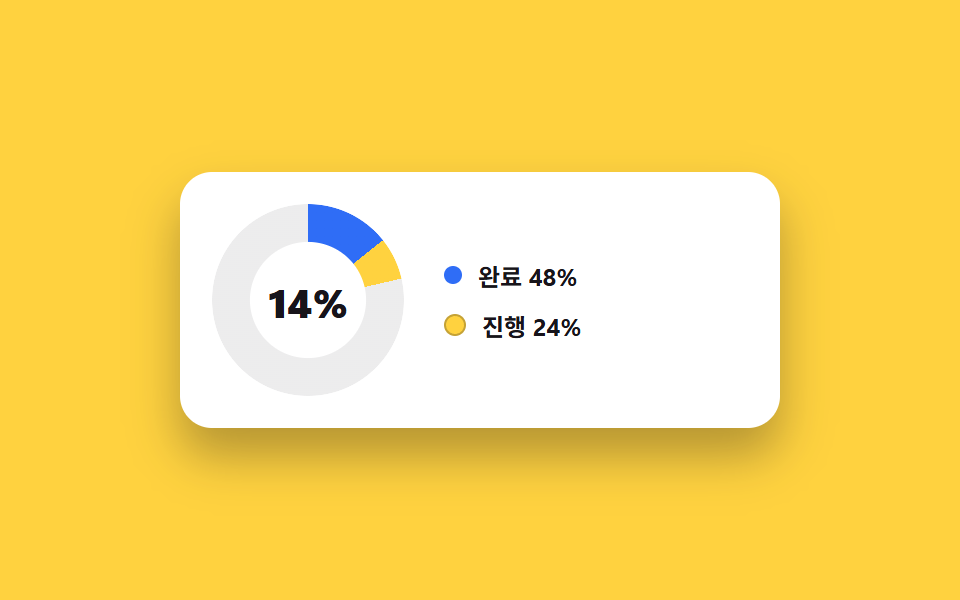 Dashboard UI04 Donut chart card with center counterDashboard Sidebar Design + 9 Widget UI Pieces
 Dashboard UI03 Drag a range and the summary recountsChart UI Design: 9 Interactions You Can Drag