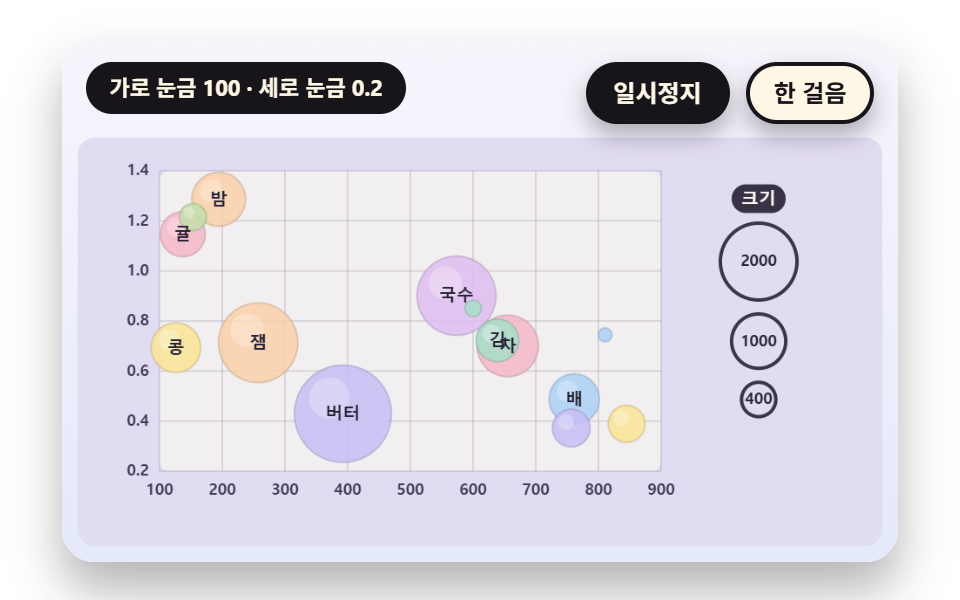
03Ticks for the Three Values of X, Y and Size
From the data min and max, the tick step is picked from 1, 2 or 5 times a power of ten and the axis ends are stretched to round numbers. The size value has no axis, so a legend of three sample circles stands in, and swapping the data moves ticks and circles together.
Best forCalculation that fits the axes and legend of a chart carrying three variables on one sheet
niceStepTICK_TARGETlegendSizes
<main class="stage">
<div class="vj is-demo" id="vj">
  <div class="vj__pad" data-role="pad" tabindex="0" role="application" aria-label="Bubble chart stage: arrow keys move between bubbles, Enter picks, P pauses, N steps once, R restarts">
    <canvas class="vj__canvas" data-role="canvas" width="480" height="300" role="img" aria-label="Fourteen bubbles are placed on horizontal and vertical ticks, and the size is read from three sample circles in the legend on the right. Each time the data changes three times, the tick step is picked again from 1, 2 or 5 times a power of ten so the axis ends stretch to round numbers, and bubbles and ticks move to their new places together while the legend values change too"></canvas>
  </div>
  <p class="vj__status" data-role="status" aria-live="off">Bubble chart demo</p>
  <div class="vj__ctrl">
    <button class="vj__pause" data-role="pause" type="button" aria-pressed="false">Pause</button>
    <button class="vj__step" data-role="step" type="button">Step</button>
  </div>
  <p class="vj__done" data-role="done" role="status" aria-live="polite"></p>
</div>
</main>
@use "../../../../site/static/demo-tokens" as *;
@include stage($stage-paper);
.vj {
position: relative;
width: min(92vw, calc(160vh - 12.8vw));
aspect-ratio: 480 / 300;
margin: 0 auto;
border-radius: $r-card;
overflow: hidden;
box-shadow: $shadow-raised;
background: $subject-cream;
}
// 무대 상자 — 여기서 시작한 터치만 칸 누르기로 읽는다(touch-action: none 은 이 상자에만). 무대 밖 터치는 페이지 스크롤 그대로
.vj__pad {
position: absolute;
inset: 0;
border-radius: inherit;
outline: none;
touch-action: none;
cursor: pointer;
}
// 바깥 .vj 가 넘침을 자르므로 포커스 테두리는 안쪽으로 들인다
.vj__pad:focus-visible {
outline: 3px solid $subject-ink;
outline-offset: -3px;
}
.vj__canvas {
position: absolute;
inset: 0;
display: block;
width: 100%;
height: 100%;
}
.vj__ctrl {
position: absolute;
right: $sp-3;
top: $sp-3;
display: flex;
gap: $sp-2;
}
.vj__pause,
.vj__step {
padding: $sp-1 $sp-3;
border: 2px solid $subject-ink;
border-radius: $r-pill;
background: $subject-ink;
color: $subject-cream;
font-family: inherit;
font-weight: 700;
font-size: 12px;
line-height: 1.6;
cursor: pointer;
box-shadow: $shadow-press;
transition: transform $dur-quick $ease-spring;
}
.vj__step {
background: $subject-cream;
color: $subject-ink;
}
// 스크린리더에만 읽히는 완료 알림
.vj__done {
position: absolute;
width: 1px;
height: 1px;
margin: 0;
overflow: hidden;
clip-path: inset(50%);
white-space: nowrap;
}
// 눌린 상태(멈춤) — 바탕과 글자색을 뒤집어 aria-pressed 가 눈에도 보이게
.vj__pause[aria-pressed="true"] {
background: $subject-cream;
color: $subject-ink;
}
.vj__pause:hover,
.vj__step:hover {
transform: translateY(-2px);
}
.vj__pause:active,
.vj__step:active {
transform: translateY(1px);
}
.vj__pause:focus-visible,
.vj__step:focus-visible {
outline: 3px solid $subject-ink;
outline-offset: 3px;
}
// 상태 줄 — 지금 장면의 수치를 글자로. 시연 중에는 aria-live off, 사람이 처음 손대면 polite
.vj__status {
position: absolute;
left: $sp-3;
top: $sp-3;
max-width: calc(100% - 190px);
margin: 0;
padding: $sp-1 $sp-3;
border-radius: $r-pill;
background: $subject-ink;
color: $subject-cream;
font-weight: 700;
font-size: 11px;
line-height: 1.6;
white-space: nowrap;
overflow: hidden;
text-overflow: ellipsis;
pointer-events: none;
}
@media (max-width: 340px) {
.vj__pause,
.vj__step,
.vj__status { font-size: 10px; padding: 0 $sp-2; }
}
// 움직임 줄이기 — 장면은 스크립트가 정지 장면 한 장으로 멈춘다. 버튼도 떠오르지 않게
@media (prefers-reduced-motion: reduce) {
.vj__pause,
.vj__step { transition: none !important; }
.vj__pause:hover,
.vj__pause:active,
.vj__step:hover,
.vj__step:active { transform: none !important; }
}html, body {
margin: 0;
overflow: hidden;
}
.stage {
box-sizing: border-box;
min-height: 100vh;
display: grid;
place-items: center;
margin: 0;
background: #ffffff;
font-family: -apple-system, "Segoe UI", "Noto Sans KR", sans-serif;
padding: clamp(8px, 4vw, 24px);
}
.vj {
position: relative;
width: min(92vw, 160vh - 12.8vw);
aspect-ratio: 480/300;
margin: 0 auto;
border-radius: 16px;
overflow: hidden;
box-shadow: 0 14px 24px rgba(23, 20, 26, 0.32);
background: #fff7e6;
}
.vj__pad {
position: absolute;
inset: 0;
border-radius: inherit;
outline: none;
touch-action: none;
cursor: pointer;
}
.vj__pad:focus-visible {
outline: 3px solid #17141a;
outline-offset: -3px;
}
.vj__canvas {
position: absolute;
inset: 0;
display: block;
width: 100%;
height: 100%;
}
.vj__ctrl {
position: absolute;
right: 12px;
top: 12px;
display: flex;
gap: 8px;
}
.vj__pause,
.vj__step {
padding: 4px 12px;
border: 2px solid #17141a;
border-radius: 999px;
background: #17141a;
color: #fff7e6;
font-family: inherit;
font-weight: 700;
font-size: 12px;
line-height: 1.6;
cursor: pointer;
box-shadow: 0 6px 12px rgba(23, 20, 26, 0.32);
transition: transform 220ms cubic-bezier(0.2, 0.8, 0.2, 1);
}
.vj__step {
background: #fff7e6;
color: #17141a;
}
.vj__done {
position: absolute;
width: 1px;
height: 1px;
margin: 0;
overflow: hidden;
clip-path: inset(50%);
white-space: nowrap;
}
.vj__pause[aria-pressed=true] {
background: #fff7e6;
color: #17141a;
}
.vj__pause:hover,
.vj__step:hover {
transform: translateY(-2px);
}
.vj__pause:active,
.vj__step:active {
transform: translateY(1px);
}
.vj__pause:focus-visible,
.vj__step:focus-visible {
outline: 3px solid #17141a;
outline-offset: 3px;
}
.vj__status {
position: absolute;
left: 12px;
top: 12px;
max-width: calc(100% - 190px);
margin: 0;
padding: 4px 12px;
border-radius: 999px;
background: #17141a;
color: #fff7e6;
font-weight: 700;
font-size: 11px;
line-height: 1.6;
white-space: nowrap;
overflow: hidden;
text-overflow: ellipsis;
pointer-events: none;
}
@media (max-width: 340px) {
.vj__pause,
.vj__step,
.vj__status {
font-size: 10px;
padding: 0 8px;
}
}
@media (prefers-reduced-motion: reduce) {
.vj__pause,
.vj__step {
transition: none !important;
}
.vj__pause:hover,
.vj__pause:active,
.vj__step:hover,
.vj__step:active {
transform: none !important;
}
}(function () {
const root = document.getElementById("vj");
if (!root) return;
// 무대 좌표 — 캔버스 안 계산은 늘 480×300. 화면에 보이는 크기와 상관없다
const W = 480;
const H = 300;
const TAU = Math.PI * 2;
function clamp(v, lo, hi) { return v < lo ? lo : (v > hi ? hi : v); }
function lerp(a, b, k) { return a + (b - a) * k; }
function ease(x) { const c = clamp(x, 0, 1); return c * c * (3 - 2 * c); }
// 끝에서 한 번 넘쳤다 돌아오는 곡선 — 거품이 자리에 튀어 나올 때
function backOut(x) {
const c = clamp(x, 0, 1) - 1;
return 1 + 2.70158 * c * c * c + 1.70158 * c * c;
}
// 시드 고정 난수 — 선형 합동 생성기(곱 1664525, 더함 1013904223). 같은 시드면 같은 수열
function seeded(seed) {
let s = (seed >>> 0) || 1;
return function () {
s = (Math.imul(s, 1664525) + 1013904223) >>> 0;
return s / 4294967296;
};
}
// 파스텔 팔레트 — 거품은 연한 면, 글자는 늘 진한 잉크
const BG_TOP = [248, 244, 252];
const BG_BOT = [228, 234, 250];
const BED = [226, 220, 242];
const INK = [40, 36, 54];
const INK2 = [66, 60, 90];
const PAPER = [250, 246, 240];
const ROSE = [244, 162, 186];
const MINT = [148, 212, 182];
const TILES = [
[200, 190, 244], [168, 222, 200], [250, 228, 150], [246, 184, 200],
[172, 208, 246], [250, 208, 170], [196, 222, 170], [222, 190, 240],
];
function mix(a, b, k) { return [lerp(a[0], b[0], k), lerp(a[1], b[1], k), lerp(a[2], b[2], k)]; }
function rgba(c, a) {
return 'rgba(' + Math.round(clamp(c[0], 0, 255)) + ',' + Math.round(clamp(c[1], 0, 255)) + ',' + Math.round(clamp(c[2], 0, 255)) + ',' + clamp(a, 0, 1).toFixed(3) + ')';
}
// 장면 시계(초)·판 반복 번호·시간표 — 시간표는 (시각, 할 일) 목록이고 시각이 지나면 한 번씩 부른다
let sceneT = 0;
let lap = 0;
let script = [];
let evAt = 0;
// 겹침 한 번 풀기 — 두 원의 중심 거리 d 가 반지름 합에 gap 을 더한 값보다 작으면 모자란 만큼(o)을 두 원의 Size 비율로 나눠 서로 밀어낸다(작은 원이 더 많이 움직인다)
function relaxPass(bs, gap) {
for (let i = 0; i < bs.length; i += 1) {
for (let j = i + 1; j < bs.length; j += 1) {
const a = bs[i];
const b = bs[j];
let dx = b.x - a.x;
let dy = b.y - a.y;
let d = Math.sqrt(dx * dx + dy * dy);
const need = a.r + b.r + gap;
if (d >= need) {
continue;
}
if (d < 1e-6) {
dx = Math.cos(i * 2.399 + j * 1.131);
dy = Math.sin(i * 2.399 + j * 1.131);
d = 1;
}
const o = need - d;
const ux = dx / d;
const uy = dy / d;
const sa = b.r / (a.r + b.r);
const sb = a.r / (a.r + b.r);
a.x -= ux * o * sa;
a.y -= uy * o * sa;
b.x += ux * o * sb;
b.y += uy * o * sb;
}
}
}
// 판 안에 가두기 — 원 전체가 사각형 안에 있게 중심을 자른다
function keepIn(bs, R) {
for (const b of bs) {
b.x = clamp(b.x, R.x + b.r, R.x + R.w - b.r);
b.y = clamp(b.y, R.y + b.r, R.y + R.h - b.r);
}
}
// 겹침 합 — 모든 원 쌍에서 (반지름 합 - 중심 거리) 가 양수인 만큼을 더한 값. 0 이면 겹침이 없다
function overlapOf(bs) {
let s = 0;
for (let i = 0; i < bs.length; i += 1) {
for (let j = i + 1; j < bs.length; j += 1) {
const d = Math.hypot(bs[j].x - bs[i].x, bs[j].y - bs[i].y);
const o = bs[i].r + bs[j].r - d;
if (o > 0) {
s += o;
}
}
}
return s;
}
// 반복해서 풀기 — passes 번 겹침을 밀고, 매번 판 중심으로 pull 만큼 끌어당긴 뒤 판 안으로 자른다. 끝난 뒤 남은 겹침 합을 돌려준다
function relax(bs, R, passes, gap, pull) {
const cx = R.x + R.w / 2;
const cy = R.y + R.h / 2;
for (let p = 0; p < passes; p += 1) {
relaxPass(bs, gap);
if (pull > 0) {
for (const b of bs) {
b.x += (cx - b.x) * pull;
b.y += (cy - b.y) * pull;
}
}
keepIn(bs, R);
}
return overlapOf(bs);
}
function sumOf(vals) { let s = 0; for (const v of vals) {
s += v;
} return s; }
function r1(v) { return String(Math.round(v * 10) / 10); }
// ── 자체 가상 데이터 ──────────────────────────────────────
const NAMES = [
'Butter', 'Cookie', 'Milk', 'Tea', 'Honey', 'Jam', 'Bread', 'Noodle', 'Rice', 'Nori', 'Bean', 'Citrus',
'Pear', 'Chestnut', 'Sesame', 'Adzuki', 'Grain', 'Salt', 'Vinegar', 'Tofu', 'Kelp', 'Squash', 'Persimmon', 'Mugwort',
];
// ── 글자 폭 어림 ──────────────────────────────────────────
// 한글·한자·가나는 글자 크기만큼, 로마자는 0.56 배로 어림한다 — 실제 폭을 재지 않고 문자 수에서 곧바로 구한다
function glyphW(s, px) {
let w = 0;
for (let i = 0; i < s.length; i += 1) {
w += (s.charCodeAt(i) >= 0x2e80 ? 1 : 0.56) * px;
}
return w;
}
// 문구 틀의 {a}·{b} 자리에 값을 끼운다 — 화면 문구는 늘 이 틀 한 줄로 두고 로케일 사전이 통째로 바꾼다
function fill(s, a, b) { return s.replace('{a}', a).replace('{b}', b === undefined ? '' : b); }
const canvasEl = root.querySelector('[data-role="canvas"]');
const padEl = root.querySelector('[data-role="pad"]');
const pauseEl = root.querySelector('[data-role="pause"]');
const statusEl = root.querySelector('[data-role="status"]');
const stepEl = root.querySelector('[data-role="step"]');
const doneEl = root.querySelector('[data-role="done"]');
const ctxRaw = canvasEl ? canvasEl.getContext('2d') : null;
if (!canvasEl || !ctxRaw || !pauseEl || !padEl || !stepEl || !doneEl) {
return;
}
const cv = canvasEl;
const ctx = ctxRaw;
const pauseBtn = pauseEl;
const stepBtn = stepEl;
const doneP = doneEl;
const pad = padEl;
// 외부 웹폰트는 부르지 않는다 — 기기에 있는 글꼴 목록만
const FONT_STACK = 'system-ui, -apple-system, "Segoe UI", "Noto Sans KR", sans-serif';
let dpr = 1;
function fitCanvas() {
// 배율은 2 에서 자른다 — 배율 3 기기에서 화소가 2.25배로 늘지 않게
dpr = Math.min(window.devicePixelRatio || 1, 2);
cv.width = Math.round(W * dpr);
cv.height = Math.round(H * dpr);
ctx.setTransform(dpr, 0, 0, dpr, 0, 0);
}
function skyFill(top, bot) {
const g = ctx.createLinearGradient(0, 0, 0, H);
g.addColorStop(0, rgba(top, 1));
g.addColorStop(1, rgba(bot, 1));
ctx.fillStyle = g;
ctx.fillRect(0, 0, W, H);
}
function disc(x, y, r, c, a) {
if (r <= 0.2 || a <= 0) {
return;
}
ctx.beginPath();
ctx.arc(x, y, r, 0, TAU);
ctx.fillStyle = rgba(c, a);
ctx.fill();
}
function box(x, y, w, h, r, c, a) {
if (w <= 0.2 || h <= 0.2 || a <= 0) {
return;
}
ctx.beginPath();
ctx.roundRect(x, y, w, h, Math.max(0, Math.min(r, w / 2, h / 2)));
ctx.fillStyle = rgba(c, a);
ctx.fill();
}
function outline(x, y, w, h, r, width, c, a) {
if (w <= 0.2 || h <= 0.2 || a <= 0) {
return;
}
ctx.beginPath();
ctx.roundRect(x, y, w, h, Math.max(0, Math.min(r, w / 2, h / 2)));
ctx.lineWidth = width;
ctx.strokeStyle = rgba(c, a);
ctx.stroke();
}
function text(s, x, y, c, a, px, weight, align) {
ctx.font = weight + ' ' + px + 'px ' + FONT_STACK;
ctx.textAlign = align;
ctx.textBaseline = 'middle';
ctx.fillStyle = rgba(c, a);
ctx.fillText(s, x, y);
}
// 글자 이름표 — 바탕 알약 위에 글자
function tag(s, x, y, bg, fg, px, align) {
ctx.font = '700 ' + px + 'px ' + FONT_STACK;
const w = ctx.measureText(s).width + px * 1.1;
const left = align === 'center' ? x - w / 2 : (align === 'right' ? x - w : x);
box(left, y - px * 0.82, w, px * 1.64, px * 0.82, bg, 0.92);
text(s, left + w / 2, y + 0.5, fg, 1, px, 700, 'center');
}
// 판 자리 — 왼쪽 판·오른쪽 판(대비판)·한 판짜리 히어로. 위쪽은 상태 줄·버튼 자리
const PANEL_L = { x: 12, y: 78, w: 222, h: 208 };
const PANEL_R = { x: 246, y: 78, w: 222, h: 208 };
const PANEL_ONE = { x: 12, y: 60, w: 456, h: 228 };
// 판 바닥 — 칸 사이 틈으로 비치는 연보라
function bed(R) {
box(R.x - 3, R.y - 3, R.w + 6, R.h + 6, 10, BED, 1);
}
function panelTags(a, b) {
tag(a, PANEL_L.x + PANEL_L.w / 2, 66, INK, PAPER, 10, 'center');
tag(b, PANEL_R.x + PANEL_R.w / 2, 66, PAPER, INK, 10, 'center');
}
// 거품 한 개 — 면, 왼쪽 위 하이라이트, 옅은 윤곽
function orb(x, y, r, c, a) {
if (r <= 0.3 || a <= 0) {
return;
}
disc(x, y, r, c, a);
if (r > 5) {
disc(x - r * 0.28, y - r * 0.32, r * 0.42, [255, 255, 255], 0.3 * a);
}
ctx.beginPath();
ctx.arc(x, y, r, 0, TAU);
ctx.lineWidth = 1;
ctx.strokeStyle = rgba(mix(c, INK, 0.28), 0.55 * a);
ctx.stroke();
}
function line(x0, y0, x1, y1, width, c, a) {
if (a <= 0) {
return;
}
ctx.beginPath();
ctx.moveTo(x0, y0);
ctx.lineTo(x1, y1);
ctx.lineWidth = width;
ctx.strokeStyle = rgba(c, a);
ctx.stroke();
}
function ring(x, y, r, width, c, a) {
if (r <= 0.3 || a <= 0) {
return;
}
ctx.beginPath();
ctx.arc(x, y, r, 0, TAU);
ctx.lineWidth = width;
ctx.strokeStyle = rgba(c, a);
ctx.stroke();
}
function ballHit(b, label) {
return { x: b.x - b.r, y: b.y - b.r, w: b.r * 2, h: b.r * 2, label: label };
}
let shownStatus = '';
function pushStatus(s) {
if (!statusEl || s === shownStatus) {
return;
}
shownStatus = s;
statusEl.textContent = s;
}
let paused = false;
const reduceQuery = window.matchMedia('(prefers-reduced-motion: reduce)');
// 페이지를 연 채 움직임 줄이기 설정을 바꿔도 change 리스너가 다시 읽는다
let still = reduceQuery.matches;
// 자동 시연 표시 — 사람이 처음 손대면 떼고 상태 줄을 polite 로 켠다
let demo = root.classList.contains('is-demo');
const off = new AbortController();
// 사람이 직접 하는 중이면 시간표는 멈추고 애니메이션만 흐른다
let manual = false;
// curOn 이면 키보드 칸 고르기가 켜진 것 — ki 가 hits() 안 번호
let curOn = false;
let ki = 0;
function wake() {
if (!demo) {
return;
}
demo = false;
root.classList.remove('is-demo');
if (statusEl) {
statusEl.setAttribute('aria-live', 'polite');
}
}
function takeOver() {
if (manual) {
return;
}
manual = true;
onTake();
wake();
if (!curOn) {
curOn = true;
ki = 0;
}
}
// 한 판 시연이 끝났음을 스크린리더에 한 번만 알린다 — 판이 되풀이돼도 다시 읽지 않는다
let doneSaid = false;
function checkDone() {
if (!manual && !doneSaid && sceneT >= LAP_S - 0.6) {
doneSaid = true;
doneP.textContent = statusText();
}
}
function advance(dt) {
sceneT += dt;
if (!manual) {
while (evAt < script.length && script[evAt].t <= sceneT) {
const ev = script[evAt];
evAt += 1;
ev.f();
}
if (sceneT >= LAP_S) {
lap += 1;
begin();
return;
}
}
update(dt);
}
// 첫 판은 START_S 만큼 앞서 시작한다 — 칸이 이미 움직이는 중인 장면에서 보인다
function runTo(t) {
while (sceneT < t - 1e-6) {
advance(Math.min(1 / 30, t - sceneT));
}
}
function begin() {
sceneT = 0;
evAt = 0;
script = [];
build();
if (lap === 0 && !still) {
runTo(START_S);
}
}
const DT_MAX = 0.05;
const SETTLE_FRAMES = 8;
const SETTLE_DT = 0.04;
function drawCursor() {
if (!curOn) {
return;
}
const hs = hits();
if (hs.length === 0) {
return;
}
const h = hs[clamp(ki, 0, hs.length - 1)];
outline(h.x + 1, h.y + 1, h.w - 2, h.h - 2, 5, 3, INK, 1);
outline(h.x - 1, h.y - 1, h.w + 2, h.h + 2, 6, 1.5, PAPER, 0.9);
}
function cursorLabel() {
const hs = hits();
return hs.length === 0 ? statusText() : hs[clamp(ki, 0, hs.length - 1)].label;
}
function showNow() {
draw();
drawCursor();
pushStatus(curOn ? cursorLabel() : statusText());
checkDone();
}
let rafId = 0;
let lastTs = -1;
function frame(ts) {
if (still || paused) {
rafId = 0;
return;
}
if (lastTs < 0) {
lastTs = ts;
}
const dt = Math.min((ts - lastTs) / 1000, DT_MAX);
lastTs = ts;
if (dt > 0) {
advance(dt);
}
showNow();
rafId = window.requestAnimationFrame(frame);
}
function startLoop() {
if (rafId) {
return;
}
// 멈췄던 사이의 시간을 첫 프레임 dt 로 넘기지 않는다
lastTs = -1;
rafId = window.requestAnimationFrame(frame);
}
function stopLoop() {
if (rafId) {
window.cancelAnimationFrame(rafId);
rafId = 0;
}
}
// 움직임 줄이기 — 루프 없이 배치가 끝난 정지 장면 한 장
function showRest() {
stopLoop();
lap = 0;
sceneT = 0;
evAt = 0;
script = [];
build();
runTo(REST_S);
showNow();
}
// 움직임 줄이기이거나 멈춘 채 입력이 들어오면 트윈 없이 곧바로 끝 배치로 — 시간을 3초 흘려 스프링·애니메이션을 다 끝낸다
function settleStill() {
for (let k = 0; k < 90; k += 1) {
sceneT += 1 / 30;
update(1 / 30);
}
}
function play() {
begin();
showNow();
if (!paused) {
startLoop();
}
}
function togglePause() {
paused = !paused;
pauseBtn.setAttribute('aria-pressed', paused ? 'true' : 'false');
wake();
if (paused) {
stopLoop();
}
else if (!still) {
startLoop();
}
}
function restart() {
manual = false;
curOn = false;
doneSaid = false;
lap += 1;
begin();
for (let k = 0; k < SETTLE_FRAMES; k += 1) {
update(SETTLE_DT);
}
showNow();
}
// Step — 멈춘 채 시간표의 다음 일 하나를 부른다. 더 부를 일이 없거나 직접 하던 중이면 다음 판을 연다
function stepOnce() {
wake();
if (!paused) {
paused = true;
pauseBtn.setAttribute('aria-pressed', 'true');
stopLoop();
}
if (manual || evAt >= script.length) {
restart();
return;
}
sceneT = Math.max(sceneT, script[evAt].t);
advance(0);
for (let k = 0; k < SETTLE_FRAMES; k += 1) {
sceneT += SETTLE_DT;
update(SETTLE_DT);
}
showNow();
}
function moveCur(d) {
const n = hits().length;
if (n === 0) {
return;
}
ki = (ki + d + n) % n;
}
function actCur(i) {
onAct(i);
// 멈춘 채·움직임 줄이기에서도 입력이 화면에 바로 반영되게 한다
if (still || paused) {
settleStill();
}
}
pauseBtn.addEventListener('click', togglePause, { signal: off.signal });
stepBtn.addEventListener('click', stepOnce, { signal: off.signal });
// 키보드 — 무대에 포커스가 있을 때만. 방향키는 칸 이동, Enter·Space 는 칸 고르기, P 는 Pause, N 은 Step, R 은 다시
pad.addEventListener('keydown', function (e) {
if (e.altKey || e.ctrlKey || e.metaKey) {
return;
}
const k = e.key;
if (k === 'ArrowLeft' || k === 'ArrowUp') {
e.preventDefault();
takeOver();
moveCur(-1);
showNow();
}
else if (k === 'ArrowRight' || k === 'ArrowDown') {
e.preventDefault();
takeOver();
moveCur(1);
showNow();
}
else if (k === 'Enter' || k === ' ') {
e.preventDefault();
takeOver();
actCur(ki);
showNow();
}
else if (k === 'p' || k === 'P') {
togglePause();
}
else if (k === 'n' || k === 'N') {
stepOnce();
}
else if (k === 'r' || k === 'R') {
restart();
}
}, { signal: off.signal });
// 마우스·터치 — 누른 자리의 칸을 고른다
pad.addEventListener('click', function (e) {
const rect = cv.getBoundingClientRect();
const px = (e.clientX - rect.left) / rect.width * W;
const py = (e.clientY - rect.top) / rect.height * H;
const hs = hits();
let at = -1;
for (let i = 0; i < hs.length; i += 1) {
if (px >= hs[i].x && px <= hs[i].x + hs[i].w && py >= hs[i].y && py <= hs[i].y + hs[i].h) {
at = i;
}
}
if (at < 0) {
return;
}
takeOver();
ki = at;
actCur(at);
showNow();
}, { signal: off.signal });
// 탭이 숨으면 멈추고, 돌아오면 시계를 다시 맞춰 시작 — 숨은 동안의 몇 초가 한 프레임에 몰리지 않게
document.addEventListener('visibilitychange', function () {
if (document.hidden) {
stopLoop();
}
else if (!paused && !still) {
startLoop();
}
}, { signal: off.signal });
// 설정이 바뀌면 — 켜지면 배치가 끝난 한 장, 꺼지면 다시 움직인다
reduceQuery.addEventListener('change', function () {
still = reduceQuery.matches;
if (still) {
showRest();
}
else {
lap = 0;
play();
}
}, { signal: off.signal });
window.addEventListener('resize', function () {
fitCanvas();
showNow();
}, { signal: off.signal });
// 03 — 자료의 범위에서 눈금 간격을 1·2·5 에 10 의 거듭제곱을 곱한 값으로 골라 축 끝을 깔끔한 수로 늘린다. 크기는 축이 없어 대표 원 세 개로 범례를 그린다. 자료를 바꾸면 눈금과 거품이 한 번에 따라 움직인다
const TICK_TARGET = 5;
const N = 14;
const TRANS_S = 1.3;
const LAP_S = 10.2;
const START_S = 1.0;
const REST_S = 3.2;
const PLOT = { x: 56, y: 76, w: 288, h: 172 };
const LEGEND_X = 400;
const R_TOP = 22;
// 눈금 간격 — 범위를 목표 칸 수로 나눈 값에 가장 가까운 1·2·5 × 10 의 거듭제곱
function niceStep(range, target) {
const raw = range / target;
const p = Math.pow(10, Math.floor(Math.log10(raw)));
const f = raw / p;
const m = f <= 1.5 ? 1 : (f <= 3.5 ? 2 : (f <= 7.5 ? 5 : 10));
return m * p;
}
function niceAxis(lo, hi) {
const step = niceStep(hi - lo, TICK_TARGET);
return { a: Math.floor(lo / step + 1e-9) * step, b: Math.ceil(hi / step - 1e-9) * step, step: step };
}
// Size 범례 — 최댓값을 넘지 않는 가장 큰 1·2·5 × 10 의 거듭제곱을 맨 위로 두고 그 절반과 5분의 1 을 더한다
function floorNice(v) {
const p = Math.pow(10, Math.floor(Math.log10(v)));
const f = v / p;
return (f >= 5 ? 5 : (f >= 2 ? 2 : 1)) * p;
}
function legendSizes(vmax) {
const top = floorNice(vmax);
return [top, top / 2, top / 5];
}
function fmt(v, step) {
const dec = step >= 1 ? 0 : Math.ceil(-Math.log10(step) - 1e-9);
const s = (Math.abs(v) < step * 1e-6 ? 0 : v).toFixed(dec);
return s;
}
const RANGES = [[3, 38, 12, 94, 8, 640], [120, 860, 0.2, 1.3, 40, 3200], [-12, 26, 400, 2900, 2, 45]];
function makeSet(k) {
const rnd = seeded(300 + k * 41 + (lap % 2) * 7);
const g = RANGES[k];
const d = { xs: [], ys: [], ss: [] };
for (let i = 0; i < N; i += 1) {
d.xs.push(lerp(g[0], g[1], rnd()));
d.ys.push(lerp(g[2], g[3], rnd()));
d.ss.push(lerp(g[4], g[5], rnd() * rnd()));
}
d.ss[0] = g[5];
return d;
}
let sets = [];
let axX = [];
let axY = [];
let legT = [];
let from = 0;
let to = 0;
let prog = 1;
function axisOf(d) {
axX.push(niceAxis(Math.min.apply(null, d.xs), Math.max.apply(null, d.xs)));
axY.push(niceAxis(Math.min.apply(null, d.ys), Math.max.apply(null, d.ys)));
legT.push(floorNice(Math.max.apply(null, d.ss)));
}
function goTo(k) { from = to; to = k % 3; prog = 0; }
function build() {
sets = [makeSet(0), makeSet(1), makeSet(2)];
axX = [];
axY = [];
legT = [];
sets.forEach(axisOf);
from = 0;
to = 0;
prog = 1;
script.push({ t: 0.4, f: function () { goTo(1); } });
script.push({ t: 2.0, f: function () { goTo(2); } });
script.push({ t: 3.6, f: function () { goTo(0); } });
}
function update(dt) {
if (dt > 0 && prog < 1) {
prog = Math.min(1, prog + dt / TRANS_S);
}
}
function blend(a, b) { return lerp(a, b, ease(prog)); }
function curAxis(xAxis) {
const A = xAxis ? axX : axY;
return { a: blend(A[from].a, A[to].a), b: blend(A[from].b, A[to].b), step: A[to].step };
}
function mapX(v, ax) { return PLOT.x + PLOT.w * (v - ax.a) / (ax.b - ax.a); }
function mapY(v, ax) { return PLOT.y + PLOT.h - PLOT.h * (v - ax.a) / (ax.b - ax.a); }
function rOf(s, top) { return R_TOP * Math.sqrt(Math.max(s, 0) / top); }
function curTop() { return blend(legT[from], legT[to]); }
function bubbleAt(i) {
const ax = curAxis(true);
const ay = curAxis(false);
const x = blend(sets[from].xs[i], sets[to].xs[i]);
const y = blend(sets[from].ys[i], sets[to].ys[i]);
const s = blend(sets[from].ss[i], sets[to].ss[i]);
return { x: mapX(x, ax), y: mapY(y, ay), r: rOf(s, curTop()), v: s, g: i };
}
function drawTicks(k, a) {
if (a <= 0.01) {
return;
}
const ax = curAxis(true);
const ay = curAxis(false);
const tx = axX[k];
const ty = axY[k];
for (let v = tx.a; v <= tx.b + tx.step * 1e-6; v += tx.step) {
const x = mapX(v, ax);
if (x < PLOT.x - 1 || x > PLOT.x + PLOT.w + 1) {
continue;
}
line(x, PLOT.y, x, PLOT.y + PLOT.h, 1, INK2, 0.14 * a);
text(fmt(v, tx.step), x, PLOT.y + PLOT.h + 11, INK2, a, 9, 700, 'center');
}
for (let v = ty.a; v <= ty.b + ty.step * 1e-6; v += ty.step) {
const y = mapY(v, ay);
if (y < PLOT.y - 1 || y > PLOT.y + PLOT.h + 1) {
continue;
}
line(PLOT.x, y, PLOT.x + PLOT.w, y, 1, INK2, 0.14 * a);
text(fmt(v, ty.step), PLOT.x - 6, y, INK2, a, 9, 700, 'right');
}
}
function draw() {
skyFill(BG_TOP, BG_BOT);
bed(PANEL_ONE);
box(PLOT.x, PLOT.y, PLOT.w, PLOT.h, 6, PAPER, 0.7);
const e = ease(prog);
if (from !== to) {
drawTicks(from, 1 - e);
}
drawTicks(to, from !== to ? e : 1);
const bs = [];
for (let i = 0; i < N; i += 1) {
bs.push(bubbleAt(i));
}
const order = bs.map(function (_b, i) { return i; }).sort(function (a, b) { return bs[b].r - bs[a].r; });
for (const i of order) {
orb(bs[i].x, bs[i].y, bs[i].r, TILES[i % 8], 0.86);
}
for (const i of order) {
if (bs[i].r >= 11) {
text(NAMES[i], bs[i].x, bs[i].y + 0.5, INK, 1, 10, 700, 'center');
}
}
// 범례 — 대표 원 세 개의 반지름도 같은 rOf 로 그린다
const top = curTop();
const sizes = legendSizes(top);
tag('Size', LEGEND_X, 92, INK, PAPER, 10, 'center');
let y = 106;
for (const s of sizes) {
const r = rOf(s, top);
ring(LEGEND_X, y + r, r, 2, INK, 0.9);
text(fmt(s, niceStep(s, 2)), LEGEND_X, y + r, INK, 1, 9, 700, 'center');
y += r * 2 + 8;
}
}
function statusText() {
return 'X tick {a} · Y tick {b}'.replace('{a}', fmt(axX[to].step, axX[to].step)).replace('{b}', fmt(axY[to].step, axY[to].step));
}
function hits() {
const bs = [];
for (let i = 0; i < N; i += 1) {
bs.push(bubbleAt(i));
}
return bs.map(function (b, i) {
const x = blend(sets[from].xs[i], sets[to].xs[i]);
const y = blend(sets[from].ys[i], sets[to].ys[i]);
return ballHit(b, '{n} x {x} · y {y} · size {s}'.replace('{n}', NAMES[i]).replace('{x}', fmt(x, axX[to].step / 10)).replace('{y}', fmt(y, axY[to].step / 10)).replace('{s}', String(Math.round(b.v))));
});
}
// 직접 고르면 다음 자료로 바꾼다
function onAct(_i) { goTo(to + 1); }
function onTake() { return; }
fitCanvas();
if (still) {
showRest();
}
else {
play();
}
return function () {
stopLoop();
off.abort();
};
})();// ThreeAxisNiceTickScatter - 같은 항목 vanilla index.html 의 React 판. 같은 계산을 useEffect 안에서 돌린다
import { useEffect, useRef } from "react";
import styles from "./ThreeAxisNiceTickScatter.module.scss";
const cx = (s: string): string => s.split(" ").map((n) => styles[n] ?? n).join(" ");
export default function ThreeAxisNiceTickScatter() {
const rootRef = useRef<HTMLDivElement | null>(null);
useEffect(() => {
const rootEl = rootRef.current;
if (!rootEl) return;
const root: HTMLElement = rootEl;
type RGB = [number, number, number];
type RGBA = [number, number, number, number];
// 무대 좌표 — 캔버스 안 계산은 늘 480×300. 화면에 보이는 크기와 상관없다
const W = 480;
const H = 300;
const TAU = Math.PI * 2;
function clamp(v: number, lo: number, hi: number): number { return v < lo ? lo : (v > hi ? hi : v); }
function lerp(a: number, b: number, k: number): number { return a + (b - a) * k; }
function ease(x: number): number { const c = clamp(x, 0, 1); return c * c * (3 - 2 * c); }
// 끝에서 한 번 넘쳤다 돌아오는 곡선 — 거품이 자리에 튀어 나올 때
function backOut(x: number): number {
const c = clamp(x, 0, 1) - 1;
return 1 + 2.70158 * c * c * c + 1.70158 * c * c;
}
// 시드 고정 난수 — 선형 합동 생성기(곱 1664525, 더함 1013904223). 같은 시드면 같은 수열
function seeded(seed: number): () => number {
let s = (seed >>> 0) || 1;
return function (): number {
s = (Math.imul(s, 1664525) + 1013904223) >>> 0;
return s / 4294967296;
};
}
// 파스텔 팔레트 — 거품은 연한 면, 글자는 늘 진한 잉크
const BG_TOP: RGB = [248, 244, 252];
const BG_BOT: RGB = [228, 234, 250];
const BED: RGB = [226, 220, 242];
const INK: RGB = [40, 36, 54];
const INK2: RGB = [66, 60, 90];
const PAPER: RGB = [250, 246, 240];
const ROSE: RGB = [244, 162, 186];
const MINT: RGB = [148, 212, 182];
const TILES: RGB[] = [
[200, 190, 244], [168, 222, 200], [250, 228, 150], [246, 184, 200],
[172, 208, 246], [250, 208, 170], [196, 222, 170], [222, 190, 240],
];
function mix(a: RGB, b: RGB, k: number): RGB { return [lerp(a[0], b[0], k), lerp(a[1], b[1], k), lerp(a[2], b[2], k)]; }
function rgba(c: RGB, a: number): string {
return 'rgba(' + Math.round(clamp(c[0], 0, 255)) + ',' + Math.round(clamp(c[1], 0, 255)) + ',' + Math.round(clamp(c[2], 0, 255)) + ',' + clamp(a, 0, 1).toFixed(3) + ')';
}
// 장면 시계(초)·판 반복 번호·시간표 — 시간표는 (시각, 할 일) 목록이고 시각이 지나면 한 번씩 부른다
let sceneT = 0;
let lap = 0;
type Ev = { t: number; f: () => void };
let script: Ev[] = [];
let evAt = 0;
type Rect = { x: number; y: number; w: number; h: number };
// 키보드·클릭 대상 — 거품 하나의 사각형(캔버스 좌표)과 읽어 줄 문장
type Hit = { x: number; y: number; w: number; h: number; label: string };
// ── 거품 계산 ─────────────────────────────────────────────
// 거품 하나 — 중심 (x, y), 반지름 r, 값 v, 묶음 번호 g
type Ball = { x: number; y: number; r: number; v: number; g: number };
// 겹침 한 번 풀기 — 두 원의 중심 거리 d 가 반지름 합에 gap 을 더한 값보다 작으면 모자란 만큼(o)을 두 원의 크기 비율로 나눠 서로 밀어낸다(작은 원이 더 많이 움직인다)
function relaxPass(bs: Ball[], gap: number): void {
for (let i = 0; i < bs.length; i += 1) {
for (let j = i + 1; j < bs.length; j += 1) {
const a = bs[i];
const b = bs[j];
let dx = b.x - a.x;
let dy = b.y - a.y;
let d = Math.sqrt(dx * dx + dy * dy);
const need = a.r + b.r + gap;
if (d >= need) { continue; }
if (d < 1e-6) { dx = Math.cos(i * 2.399 + j * 1.131); dy = Math.sin(i * 2.399 + j * 1.131); d = 1; }
const o = need - d;
const ux = dx / d;
const uy = dy / d;
const sa = b.r / (a.r + b.r);
const sb = a.r / (a.r + b.r);
a.x -= ux * o * sa;
a.y -= uy * o * sa;
b.x += ux * o * sb;
b.y += uy * o * sb;
}
}
}
// 판 안에 가두기 — 원 전체가 사각형 안에 있게 중심을 자른다
function keepIn(bs: Ball[], R: Rect): void {
for (const b of bs) {
b.x = clamp(b.x, R.x + b.r, R.x + R.w - b.r);
b.y = clamp(b.y, R.y + b.r, R.y + R.h - b.r);
}
}
// 겹침 합 — 모든 원 쌍에서 (반지름 합 - 중심 거리) 가 양수인 만큼을 더한 값. 0 이면 겹침이 없다
function overlapOf(bs: Ball[]): number {
let s = 0;
for (let i = 0; i < bs.length; i += 1) {
for (let j = i + 1; j < bs.length; j += 1) {
const d = Math.hypot(bs[j].x - bs[i].x, bs[j].y - bs[i].y);
const o = bs[i].r + bs[j].r - d;
if (o > 0) { s += o; }
}
}
return s;
}
// 반복해서 풀기 — passes 번 겹침을 밀고, 매번 판 중심으로 pull 만큼 끌어당긴 뒤 판 안으로 자른다. 끝난 뒤 남은 겹침 합을 돌려준다
function relax(bs: Ball[], R: Rect, passes: number, gap: number, pull: number): number {
const cx = R.x + R.w / 2;
const cy = R.y + R.h / 2;
for (let p = 0; p < passes; p += 1) {
relaxPass(bs, gap);
if (pull > 0) {
for (const b of bs) { b.x += (cx - b.x) * pull; b.y += (cy - b.y) * pull; }
}
keepIn(bs, R);
}
return overlapOf(bs);
}
function sumOf(vals: number[]): number { let s = 0; for (const v of vals) { s += v; } return s; }
function r1(v: number): string { return String(Math.round(v * 10) / 10); }
// ── 자체 가상 데이터 ──────────────────────────────────────
const NAMES: string[] = [
'버터', '쿠키', '우유', '차', '꿀', '잼', '빵', '국수', '밥', '김', '콩', '귤',
'배', '밤', '깨', '팥', '쌀', '소금', '식초', '두부', '미역', '호박', '감', '쑥',
];
// ── 글자 폭 어림 ──────────────────────────────────────────
// 한글·한자·가나는 글자 크기만큼, 로마자는 0.56 배로 어림한다 — 실제 폭을 재지 않고 문자 수에서 곧바로 구한다
function glyphW(s: string, px: number): number {
let w = 0;
for (let i = 0; i < s.length; i += 1) { w += (s.charCodeAt(i) >= 0x2e80 ? 1 : 0.56) * px; }
return w;
}
// 문구 틀의 {a}·{b} 자리에 값을 끼운다 — 화면 문구는 늘 이 틀 한 줄로 두고 로케일 사전이 통째로 바꾼다
function fill(s: string, a: string, b?: string): string { return s.replace('{a}', a).replace('{b}', b === undefined ? '' : b); }
const canvasEl = root.querySelector('[data-role="canvas"]') as HTMLCanvasElement | null;
const padEl = root.querySelector('[data-role="pad"]') as HTMLElement | null;
const pauseEl = root.querySelector('[data-role="pause"]') as HTMLButtonElement | null;
const statusEl = root.querySelector('[data-role="status"]') as HTMLElement | null;
const stepEl = root.querySelector('[data-role="step"]') as HTMLButtonElement | null;
const doneEl = root.querySelector('[data-role="done"]') as HTMLElement | null;
const ctxRaw = canvasEl ? canvasEl.getContext('2d') : null;
if (!canvasEl || !ctxRaw || !pauseEl || !padEl || !stepEl || !doneEl) { return; }
const cv: HTMLCanvasElement = canvasEl;
const ctx: CanvasRenderingContext2D = ctxRaw;
const pauseBtn: HTMLButtonElement = pauseEl;
const stepBtn: HTMLButtonElement = stepEl;
const doneP: HTMLElement = doneEl;
const pad: HTMLElement = padEl;
// 외부 웹폰트는 부르지 않는다 — 기기에 있는 글꼴 목록만
const FONT_STACK = 'system-ui, -apple-system, "Segoe UI", "Noto Sans KR", sans-serif';
let dpr = 1;
function fitCanvas(): void {
// 배율은 2 에서 자른다 — 배율 3 기기에서 화소가 2.25배로 늘지 않게
dpr = Math.min(window.devicePixelRatio || 1, 2);
cv.width = Math.round(W * dpr);
cv.height = Math.round(H * dpr);
ctx.setTransform(dpr, 0, 0, dpr, 0, 0);
}
function skyFill(top: RGB, bot: RGB): void {
const g = ctx.createLinearGradient(0, 0, 0, H);
g.addColorStop(0, rgba(top, 1));
g.addColorStop(1, rgba(bot, 1));
ctx.fillStyle = g;
ctx.fillRect(0, 0, W, H);
}
function disc(x: number, y: number, r: number, c: RGB, a: number): void {
if (r <= 0.2 || a <= 0) { return; }
ctx.beginPath();
ctx.arc(x, y, r, 0, TAU);
ctx.fillStyle = rgba(c, a);
ctx.fill();
}
function box(x: number, y: number, w: number, h: number, r: number, c: RGB, a: number): void {
if (w <= 0.2 || h <= 0.2 || a <= 0) { return; }
ctx.beginPath();
ctx.roundRect(x, y, w, h, Math.max(0, Math.min(r, w / 2, h / 2)));
ctx.fillStyle = rgba(c, a);
ctx.fill();
}
function outline(x: number, y: number, w: number, h: number, r: number, width: number, c: RGB, a: number): void {
if (w <= 0.2 || h <= 0.2 || a <= 0) { return; }
ctx.beginPath();
ctx.roundRect(x, y, w, h, Math.max(0, Math.min(r, w / 2, h / 2)));
ctx.lineWidth = width;
ctx.strokeStyle = rgba(c, a);
ctx.stroke();
}
function text(s: string, x: number, y: number, c: RGB, a: number, px: number, weight: number, align: CanvasTextAlign): void {
ctx.font = weight + ' ' + px + 'px ' + FONT_STACK;
ctx.textAlign = align;
ctx.textBaseline = 'middle';
ctx.fillStyle = rgba(c, a);
ctx.fillText(s, x, y);
}
// 글자 이름표 — 바탕 알약 위에 글자
function tag(s: string, x: number, y: number, bg: RGB, fg: RGB, px: number, align: CanvasTextAlign): void {
ctx.font = '700 ' + px + 'px ' + FONT_STACK;
const w = ctx.measureText(s).width + px * 1.1;
const left = align === 'center' ? x - w / 2 : (align === 'right' ? x - w : x);
box(left, y - px * 0.82, w, px * 1.64, px * 0.82, bg, 0.92);
text(s, left + w / 2, y + 0.5, fg, 1, px, 700, 'center');
}
// 판 자리 — 왼쪽 판·오른쪽 판(대비판)·한 판짜리 히어로. 위쪽은 상태 줄·버튼 자리
const PANEL_L: Rect = { x: 12, y: 78, w: 222, h: 208 };
const PANEL_R: Rect = { x: 246, y: 78, w: 222, h: 208 };
const PANEL_ONE: Rect = { x: 12, y: 60, w: 456, h: 228 };
// 판 바닥 — 칸 사이 틈으로 비치는 연보라
function bed(R: Rect): void {
box(R.x - 3, R.y - 3, R.w + 6, R.h + 6, 10, BED, 1);
}
function panelTags(a: string, b: string): void {
tag(a, PANEL_L.x + PANEL_L.w / 2, 66, INK, PAPER, 10, 'center');
tag(b, PANEL_R.x + PANEL_R.w / 2, 66, PAPER, INK, 10, 'center');
}
// 거품 한 개 — 면, 왼쪽 위 하이라이트, 옅은 윤곽
function orb(x: number, y: number, r: number, c: RGB, a: number): void {
if (r <= 0.3 || a <= 0) { return; }
disc(x, y, r, c, a);
if (r > 5) { disc(x - r * 0.28, y - r * 0.32, r * 0.42, [255, 255, 255], 0.3 * a); }
ctx.beginPath();
ctx.arc(x, y, r, 0, TAU);
ctx.lineWidth = 1;
ctx.strokeStyle = rgba(mix(c, INK, 0.28), 0.55 * a);
ctx.stroke();
}
function line(x0: number, y0: number, x1: number, y1: number, width: number, c: RGB, a: number): void {
if (a <= 0) { return; }
ctx.beginPath();
ctx.moveTo(x0, y0);
ctx.lineTo(x1, y1);
ctx.lineWidth = width;
ctx.strokeStyle = rgba(c, a);
ctx.stroke();
}
function ring(x: number, y: number, r: number, width: number, c: RGB, a: number): void {
if (r <= 0.3 || a <= 0) { return; }
ctx.beginPath();
ctx.arc(x, y, r, 0, TAU);
ctx.lineWidth = width;
ctx.strokeStyle = rgba(c, a);
ctx.stroke();
}
function ballHit(b: Ball, label: string): Hit {
return { x: b.x - b.r, y: b.y - b.r, w: b.r * 2, h: b.r * 2, label: label };
}
let shownStatus = '';
function pushStatus(s: string): void {
if (!statusEl || s === shownStatus) { return; }
shownStatus = s;
statusEl.textContent = s;
}
let paused = false;
const reduceQuery = window.matchMedia('(prefers-reduced-motion: reduce)');
// 페이지를 연 채 움직임 줄이기 설정을 바꿔도 change 리스너가 다시 읽는다
let still = reduceQuery.matches;
// 자동 시연 표시 — 사람이 처음 손대면 떼고 상태 줄을 polite 로 켠다
let demo = root.classList.contains('is-demo');
const off = new AbortController();
// 사람이 직접 하는 중이면 시간표는 멈추고 애니메이션만 흐른다
let manual = false;
// curOn 이면 키보드 칸 고르기가 켜진 것 — ki 가 hits() 안 번호
let curOn = false;
let ki = 0;
function wake(): void {
if (!demo) { return; }
demo = false;
root.classList.remove('is-demo');
if (statusEl) { statusEl.setAttribute('aria-live', 'polite'); }
}
function takeOver(): void {
if (manual) { return; }
manual = true;
onTake();
wake();
if (!curOn) { curOn = true; ki = 0; }
}
// 한 판 시연이 끝났음을 스크린리더에 한 번만 알린다 — 판이 되풀이돼도 다시 읽지 않는다
let doneSaid = false;
function checkDone(): void {
if (!manual && !doneSaid && sceneT >= LAP_S - 0.6) {
doneSaid = true;
doneP.textContent = statusText();
}
}
function advance(dt: number): void {
sceneT += dt;
if (!manual) {
while (evAt < script.length && script[evAt].t <= sceneT) {
const ev = script[evAt];
evAt += 1;
ev.f();
}
if (sceneT >= LAP_S) { lap += 1; begin(); return; }
}
update(dt);
}
// 첫 판은 START_S 만큼 앞서 시작한다 — 칸이 이미 움직이는 중인 장면에서 보인다
function runTo(t: number): void {
while (sceneT < t - 1e-6) { advance(Math.min(1 / 30, t - sceneT)); }
}
function begin(): void {
sceneT = 0;
evAt = 0;
script = [];
build();
if (lap === 0 && !still) { runTo(START_S); }
}
const DT_MAX = 0.05;
const SETTLE_FRAMES = 8;
const SETTLE_DT = 0.04;
function drawCursor(): void {
if (!curOn) { return; }
const hs = hits();
if (hs.length === 0) { return; }
const h = hs[clamp(ki, 0, hs.length - 1)];
outline(h.x + 1, h.y + 1, h.w - 2, h.h - 2, 5, 3, INK, 1);
outline(h.x - 1, h.y - 1, h.w + 2, h.h + 2, 6, 1.5, PAPER, 0.9);
}
function cursorLabel(): string {
const hs = hits();
return hs.length === 0 ? statusText() : hs[clamp(ki, 0, hs.length - 1)].label;
}
function showNow(): void {
draw();
drawCursor();
pushStatus(curOn ? cursorLabel() : statusText());
checkDone();
}
let rafId = 0;
let lastTs = -1;
function frame(ts: number): void {
if (still || paused) { rafId = 0; return; }
if (lastTs < 0) { lastTs = ts; }
const dt = Math.min((ts - lastTs) / 1000, DT_MAX);
lastTs = ts;
if (dt > 0) { advance(dt); }
showNow();
rafId = window.requestAnimationFrame(frame);
}
function startLoop(): void {
if (rafId) { return; }
// 멈췄던 사이의 시간을 첫 프레임 dt 로 넘기지 않는다
lastTs = -1;
rafId = window.requestAnimationFrame(frame);
}
function stopLoop(): void {
if (rafId) { window.cancelAnimationFrame(rafId); rafId = 0; }
}
// 움직임 줄이기 — 루프 없이 배치가 끝난 정지 장면 한 장
function showRest(): void {
stopLoop();
lap = 0;
sceneT = 0;
evAt = 0;
script = [];
build();
runTo(REST_S);
showNow();
}
// 움직임 줄이기이거나 멈춘 채 입력이 들어오면 트윈 없이 곧바로 끝 배치로 — 시간을 3초 흘려 스프링·애니메이션을 다 끝낸다
function settleStill(): void {
for (let k = 0; k < 90; k += 1) { sceneT += 1 / 30; update(1 / 30); }
}
function play(): void {
begin();
showNow();
if (!paused) { startLoop(); }
}
function togglePause(): void {
paused = !paused;
pauseBtn.setAttribute('aria-pressed', paused ? 'true' : 'false');
wake();
if (paused) { stopLoop(); } else if (!still) { startLoop(); }
}
function restart(): void {
manual = false;
curOn = false;
doneSaid = false;
lap += 1;
begin();
for (let k = 0; k < SETTLE_FRAMES; k += 1) { update(SETTLE_DT); }
showNow();
}
// 한 걸음 — 멈춘 채 시간표의 다음 일 하나를 부른다. 더 부를 일이 없거나 직접 하던 중이면 다음 판을 연다
function stepOnce(): void {
wake();
if (!paused) {
paused = true;
pauseBtn.setAttribute('aria-pressed', 'true');
stopLoop();
}
if (manual || evAt >= script.length) {
restart();
return;
}
sceneT = Math.max(sceneT, script[evAt].t);
advance(0);
for (let k = 0; k < SETTLE_FRAMES; k += 1) { sceneT += SETTLE_DT; update(SETTLE_DT); }
showNow();
}
function moveCur(d: number): void {
const n = hits().length;
if (n === 0) { return; }
ki = (ki + d + n) % n;
}
function actCur(i: number): void {
onAct(i);
// 멈춘 채·움직임 줄이기에서도 입력이 화면에 바로 반영되게 한다
if (still || paused) { settleStill(); }
}
pauseBtn.addEventListener('click', togglePause, { signal: off.signal });
stepBtn.addEventListener('click', stepOnce, { signal: off.signal });
// 키보드 — 무대에 포커스가 있을 때만. 방향키는 칸 이동, Enter·Space 는 칸 고르기, P 는 일시정지, N 은 한 걸음, R 은 다시
pad.addEventListener('keydown', function (e: KeyboardEvent): void {
if (e.altKey || e.ctrlKey || e.metaKey) { return; }
const k = e.key;
if (k === 'ArrowLeft' || k === 'ArrowUp') {
e.preventDefault();
takeOver();
moveCur(-1);
showNow();
} else if (k === 'ArrowRight' || k === 'ArrowDown') {
e.preventDefault();
takeOver();
moveCur(1);
showNow();
} else if (k === 'Enter' || k === ' ') {
e.preventDefault();
takeOver();
actCur(ki);
showNow();
} else if (k === 'p' || k === 'P') {
togglePause();
} else if (k === 'n' || k === 'N') {
stepOnce();
} else if (k === 'r' || k === 'R') {
restart();
}
}, { signal: off.signal });
// 마우스·터치 — 누른 자리의 칸을 고른다
pad.addEventListener('click', function (e: MouseEvent): void {
const rect = cv.getBoundingClientRect();
const px = (e.clientX - rect.left) / rect.width * W;
const py = (e.clientY - rect.top) / rect.height * H;
const hs = hits();
let at = -1;
for (let i = 0; i < hs.length; i += 1) {
if (px >= hs[i].x && px <= hs[i].x + hs[i].w && py >= hs[i].y && py <= hs[i].y + hs[i].h) { at = i; }
}
if (at < 0) { return; }
takeOver();
ki = at;
actCur(at);
showNow();
}, { signal: off.signal });
// 탭이 숨으면 멈추고, 돌아오면 시계를 다시 맞춰 시작 — 숨은 동안의 몇 초가 한 프레임에 몰리지 않게
document.addEventListener('visibilitychange', function (): void {
if (document.hidden) { stopLoop(); } else if (!paused && !still) { startLoop(); }
}, { signal: off.signal });
// 설정이 바뀌면 — 켜지면 배치가 끝난 한 장, 꺼지면 다시 움직인다
reduceQuery.addEventListener('change', function (): void {
still = reduceQuery.matches;
if (still) { showRest(); } else { lap = 0; play(); }
}, { signal: off.signal });
window.addEventListener('resize', function (): void {
fitCanvas();
showNow();
}, { signal: off.signal });
// 03 — 자료의 범위에서 눈금 간격을 1·2·5 에 10 의 거듭제곱을 곱한 값으로 골라 축 끝을 깔끔한 수로 늘린다. 크기는 축이 없어 대표 원 세 개로 범례를 그린다. 자료를 바꾸면 눈금과 거품이 한 번에 따라 움직인다
const TICK_TARGET = 5;
const N = 14;
const TRANS_S = 1.3;
const LAP_S = 10.2;
const START_S = 1.0;
const REST_S = 3.2;
const PLOT: Rect = { x: 56, y: 76, w: 288, h: 172 };
const LEGEND_X = 400;
const R_TOP = 22;
type DS = { xs: number[]; ys: number[]; ss: number[] };
type Axis = { a: number; b: number; step: number };
// 눈금 간격 — 범위를 목표 칸 수로 나눈 값에 가장 가까운 1·2·5 × 10 의 거듭제곱
function niceStep(range: number, target: number): number {
const raw = range / target;
const p = Math.pow(10, Math.floor(Math.log10(raw)));
const f = raw / p;
const m = f <= 1.5 ? 1 : (f <= 3.5 ? 2 : (f <= 7.5 ? 5 : 10));
return m * p;
}
function niceAxis(lo: number, hi: number): Axis {
const step = niceStep(hi - lo, TICK_TARGET);
return { a: Math.floor(lo / step + 1e-9) * step, b: Math.ceil(hi / step - 1e-9) * step, step: step };
}
// 크기 범례 — 최댓값을 넘지 않는 가장 큰 1·2·5 × 10 의 거듭제곱을 맨 위로 두고 그 절반과 5분의 1 을 더한다
function floorNice(v: number): number {
const p = Math.pow(10, Math.floor(Math.log10(v)));
const f = v / p;
return (f >= 5 ? 5 : (f >= 2 ? 2 : 1)) * p;
}
function legendSizes(vmax: number): number[] {
const top = floorNice(vmax);
return [top, top / 2, top / 5];
}
function fmt(v: number, step: number): string {
const dec = step >= 1 ? 0 : Math.ceil(-Math.log10(step) - 1e-9);
const s = (Math.abs(v) < step * 1e-6 ? 0 : v).toFixed(dec);
return s;
}
const RANGES: number[][] = [[3, 38, 12, 94, 8, 640], [120, 860, 0.2, 1.3, 40, 3200], [-12, 26, 400, 2900, 2, 45]];
function makeSet(k: number): DS {
const rnd = seeded(300 + k * 41 + (lap % 2) * 7);
const g = RANGES[k];
const d: DS = { xs: [], ys: [], ss: [] };
for (let i = 0; i < N; i += 1) {
d.xs.push(lerp(g[0], g[1], rnd()));
d.ys.push(lerp(g[2], g[3], rnd()));
d.ss.push(lerp(g[4], g[5], rnd() * rnd()));
}
d.ss[0] = g[5];
return d;
}
let sets: DS[] = [];
let axX: Axis[] = [];
let axY: Axis[] = [];
let legT: number[] = [];
let from = 0;
let to = 0;
let prog = 1;
function axisOf(d: DS): void {
axX.push(niceAxis(Math.min.apply(null, d.xs), Math.max.apply(null, d.xs)));
axY.push(niceAxis(Math.min.apply(null, d.ys), Math.max.apply(null, d.ys)));
legT.push(floorNice(Math.max.apply(null, d.ss)));
}
function goTo(k: number): void { from = to; to = k % 3; prog = 0; }
function build(): void {
sets = [makeSet(0), makeSet(1), makeSet(2)];
axX = [];
axY = [];
legT = [];
sets.forEach(axisOf);
from = 0;
to = 0;
prog = 1;
script.push({ t: 0.4, f: function (): void { goTo(1); } });
script.push({ t: 2.0, f: function (): void { goTo(2); } });
script.push({ t: 3.6, f: function (): void { goTo(0); } });
}
function update(dt: number): void {
if (dt > 0 && prog < 1) { prog = Math.min(1, prog + dt / TRANS_S); }
}
function blend(a: number, b: number): number { return lerp(a, b, ease(prog)); }
function curAxis(xAxis: boolean): Axis {
const A = xAxis ? axX : axY;
return { a: blend(A[from].a, A[to].a), b: blend(A[from].b, A[to].b), step: A[to].step };
}
function mapX(v: number, ax: Axis): number { return PLOT.x + PLOT.w * (v - ax.a) / (ax.b - ax.a); }
function mapY(v: number, ax: Axis): number { return PLOT.y + PLOT.h - PLOT.h * (v - ax.a) / (ax.b - ax.a); }
function rOf(s: number, top: number): number { return R_TOP * Math.sqrt(Math.max(s, 0) / top); }
function curTop(): number { return blend(legT[from], legT[to]); }
function bubbleAt(i: number): Ball {
const ax = curAxis(true);
const ay = curAxis(false);
const x = blend(sets[from].xs[i], sets[to].xs[i]);
const y = blend(sets[from].ys[i], sets[to].ys[i]);
const s = blend(sets[from].ss[i], sets[to].ss[i]);
return { x: mapX(x, ax), y: mapY(y, ay), r: rOf(s, curTop()), v: s, g: i };
}
function drawTicks(k: number, a: number): void {
if (a <= 0.01) { return; }
const ax = curAxis(true);
const ay = curAxis(false);
const tx = axX[k];
const ty = axY[k];
for (let v = tx.a; v <= tx.b + tx.step * 1e-6; v += tx.step) {
const x = mapX(v, ax);
if (x < PLOT.x - 1 || x > PLOT.x + PLOT.w + 1) { continue; }
line(x, PLOT.y, x, PLOT.y + PLOT.h, 1, INK2, 0.14 * a);
text(fmt(v, tx.step), x, PLOT.y + PLOT.h + 11, INK2, a, 9, 700, 'center');
}
for (let v = ty.a; v <= ty.b + ty.step * 1e-6; v += ty.step) {
const y = mapY(v, ay);
if (y < PLOT.y - 1 || y > PLOT.y + PLOT.h + 1) { continue; }
line(PLOT.x, y, PLOT.x + PLOT.w, y, 1, INK2, 0.14 * a);
text(fmt(v, ty.step), PLOT.x - 6, y, INK2, a, 9, 700, 'right');
}
}
function draw(): void {
skyFill(BG_TOP, BG_BOT);
bed(PANEL_ONE);
box(PLOT.x, PLOT.y, PLOT.w, PLOT.h, 6, PAPER, 0.7);
const e = ease(prog);
if (from !== to) { drawTicks(from, 1 - e); }
drawTicks(to, from !== to ? e : 1);
const bs: Ball[] = [];
for (let i = 0; i < N; i += 1) { bs.push(bubbleAt(i)); }
const order = bs.map(function (_b: Ball, i: number): number { return i; }).sort(function (a: number, b: number): number { return bs[b].r - bs[a].r; });
for (const i of order) { orb(bs[i].x, bs[i].y, bs[i].r, TILES[i % 8], 0.86); }
for (const i of order) { if (bs[i].r >= 11) { text(NAMES[i], bs[i].x, bs[i].y + 0.5, INK, 1, 10, 700, 'center'); } }
// 범례 — 대표 원 세 개의 반지름도 같은 rOf 로 그린다
const top = curTop();
const sizes = legendSizes(top);
tag('크기', LEGEND_X, 92, INK, PAPER, 10, 'center');
let y = 106;
for (const s of sizes) {
const r = rOf(s, top);
ring(LEGEND_X, y + r, r, 2, INK, 0.9);
text(fmt(s, niceStep(s, 2)), LEGEND_X, y + r, INK, 1, 9, 700, 'center');
y += r * 2 + 8;
}
}
function statusText(): string {
return '가로 눈금 {a} · 세로 눈금 {b}'.replace('{a}', fmt(axX[to].step, axX[to].step)).replace('{b}', fmt(axY[to].step, axY[to].step));
}
function hits(): Hit[] {
const bs: Ball[] = [];
for (let i = 0; i < N; i += 1) { bs.push(bubbleAt(i)); }
return bs.map(function (b: Ball, i: number): Hit {
const x = blend(sets[from].xs[i], sets[to].xs[i]);
const y = blend(sets[from].ys[i], sets[to].ys[i]);
return ballHit(b, '{n} 가로 {x} · 세로 {y} · 크기 {s}'.replace('{n}', NAMES[i]).replace('{x}', fmt(x, axX[to].step / 10)).replace('{y}', fmt(y, axY[to].step / 10)).replace('{s}', String(Math.round(b.v))));
});
}
// 직접 고르면 다음 자료로 바꾼다
function onAct(_i: number): void { goTo(to + 1); }
function onTake(): void { return; }
fitCanvas();
if (still) { showRest(); } else { play(); }
return function (): void {
stopLoop();
off.abort();
};
}, []);
return (
<div className={cx("vj") + " is-demo"} ref={rootRef}>
<div className={cx("vj__pad")} data-role="pad" tabIndex={0} role="application" aria-label={'버블 차트 시연 무대 — 방향키로 거품 이동, Enter 로 고르기, P 로 일시정지, N 으로 한 걸음, R 로 다시'}>
<canvas className={cx("vj__canvas")} data-role="canvas" width={480} height={300} role="img" aria-label={'거품 열네 개를 가로·세로 눈금 위에 찍고 크기는 오른쪽 범례의 대표 원 세 개로 읽는다. 자료가 세 번 바뀔 때마다 눈금 간격을 1·2·5 에 10의 거듭제곱을 곱한 값으로 다시 골라 축 끝이 깔끔한 수로 늘어나고, 거품과 눈금이 한 번에 새 자리로 옮겨 가며 범례 원의 값도 함께 바뀐다'}></canvas>
</div>
<p className={cx("vj__status")} data-role="status" aria-live="off">{'버블 차트 시연'}</p>
<div className={cx("vj__ctrl")}>
<button className={cx("vj__pause")} data-role="pause" type="button" aria-pressed="false">{'일시정지'}</button>
<button className={cx("vj__step")} data-role="step" type="button">{'한 걸음'}</button>
</div>
<p className={cx("vj__done")} data-role="done" role="status" aria-live="polite"></p>
</div>
);
}03 Ticks for the Three Values of X, Y and Size — Measured area 29.922% · moving frames 19/23Original by GODRICH · SCSS and React ship in the zip · Bubble Chart: 9 Canvas Scenes
The post this demo lives in
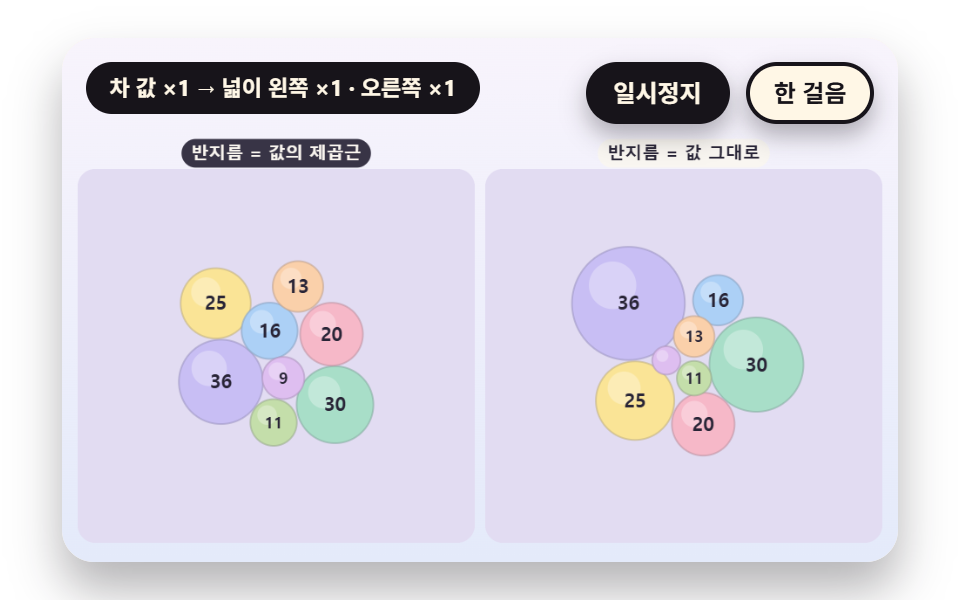 Bubble Chart: 9 Canvas ScenesHow does a bubble chart turn one row of data into a circle? 01 uses the square root of the value as radius, 02 pushes ov See all demos in this post
If you like this effect - similar demos
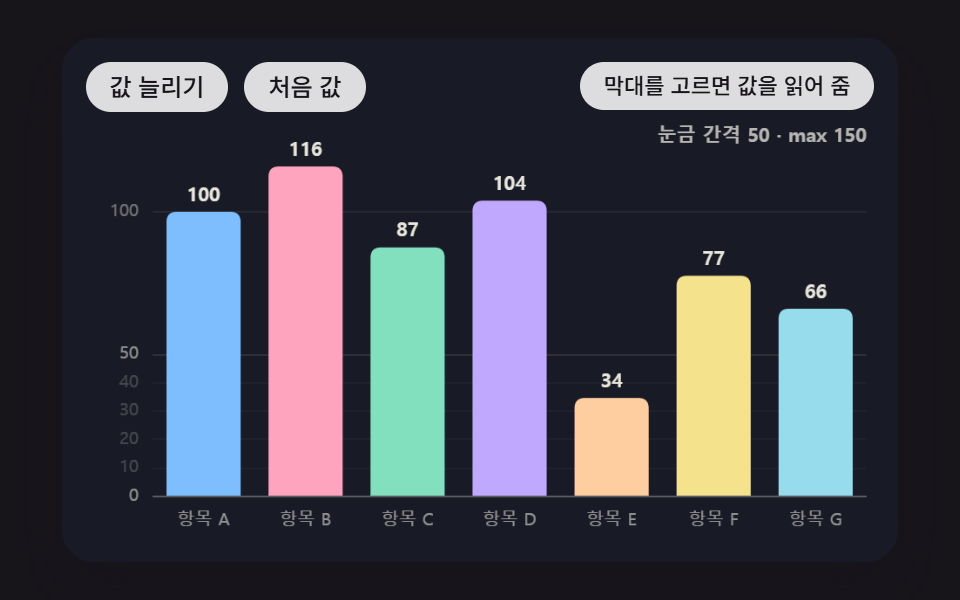 Dashboard UI05 An Axis That Re-Picks 1-2-5 Ticks and Shrinks Along With the BarsBar Chart Animation: 9 Demos From Spring to Race
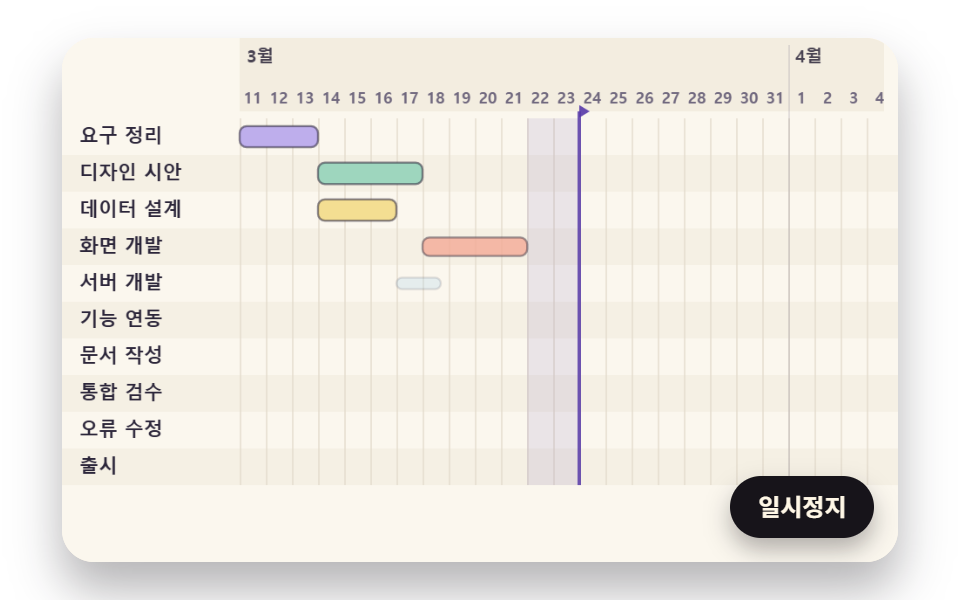 Dashboard UI03 The Longest Path, Lit by a Forward and Backward Sweep for Zero SlackGantt Chart JavaScript: 9 Self-Scheduling Views
 Dashboard UI03 Drag a range and the summary recountsChart UI Design: 9 Interactions You Can Drag