05Boxplot Drawing Quartiles as a Box and Whiskers
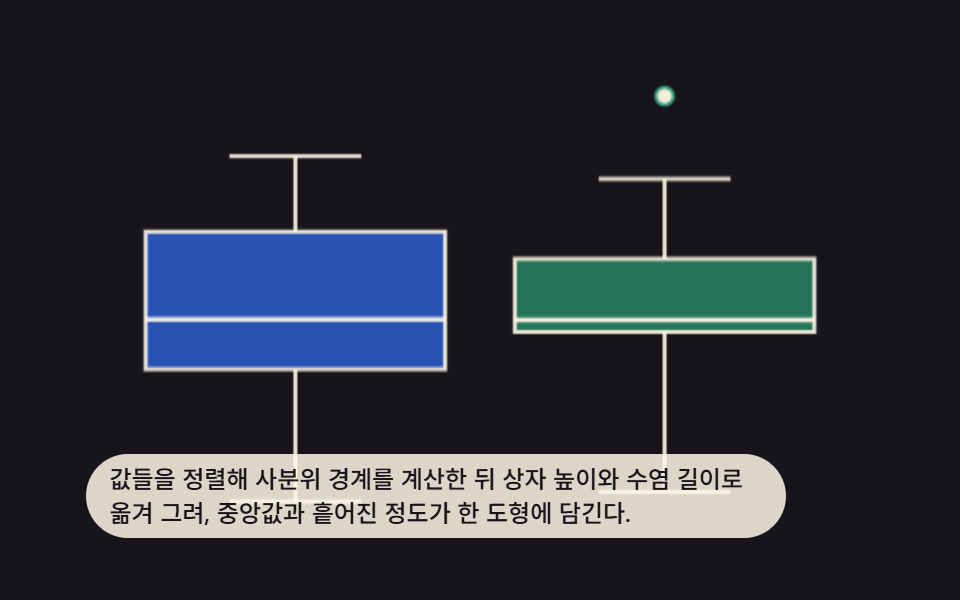
Values are sorted to compute the quartile boundaries, then mapped into the box height and whisker length, so the median and spread live in one shape.
Best forResponse-time distribution comparison by group
GROUP_A_1quartileslerpStats
<main class="stage">
<div class="bxw is-demo" id="bxwRoot">
  <canvas class="bxw__canvas" id="bxwCanvas" width="480" height="300"></canvas>
  <p class="bxw__caption">Sort the values to work out the quartile boundaries, then translate them into box height and whisker length, so the median and how spread out the data is come together in one shape.</p>
</div>
</main>
@use "../../../../site/static/demo-tokens" as *;
@include stage($stage-ink);
.bxw {
position: relative;
width: min(92vw, calc(160vh - 12.8vw));
aspect-ratio: 480 / 300;
margin: 0 auto;
border-radius: $r-card;
overflow: hidden;
box-shadow: $shadow-raised;
background: $stage-ink;
}
.bxw__canvas {
display: block;
width: 100%;
height: 100%;
}
.bxw__caption {
position: absolute;
left: $sp-3;
bottom: $sp-3;
max-width: 78%;
margin: 0;
padding: $sp-1 $sp-3;
border-radius: $r-pill;
background: rgba(255, 247, 230, .85);
color: $subject-ink;
font-weight: 500;
font-size: 12px;
line-height: 1.4;
pointer-events: none;
}
@media (max-width: 340px) {
.bxw__caption { font-size: 10px; padding: $sp-1 $sp-2; }
}
@media (prefers-reduced-motion: reduce) {
.bxw { cursor: default; }
}html, body {
margin: 0;
overflow: hidden;
}
.stage {
box-sizing: border-box;
min-height: 100vh;
display: grid;
place-items: center;
margin: 0;
background: #17141a;
font-family: -apple-system, "Segoe UI", "Noto Sans KR", sans-serif;
padding: clamp(8px, 4vw, 24px);
}
.bxw {
position: relative;
width: min(92vw, 160vh - 12.8vw);
aspect-ratio: 480/300;
margin: 0 auto;
border-radius: 16px;
overflow: hidden;
box-shadow: 0 14px 24px rgba(23, 20, 26, 0.32);
background: #17141a;
}
.bxw__canvas {
display: block;
width: 100%;
height: 100%;
}
.bxw__caption {
position: absolute;
left: 12px;
bottom: 12px;
max-width: 78%;
margin: 0;
padding: 4px 12px;
border-radius: 999px;
background: rgba(255, 247, 230, 0.85);
color: #17141a;
font-weight: 500;
font-size: 12px;
line-height: 1.4;
pointer-events: none;
}
@media (max-width: 340px) {
.bxw__caption {
font-size: 10px;
padding: 4px 8px;
}
}
@media (prefers-reduced-motion: reduce) {
.bxw {
cursor: default;
}
}(function () {
// 기법: 두 그룹 각각에 표본 집합을 두 벌씩 두고 사분위(최소·1사분위·중앙값·3사분위·최대)를
// 미리 계산해둔다. 매 프레임 삼각파(0→1→0)로 두 표본 집합의 사분위 값을 요소별로 보간해
// 그 프레임의 상자·수염 좌표를 다시 계산해서 그린다 — 정적인 두 장을 겹쳐 페이드하는 것이
// 아니라 통계값 자체가 시간에 따라 움직인다.
var root = document.getElementById('bxwRoot');
var canvas = document.getElementById('bxwCanvas');
var ctx = canvas.getContext('2d');
var wrap = canvas.parentElement;
function seedRand(seed) {
var s = seed >>> 0;
return function () { s = (s * 1664525 + 1013904223) >>> 0; return s / 4294967296; };
}
var CALC_W = 480, CALC_H = 300;
var LOOP_MS = 800;
var T0 = 200;
function clamp(v, a, b) { return Math.max(a, Math.min(b, v)); }
var rand = seedRand(425051);
function sample(n) {
var out = [];
for (var i = 0; i < n; i += 1) out.push(20 + rand() * 80);
return out;
}
var GROUP_A_1 = sample(9), GROUP_A_2 = sample(9);
var GROUP_B_1 = sample(9), GROUP_B_2 = sample(9);
function quartiles(arr) {
var s = arr.slice().sort(function (a, b) { return a - b; });
function pct(p) {
var idx = (s.length - 1) * p, lo = Math.floor(idx), hi = Math.ceil(idx);
return s[lo] + (s[hi] - s[lo]) * (idx - lo);
}
return { min: s[0], q1: pct(0.25), med: pct(0.5), q3: pct(0.75), max: s[s.length - 1] };
}
var qA1 = quartiles(GROUP_A_1), qA2 = quartiles(GROUP_A_2);
var qB1 = quartiles(GROUP_B_1), qB2 = quartiles(GROUP_B_2);
function lerp(x0, x1, f) { return x0 + (x1 - x0) * f; }
function lerpStats(s1, s2, f) {
return {
min: lerp(s1.min, s2.min, f),
q1: lerp(s1.q1, s2.q1, f),
med: lerp(s1.med, s2.med, f),
q3: lerp(s1.q3, s2.q3, f),
max: lerp(s1.max, s2.max, f)
};
}
var DOMAIN_MIN = 10, DOMAIN_MAX = 115;
var PLOT_TOP = 22, PLOT_BOTTOM = 292;
function valueToY(v) {
var f = (v - DOMAIN_MIN) / (DOMAIN_MAX - DOMAIN_MIN);
return PLOT_BOTTOM - f * (PLOT_BOTTOM - PLOT_TOP);
}
var BOX_FILL = ['47,109,246', '43,157,116'];
var CREAM_LINE = '255,247,230';
var BOX_WIDTH = 172;
var GROUP_X = [134, 346];
var OUTLIER_MULT = 1.2;
function drawBox(cx, stats, fillRgb, sx, sy, showOutlier) {
var yMin = valueToY(stats.min), yQ1 = valueToY(stats.q1);
var yMed = valueToY(stats.med), yQ3 = valueToY(stats.q3), yMax = valueToY(stats.max);
var xLeft = cx - BOX_WIDTH / 2;
var capHalf = BOX_WIDTH * 0.22;
ctx.strokeStyle = 'rgba(' + CREAM_LINE + ',.9)';
ctx.lineWidth = 2;
ctx.beginPath();
ctx.moveTo(cx * sx, yMax * sy); ctx.lineTo(cx * sx, yQ3 * sy); ctx.stroke();
ctx.beginPath();
ctx.moveTo(cx * sx, yQ1 * sy); ctx.lineTo(cx * sx, yMin * sy); ctx.stroke();
ctx.beginPath();
ctx.moveTo((cx - capHalf) * sx, yMax * sy); ctx.lineTo((cx + capHalf) * sx, yMax * sy); ctx.stroke();
ctx.beginPath();
ctx.moveTo((cx - capHalf) * sx, yMin * sy); ctx.lineTo((cx + capHalf) * sx, yMin * sy); ctx.stroke();
ctx.fillStyle = 'rgba(' + fillRgb + ',.7)';
ctx.fillRect(xLeft * sx, yQ3 * sy, BOX_WIDTH * sx, (yQ1 - yQ3) * sy);
ctx.strokeStyle = 'rgba(' + CREAM_LINE + ',.9)';
ctx.strokeRect(xLeft * sx, yQ3 * sy, BOX_WIDTH * sx, (yQ1 - yQ3) * sy);
ctx.beginPath();
ctx.moveTo(xLeft * sx, yMed * sy);
ctx.lineTo((xLeft + BOX_WIDTH) * sx, yMed * sy);
ctx.lineWidth = 2.4;
ctx.stroke();
if (showOutlier) {
var yOut = valueToY(stats.max * OUTLIER_MULT);
ctx.beginPath();
ctx.fillStyle = 'rgba(' + CREAM_LINE + ',.95)';
ctx.arc(cx * sx, yOut * sy, 4.4, 0, Math.PI * 2);
ctx.fill();
ctx.strokeStyle = 'rgba(' + fillRgb + ',.95)';
ctx.lineWidth = 1.6;
ctx.stroke();
}
}
var cw = 480, ch = 300;
function draw(phase) {
var sx = cw / CALC_W, sy = ch / CALC_H;
ctx.clearRect(0, 0, cw, ch);
var t = Math.max(0, phase - T0);
var half = (LOOP_MS - T0) / 2;
var blend = t < half ? t / half : 2 - t / half;
blend = clamp(blend, 0, 1);
var statsA = lerpStats(qA1, qA2, blend);
var statsB = lerpStats(qB1, qB2, blend);
drawBox(GROUP_X[0], statsA, BOX_FILL[0], sx, sy, blend > 0.62);
drawBox(GROUP_X[1], statsB, BOX_FILL[1], sx, sy, blend < 0.38);
}
var reduce = window.matchMedia('(prefers-reduced-motion: reduce)').matches;
var elapsed = 0;
if (reduce) root.classList.remove('is-demo');
function phaseOf(ms) { return reduce ? LOOP_MS * 0.5 : (ms % LOOP_MS); }
function fit() {
var r = wrap.getBoundingClientRect();
cw = Math.max(1, Math.round(r.width));
ch = Math.max(1, Math.round(r.height));
canvas.width = cw; canvas.height = ch;
draw(phaseOf(elapsed));
}
var lastTs = null;
function tick(ts) {
if (lastTs === null) lastTs = ts;
var dt = Math.min(ts - lastTs, 48);
lastTs = ts;
if (!reduce) elapsed += dt;
draw(phaseOf(elapsed));
requestAnimationFrame(tick);
}
fit();
window.addEventListener('resize', fit);
draw(phaseOf(elapsed));
requestAnimationFrame(tick);
})();import { useEffect, useRef } from "react";
import styles from "./ChartAdvancedBoxplotQuartileWhisker.module.scss";
type Stats = { min: number; q1: number; med: number; q3: number; max: number };
export default function ChartAdvancedBoxplotQuartileWhisker() {
const rootRef = useRef<HTMLDivElement>(null);
const canvasRef = useRef<HTMLCanvasElement>(null);
useEffect(() => {
const root = rootRef.current;
const canvas = canvasRef.current;
if (!root || !canvas) return;
const ctx = canvas.getContext("2d");
if (!ctx) return;
const wrap = canvas.parentElement as HTMLElement;
function seedRand(seed: number) {
let s = seed >>> 0;
return function () { s = (s * 1664525 + 1013904223) >>> 0; return s / 4294967296; };
}
const CALC_W = 480, CALC_H = 300;
const LOOP_MS = 800;
const T0 = 200;
function clamp(v: number, a: number, b: number) { return Math.max(a, Math.min(b, v)); }
const rand = seedRand(425051);
function sample(n: number) {
const out: number[] = [];
for (let i = 0; i < n; i += 1) out.push(20 + rand() * 80);
return out;
}
const GROUP_A_1 = sample(9), GROUP_A_2 = sample(9);
const GROUP_B_1 = sample(9), GROUP_B_2 = sample(9);
function quartiles(arr: number[]): Stats {
const s = arr.slice().sort(function (a, b) { return a - b; });
function pct(p: number) {
const idx = (s.length - 1) * p, lo = Math.floor(idx), hi = Math.ceil(idx);
return s[lo] + (s[hi] - s[lo]) * (idx - lo);
}
return { min: s[0], q1: pct(0.25), med: pct(0.5), q3: pct(0.75), max: s[s.length - 1] };
}
const qA1 = quartiles(GROUP_A_1), qA2 = quartiles(GROUP_A_2);
const qB1 = quartiles(GROUP_B_1), qB2 = quartiles(GROUP_B_2);
function lerp(x0: number, x1: number, f: number) { return x0 + (x1 - x0) * f; }
function lerpStats(s1: Stats, s2: Stats, f: number): Stats {
return {
min: lerp(s1.min, s2.min, f),
q1: lerp(s1.q1, s2.q1, f),
med: lerp(s1.med, s2.med, f),
q3: lerp(s1.q3, s2.q3, f),
max: lerp(s1.max, s2.max, f)
};
}
const DOMAIN_MIN = 10, DOMAIN_MAX = 115;
const PLOT_TOP = 22, PLOT_BOTTOM = 292;
function valueToY(v: number) {
const f = (v - DOMAIN_MIN) / (DOMAIN_MAX - DOMAIN_MIN);
return PLOT_BOTTOM - f * (PLOT_BOTTOM - PLOT_TOP);
}
const BOX_FILL = ["47,109,246", "43,157,116"];
const CREAM_LINE = "255,247,230";
const BOX_WIDTH = 172;
const GROUP_X = [134, 346];
const OUTLIER_MULT = 1.2;
let cw = 480, ch = 300;
function drawBox(cx: number, stats: Stats, fillRgb: string, sx: number, sy: number, showOutlier: boolean) {
const yMin = valueToY(stats.min), yQ1 = valueToY(stats.q1);
const yMed = valueToY(stats.med), yQ3 = valueToY(stats.q3), yMax = valueToY(stats.max);
const xLeft = cx - BOX_WIDTH / 2;
const capHalf = BOX_WIDTH * 0.22;
ctx!.strokeStyle = "rgba(" + CREAM_LINE + ",.9)";
ctx!.lineWidth = 2;
ctx!.beginPath();
ctx!.moveTo(cx * sx, yMax * sy); ctx!.lineTo(cx * sx, yQ3 * sy); ctx!.stroke();
ctx!.beginPath();
ctx!.moveTo(cx * sx, yQ1 * sy); ctx!.lineTo(cx * sx, yMin * sy); ctx!.stroke();
ctx!.beginPath();
ctx!.moveTo((cx - capHalf) * sx, yMax * sy); ctx!.lineTo((cx + capHalf) * sx, yMax * sy); ctx!.stroke();
ctx!.beginPath();
ctx!.moveTo((cx - capHalf) * sx, yMin * sy); ctx!.lineTo((cx + capHalf) * sx, yMin * sy); ctx!.stroke();
ctx!.fillStyle = "rgba(" + fillRgb + ",.7)";
ctx!.fillRect(xLeft * sx, yQ3 * sy, BOX_WIDTH * sx, (yQ1 - yQ3) * sy);
ctx!.strokeStyle = "rgba(" + CREAM_LINE + ",.9)";
ctx!.strokeRect(xLeft * sx, yQ3 * sy, BOX_WIDTH * sx, (yQ1 - yQ3) * sy);
ctx!.beginPath();
ctx!.moveTo(xLeft * sx, yMed * sy);
ctx!.lineTo((xLeft + BOX_WIDTH) * sx, yMed * sy);
ctx!.lineWidth = 2.4;
ctx!.stroke();
if (showOutlier) {
const yOut = valueToY(stats.max * OUTLIER_MULT);
ctx!.beginPath();
ctx!.fillStyle = "rgba(" + CREAM_LINE + ",.95)";
ctx!.arc(cx * sx, yOut * sy, 4.4, 0, Math.PI * 2);
ctx!.fill();
ctx!.strokeStyle = "rgba(" + fillRgb + ",.95)";
ctx!.lineWidth = 1.6;
ctx!.stroke();
}
}
function draw(phase: number) {
const sx = cw / CALC_W, sy = ch / CALC_H;
ctx!.clearRect(0, 0, cw, ch);
const t = Math.max(0, phase - T0);
const half = (LOOP_MS - T0) / 2;
let blend = t < half ? t / half : 2 - t / half;
blend = clamp(blend, 0, 1);
const statsA = lerpStats(qA1, qA2, blend);
const statsB = lerpStats(qB1, qB2, blend);
drawBox(GROUP_X[0], statsA, BOX_FILL[0], sx, sy, blend > 0.62);
drawBox(GROUP_X[1], statsB, BOX_FILL[1], sx, sy, blend < 0.38);
}
const reduce = window.matchMedia("(prefers-reduced-motion: reduce)").matches;
let elapsed = 0;
if (reduce) root.classList.remove("is-demo");
function phaseOf(ms: number) { return reduce ? LOOP_MS * 0.5 : (ms % LOOP_MS); }
function fit() {
const r = wrap.getBoundingClientRect();
cw = Math.max(1, Math.round(r.width));
ch = Math.max(1, Math.round(r.height));
canvas!.width = cw; canvas!.height = ch;
draw(phaseOf(elapsed));
}
let lastTs: number | null = null;
let raf = 0;
function tick(ts: number) {
if (lastTs === null) lastTs = ts;
const dt = Math.min(ts - lastTs, 48);
lastTs = ts;
if (!reduce) elapsed += dt;
draw(phaseOf(elapsed));
raf = requestAnimationFrame(tick);
}
fit();
window.addEventListener("resize", fit);
draw(phaseOf(elapsed));
raf = requestAnimationFrame(tick);
return () => {
cancelAnimationFrame(raf);
window.removeEventListener("resize", fit);
};
}, []);
return (
<main className={styles.stage}>
<div className={`${styles.bxw} is-demo`} ref={rootRef}>
<canvas className={styles.bxw__canvas} ref={canvasRef} width={480} height={300} />
<p className={styles.bxw__caption}>값들을 정렬해 사분위 경계를 계산한 뒤 상자 높이와 수염 길이로 옮겨 그려, 중앙값과 흩어진 정도가 한 도형에 담긴다.</p>
</div>
</main>
);
}05 Boxplot Drawing Quartiles as a Box and Whiskers — Measured area 12.065% · moving frames 20/23Original by GODRICH · SCSS and React ship in the zip · 9 Data Visualization Chart Types With Real Math
The post this demo lives in
 9 Data Visualization Chart Types With Real MathA data visualization chart types set built from real math, not screenshots. Three of the nine flow like ribbons, three b See all demos in this post
If you like this effect - similar demos
 Dashboard UI03 Drag a range and the summary recountsChart UI Design: 9 Interactions You Can Drag
 Dashboard UI03 A 3D Pie Chart That Tilts the Disc and Draws Its Side WallPie Chart CSS: 9 Slices That Pop, Tilt and Morph
 Dashboard UI05 An Axis That Re-Picks 1-2-5 Ticks and Shrinks Along With the BarsBar Chart Animation: 9 Demos From Spring to Race