SVG Path Animation: 9 Line Drawing Scenes
SVG path animation is gap arithmetic. A drawn line is the math of pushing a dashed stroke's gap — 01 measures the ring circumference to fill it by percent
SVG line drawing is not a picture but the math of pushing the gap in a dashed stroke with stroke-dashoffset: an svg path animation starts by deciding how much gap to pull and how fast
 01 ld-ring-progress-length
 02 ld-logo-signature-sequence
 03 ld-map-route-getpointatlength
 04 ld-scroll-progress-offset
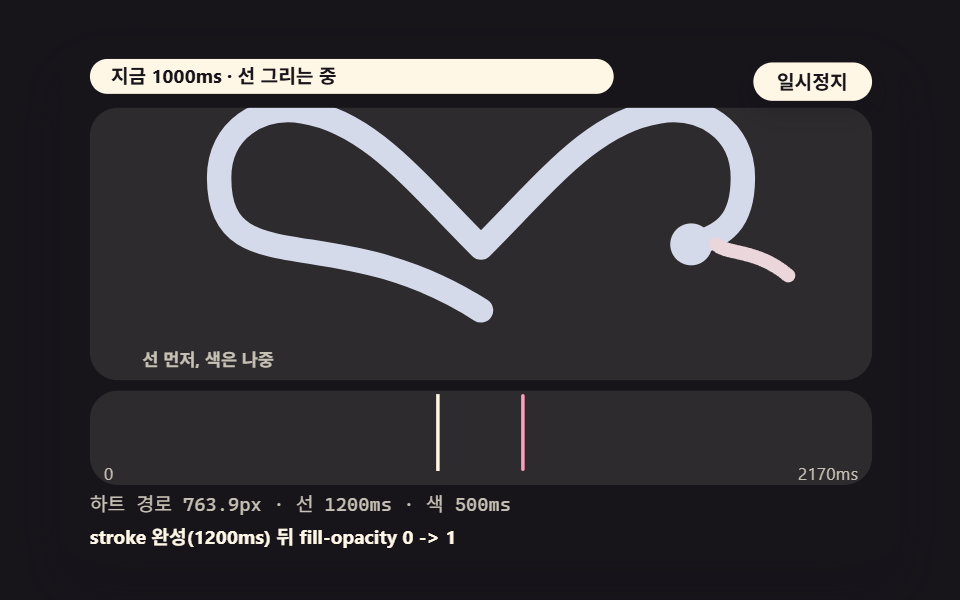 05 ld-heart-illustration-fill
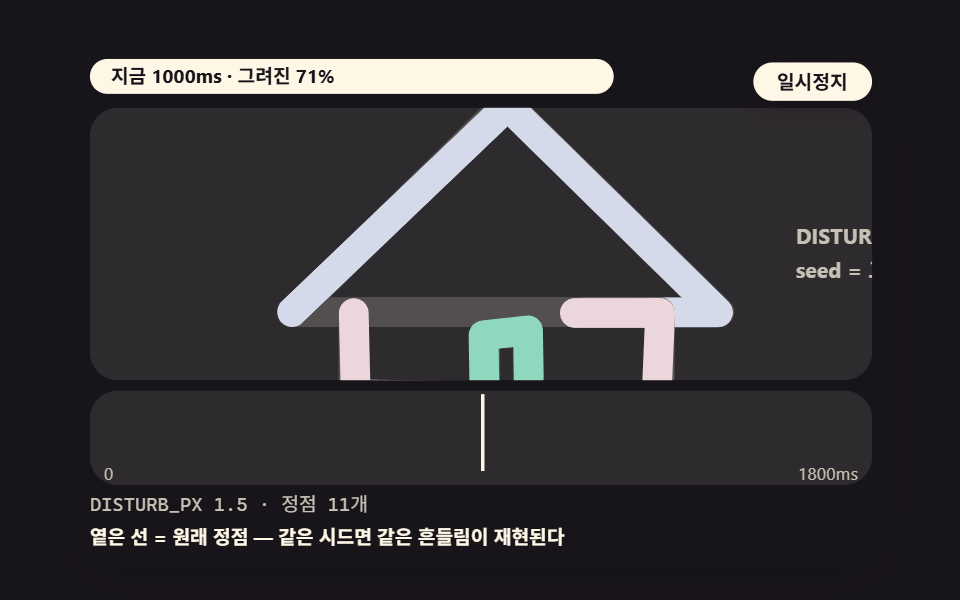 06 ld-handdrawn-disturbance
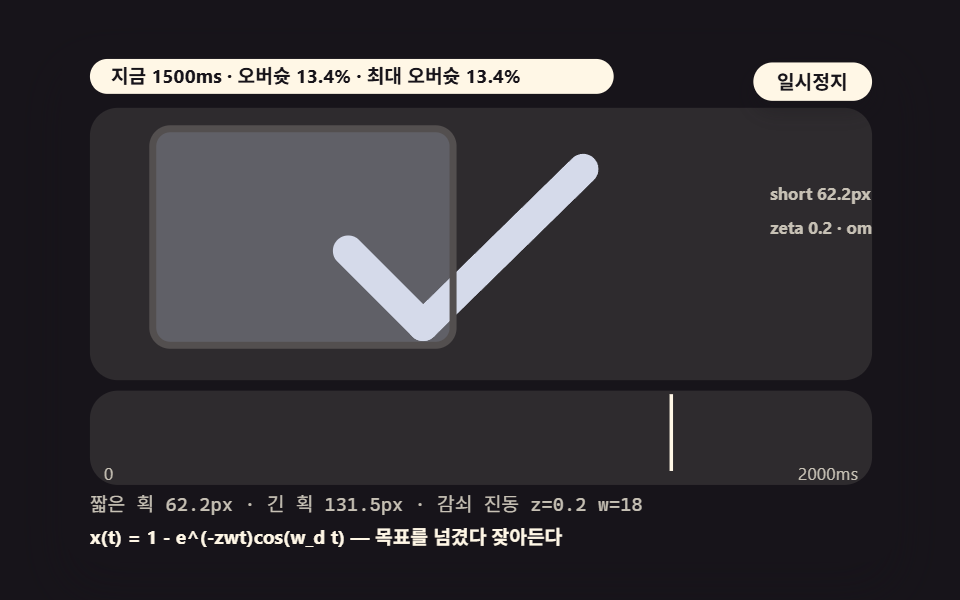 07 ld-checkmark-spring
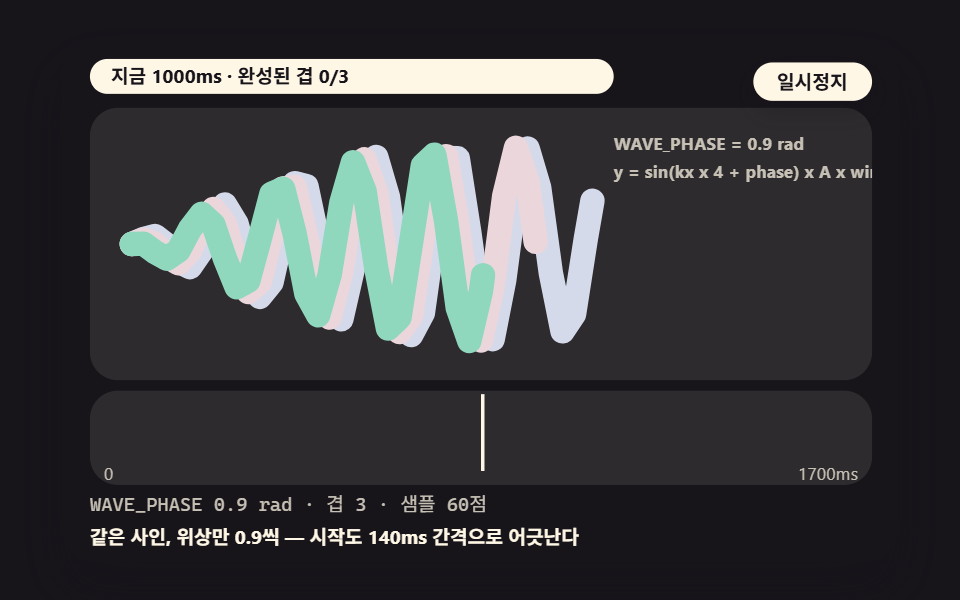 08 ld-wave-phased-layers
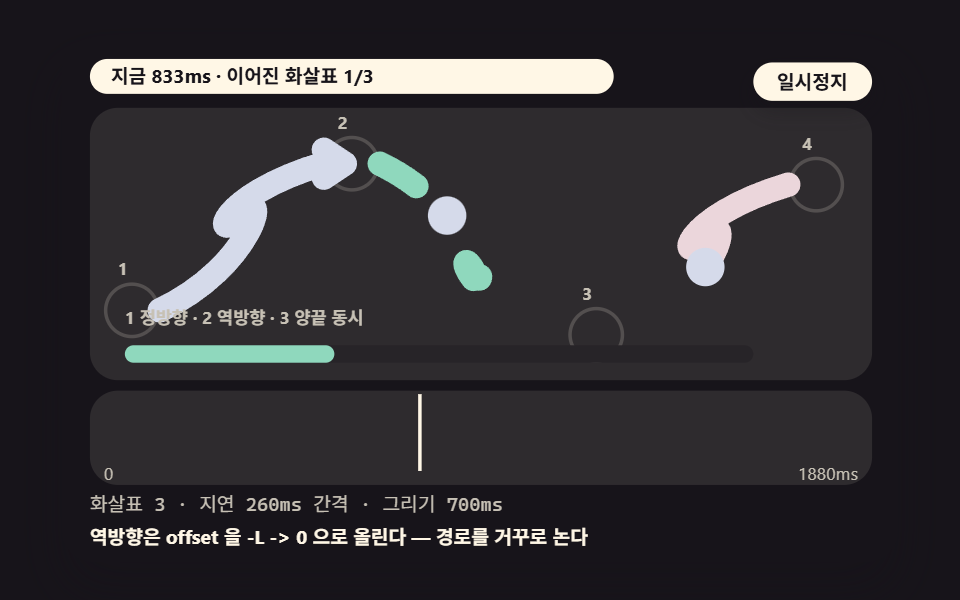 09 ld-diagram-arrow-relay
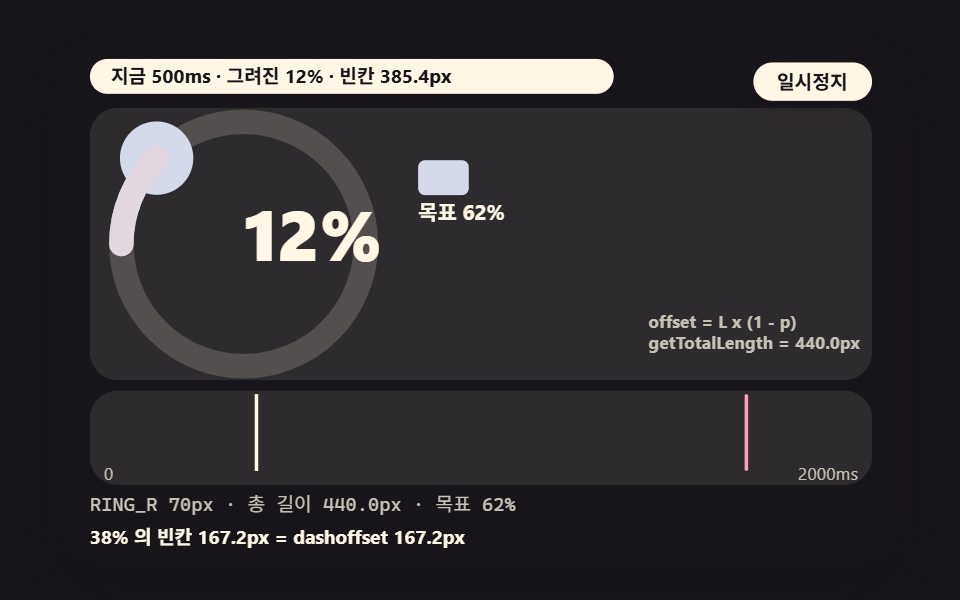
- 01 A Ring Chart That Measures Its Circumference and Fills by Percent
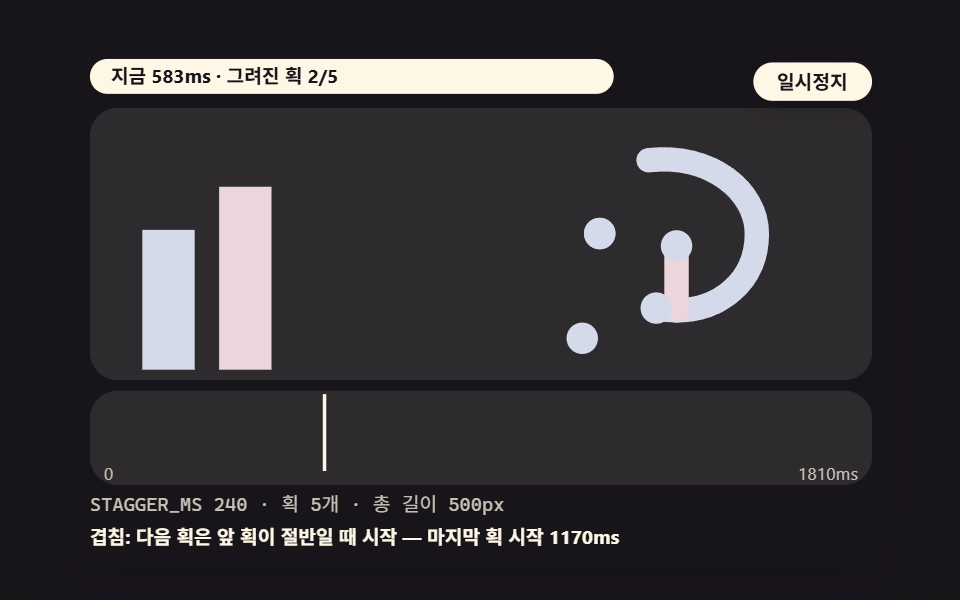
- 02 A Logo Signature Drawn Stroke by Stroke in Order
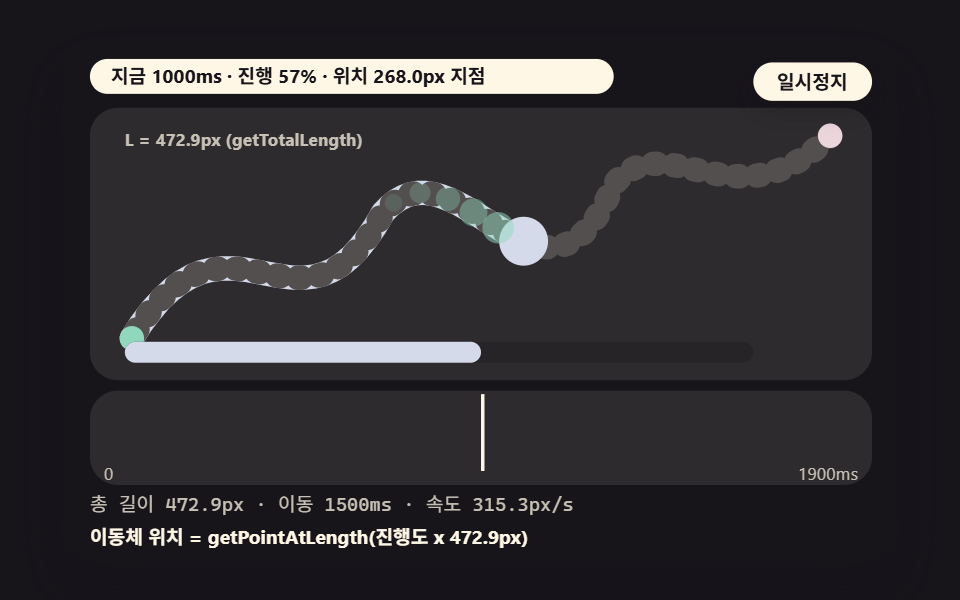
- 03 A Map Route With a Traveler Following the Path
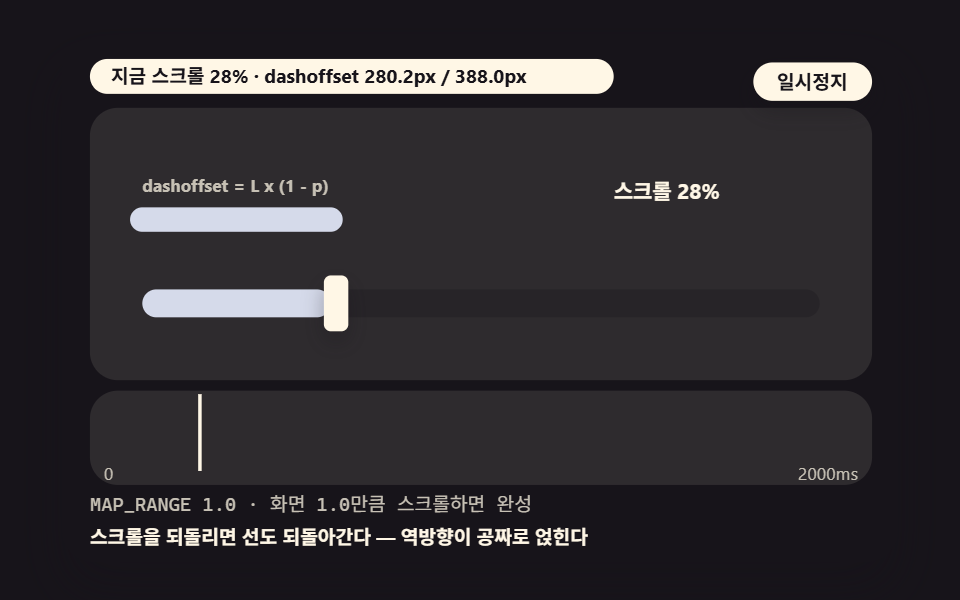
- 04 A Progress Line That Turns the Scroll Percent Into Offset Math
- 05 A Heart Drawn Closed Then Filled With Color
- 06 A Hand-Drawn Wobble Slipping at Every Vertex
- 07 A Check Mark Whose Short Path Springs In
- 08 Three Wave Lines Layering by Computed Phase
- 09 Diagram Arrows Connecting in a Relay
The shared stage keeps the geometry fixed. The inner box stays at 480×300 and scales down as a whole to fit the screen width, the scene SVG sits in a 448×156 viewBox, and below it come a 448×54 chart box and two read lines. A single CSS animation .clk serves as the clock, and when one cycle ends the scene moves to the next preset.
Nothing outside the browser takes part: no libraries, WebGL, CDNs or external images, and no Math.random, Date, fetch or localStorage — so every replay produces the same scene. The wobble in 06 and the phase values in 08 come from the fixed seed hash frac(sin(i×12.9898+seed×78.233)×43758.5453).
Presets change with the arrow keys. Scene 01 cycles its target through 62, 38 and 85%; scene 02 steps STAGGER_MS through 240, 600 and 120; scene 04 switches MAP_RANGE between 1.0 and 0.5; scene 06 walks DISTURB_PX through 1.5, 4 and 0.5; and scene 08 turns WAVE_PHASE through 0.9, 1.8 and 0.45 rad, while scenes 03, 05, 07 and 09 loop a single configuration.
Nine line drawing scenes — a ring chart fill, a sequential logo signature, a map route traveler, a scroll progress line, a heart illustration, a hand-drawn wobble, a check mark, three phased waves and diagram arrows
Which numbers are measured and which are modeled
The nature of every quoted value comes first. Path lengths, positions and engine delays are measurements the browser made by actually flattening the path (getTotalLength, getPointAtLength, getComputedTiming). The damped oscillation formula in 07, the sine generator in 08 and the progress conversion in 04 are models the screen evaluates and displays.
The render environment was headless Chromium 145.0.7632.6, with the 480×300 stage captured as 24 frames over 2 seconds and motion judged on the 23 deltas between neighboring frames. Accumulated area is the share of pixels that differ from the first frame at least once across the series, mean intensity is the average color distance of those pixels on a 0 to 255 scale, and moving frames counts the frames that differ from the one right before.
| Scene | Accumulated area | Moving frames | Mean intensity |
|---|---|---|---|
| 01 Ring chart | 11.2% | 23/23 | 131.7 |
| 02 Logo signature | 14.8% | 23/23 | 128.3 |
| 03 Map route | 11.7% | 23/23 | 100.5 |
| 04 Scroll progress line | 11.5% | 23/23 | 146.2 |
| 05 Heart illustration | 10.0% | 23/23 | 142.4 |
| 06 Hand-drawn wobble | 10.0% | 23/23 | 88.3 |
| 07 Check spring | 14.9% | 23/23 | 81.2 |
| 08 Three phased waves | 17.8% | 23/23 | 117.0 |
| 09 Diagram arrows | 10.1% | 23/23 | 125.7 |
Read the table this way. The widest accumulated area is 08 at 17.8% and the narrowest are 05 and 06 at 10.0%, the highest mean intensity is 04 at 146.2 and the lowest is 07 at 81.2, and every one of the nine scenes moved in all 23 delta frames.
What was not confirmed also goes on record. The both-ends drawing in 09 is standard behavior under the SVG specification, but its rendering across browsers was checked only in headless Chromium; the layer lengths in 08 come out differently per phase, so no single figure is quoted for them.
01A Ring Chart That Measures Its Circumference and Fills by Percent
Demo and Explanation
Drawing the circumference as two half-circle A commands and measuring it with getTotalLength returns 440.9px, within 0.25% of the theoretical 2π×70 = 439.8. Setting dasharray to that value and lowering dashoffset as 440.9×(1−p) fills the ring to a 62% target and leaves a gap of 38%, or 167.2px, while the same progress spreads into a thick arc face at stroke-width 34, a fill bar beside the ring and a tip dot whose coordinates come from getPointAtLength — one calculation driving four expressions.
<main class="stage">
<div class="ez is-demo" id="ez">
  <div class="ez__in" data-role="inner">
    <div class="ez__pad" data-role="pad" tabindex="0" role="application" aria-label="Demo stage: Space or Enter pauses, R restarts, left and right arrows pick another value">
      <div class="ez__scene" data-role="scene" role="img" aria-label="A ring chart measures its circumference and fills to a target percent while the bar beside it fills with the same value"></div>
      <div class="ez__probe" data-role="probe" aria-hidden="true"></div>
      <div class="ez__chart" data-role="chart" aria-hidden="true"></div>
      <p class="ez__status" data-role="status" aria-live="off">Scene ready</p>
      <p class="ez__reada" data-role="reada" aria-hidden="true"></p>
      <p class="ez__readb" data-role="readb" aria-hidden="true"></p>
      <div class="ez__ctrl">
        <button class="ez__pause" data-role="pause" type="button" aria-pressed="false">Pause</button>
… (총 18줄 — 아래 「전체 코드」에서 원문 전체)
@use "../../../../site/static/demo-tokens" as *;
@include stage($stage-ink);
// SVG 선 그리기 장면 공통 — 먹 무대 위 파스텔 스트로크. 파스텔 변형값(BD26): vivid 토큰 직용 금지
$panel: mix($subject-cream, $subject-ink, 10%);
$grid: mix($subject-cream, $subject-ink, 7%);
$line: mix($subject-cream, $subject-ink, 26%);
$dim: mix($subject-cream, $subject-ink, 76%);
// 파스텔 스트로크 팔레트 — vivid 토큰(채도 .55+) 대신 이 값들을 쓴다 (BD26)
$stroke-blue: #d5daea; // $subject-blue 의 파스텔
$stroke-rose: #ebd6db; // 핑크 계열 파스텔
… (총 312줄 — 아래 「전체 코드」에서 원문 전체)html, body {
margin: 0;
overflow: hidden;
}
.stage {
box-sizing: border-box;
min-height: 100vh;
display: grid;
place-items: center;
margin: 0;
background: #17141a;
… (총 437줄 — 아래 「전체 코드」에서 원문 전체)(function () {
const rootEl = document.getElementById("ez");
if (!rootEl) return;
main(rootEl);
function cx(s) { return s; }
function main(root) {
// 무대 좌표 — 안쪽 상자는 늘 480x300 이고 화면 폭에 맞춰 통째로 줄인다
const W = 480;
const CX0 = 8;
const CW = 432;
const SVGW = 448;
const SVGH = 156;
… (총 421줄 — 아래 「전체 코드」에서 원문 전체)// RingLength - 같은 항목 vanilla index.html 의 React 판. 같은 계산을 useEffect 안에서 돌린다
import { useEffect, useRef } from "react";
import styles from "./RingLength.module.scss";
const cx = (s: string): string => s.split(" ").map((n) => styles[n] ?? n).join(" ");
function main(root: HTMLElement): () => void {
// 무대 좌표 — 안쪽 상자는 늘 480x300 이고 화면 폭에 맞춰 통째로 줄인다
const W = 480;
const CX0 = 8;
const CW = 432;
const SVGW = 448;
… (총 409줄 — 아래 「전체 코드」에서 원문 전체)01 · A Ring Chart That Measures Its Circumference and Fills by Percent — Measured area 11.215% · moving frames 23/23Original by GODRICH · SCSS and React ship in the zip · See the password
Where to Look in the Code
The frame function below shows the stem that pours a single p into the ring, the arc face, the number and the bar.
    function frame(t) {
        const total = OPEN_MS + DRAW_MS + HOLD_MS;
        const p = clamp((t - OPEN_MS) / DRAW_MS, 0, 1) * (curPct / 100);
        if (ringP && ringBg) {
            setDraw(ringP, curLen, p);
        }
        if (pieP) {
            // the same progress as a thick arc face — spreading the accumulated area (the same computed value, enlarged)
            pieP.setAttribute('stroke-width', '34');
            pieP.setAttribute('opacity', '0.65');
            setDraw(pieP, curLen, p * 0.999);
        }
        const shown = Math.round(p * 100);
        if (bigTxt && shown !== pctShown) {
            bigTxt.textContent = f0(shown) + '%';
            pctShown = shown;
        }
02A Logo Signature Drawn Stroke by Stroke in Order
Demo and Explanation
The logo splits into five stroke-level paths totaling 500px, and each stroke receives a duration proportional to its own length on the BASE_DUR 900 base, so a short stroke finishes early. The next stroke's start is pushed out by the larger of half the previous duration and STAGGER_MS 240, and this overlap — the next stroke entering while the previous one is half drawn — is what makes it read as a signature.
<main class="stage">
<div class="ez is-demo" id="ez">
  <div class="ez__in" data-role="inner">
    <div class="ez__pad" data-role="pad" tabindex="0" role="application" aria-label="Demo stage: Space or Enter pauses, R restarts, left and right arrows pick another value">
      <div class="ez__scene" data-role="scene" role="img" aria-label="Five strokes of an abstract logo enter in turn, each with a duration set to its own length and a fixed gap"></div>
      <div class="ez__probe" data-role="probe" aria-hidden="true"></div>
      <div class="ez__chart" data-role="chart" aria-hidden="true"></div>
      <p class="ez__status" data-role="status" aria-live="off">Scene ready</p>
      <p class="ez__reada" data-role="reada" aria-hidden="true"></p>
      <p class="ez__readb" data-role="readb" aria-hidden="true"></p>
      <div class="ez__ctrl">
        <button class="ez__pause" data-role="pause" type="button" aria-pressed="false">Pause</button>
… (총 18줄 — 아래 「전체 코드」에서 원문 전체)
@use "../../../../site/static/demo-tokens" as *;
@include stage($stage-ink);
// SVG 선 그리기 장면 공통 — 먹 무대 위 파스텔 스트로크. 파스텔 변형값(BD26): vivid 토큰 직용 금지
$panel: mix($subject-cream, $subject-ink, 10%);
$grid: mix($subject-cream, $subject-ink, 7%);
$line: mix($subject-cream, $subject-ink, 26%);
$dim: mix($subject-cream, $subject-ink, 76%);
// 파스텔 스트로크 팔레트 — vivid 토큰(채도 .55+) 대신 이 값들을 쓴다 (BD26)
$stroke-blue: #d5daea; // $subject-blue 의 파스텔
$stroke-rose: #ebd6db; // 핑크 계열 파스텔
… (총 312줄 — 아래 「전체 코드」에서 원문 전체)html, body {
margin: 0;
overflow: hidden;
}
.stage {
box-sizing: border-box;
min-height: 100vh;
display: grid;
place-items: center;
margin: 0;
background: #17141a;
… (총 437줄 — 아래 「전체 코드」에서 원문 전체)(function () {
const rootEl = document.getElementById("ez");
if (!rootEl) return;
main(rootEl);
function cx(s) { return s; }
function main(root) {
// 무대 좌표 — 안쪽 상자는 늘 480x300 이고 화면 폭에 맞춰 통째로 줄인다
const W = 480;
const CX0 = 8;
const CW = 432;
const SVGW = 448;
const SVGH = 156;
… (총 423줄 — 아래 「전체 코드」에서 원문 전체)// SignatureSequence - 같은 항목 vanilla index.html 의 React 판. 같은 계산을 useEffect 안에서 돌린다
import { useEffect, useRef } from "react";
import styles from "./SignatureSequence.module.scss";
const cx = (s: string): string => s.split(" ").map((n) => styles[n] ?? n).join(" ");
function main(root: HTMLElement): () => void {
// 무대 좌표 — 안쪽 상자는 늘 480x300 이고 화면 폭에 맞춰 통째로 줄인다
const W = 480;
const CX0 = 8;
const CW = 432;
const SVGW = 448;
… (총 417줄 — 아래 「전체 코드」에서 원문 전체)02 · A Logo Signature Drawn Stroke by Stroke in Order — Measured area 14.774% · moving frames 23/23Original by GODRICH · SCSS and React ship in the zip · See the password
Where to Look in the Code
The measured overlap is read back from getComputedTiming on the path.animate call.
        for (let s = 0; s < paths.length; s += 1) {
            const dur = Math.round(BASE_DUR * lens[s] / lenMax);
            const a = paths[s].animate([{ strokeDashoffset: lens[s] }, { strokeDashoffset: 0 }], { duration: dur, delay: Math.round(t0), fill: 'both', easing: 'ease-in-out' });
            animPaths.push({ a: a, p: paths[s], delay: Math.round(t0), dur: dur, k: s });
            spans.push({ s: Math.round(t0), e: Math.round(t0) + dur, k: s % 5 });
            // a dot that follows the stroke tip — the same progress makes the dot position
            const dot = svgEl('circle', 'dot dot--trav', svg);
            dot.setAttribute('r', '9');
            tipDots.push(dot);
            // left gauge — the stroke progress becomes the bar height as is (the same math, spread)
            const g = svgEl('rect', 'gauge gauge--' + s, svg);
            g.setAttribute('x', String(30 + s * 44));
            g.setAttribute('y', '150');
            g.setAttribute('width', '30');
            g.setAttribute('height', '0');
            gauges.push(g);
            t0 += Math.max(curStagger, dur / 2);
        }
03A Map Route With a Traveler Following the Path
Demo and Explanation
The map route — four chained beziers — measures 472.9px in total, and the traveler moves to the getPointAtLength(p×L) coordinate every frame, covering the route at 315.3px per second across 1500ms. The five ghost dots sit at points 0.035 behind the traveler in progress, and the dashed overlay holds its dashoffset at −p×L so the dashes stream in the traveler's direction.
<main class="stage">
<div class="ez is-demo" id="ez">
  <div class="ez__in" data-role="inner">
    <div class="ez__pad" data-role="pad" tabindex="0" role="application" aria-label="Demo stage: Space or Enter pauses, R restarts, left and right arrows pick another value">
      <div class="ez__scene" data-role="scene" role="img" aria-label="A curved route draws from its start while a traveler follows by computing its position on the path every moment"></div>
      <div class="ez__probe" data-role="probe" aria-hidden="true"></div>
      <div class="ez__chart" data-role="chart" aria-hidden="true"></div>
      <p class="ez__status" data-role="status" aria-live="off">Scene ready</p>
      <p class="ez__reada" data-role="reada" aria-hidden="true"></p>
      <p class="ez__readb" data-role="readb" aria-hidden="true"></p>
      <div class="ez__ctrl">
        <button class="ez__pause" data-role="pause" type="button" aria-pressed="false">Pause</button>
… (총 18줄 — 아래 「전체 코드」에서 원문 전체)
@use "../../../../site/static/demo-tokens" as *;
@include stage($stage-ink);
// SVG 선 그리기 장면 공통 — 먹 무대 위 파스텔 스트로크. 파스텔 변형값(BD26): vivid 토큰 직용 금지
$panel: mix($subject-cream, $subject-ink, 10%);
$grid: mix($subject-cream, $subject-ink, 7%);
$line: mix($subject-cream, $subject-ink, 26%);
$dim: mix($subject-cream, $subject-ink, 76%);
// 파스텔 스트로크 팔레트 — vivid 토큰(채도 .55+) 대신 이 값들을 쓴다 (BD26)
$stroke-blue: #d5daea; // $subject-blue 의 파스텔
$stroke-rose: #ebd6db; // 핑크 계열 파스텔
… (총 312줄 — 아래 「전체 코드」에서 원문 전체)html, body {
margin: 0;
overflow: hidden;
}
.stage {
box-sizing: border-box;
min-height: 100vh;
display: grid;
place-items: center;
margin: 0;
background: #17141a;
… (총 437줄 — 아래 「전체 코드」에서 원문 전체)(function () {
const rootEl = document.getElementById("ez");
if (!rootEl) return;
main(rootEl);
function cx(s) { return s; }
function main(root) {
// 무대 좌표 — 안쪽 상자는 늘 480x300 이고 화면 폭에 맞춰 통째로 줄인다
const W = 480;
const CX0 = 8;
const CW = 432;
const SVGW = 448;
const SVGH = 156;
… (총 407줄 — 아래 「전체 코드」에서 원문 전체)// MapTraveler - 같은 항목 vanilla index.html 의 React 판. 같은 계산을 useEffect 안에서 돌린다
import { useEffect, useRef } from "react";
import styles from "./MapTraveler.module.scss";
const cx = (s: string): string => s.split(" ").map((n) => styles[n] ?? n).join(" ");
function main(root: HTMLElement): () => void {
// 무대 좌표 — 안쪽 상자는 늘 480x300 이고 화면 폭에 맞춰 통째로 줄인다
const W = 480;
const CX0 = 8;
const CW = 432;
const SVGW = 448;
… (총 393줄 — 아래 「전체 코드」에서 원문 전체)03 · A Map Route With a Traveler Following the Path — Measured area 11.678% · moving frames 23/23Original by GODRICH · SCSS and React ship in the zip · See the password
Where to Look in the Code
One frame call moves the traveler, the ghosts and the dashes together.
    function frame(t) {
        const p = clamp((t - OPEN_MS) / TRAVEL_MS, 0, 1);
        if (routeP) {
            setDraw(routeP, routeLen, p);
        }
        if (progBar) {
            progBar.style.width = clamp(p, 0, 1) * 360 + 'px';
        }
        if (glowP) {
            glowP.setAttribute('stroke-dasharray', '2 10');
            glowP.setAttribute('stroke-dashoffset', String(-p * routeLen));
        }
        if (travP && routeLen > 0) {
            const at = pointAt(ROUTE, p * routeLen);
            travP.setAttribute('cx', f1(at.x));
            travP.setAttribute('cy', f1(at.y));
04A Progress Line That Turns the Scroll Percent Into Offset Math
Demo and Explanation
Progress p is wired straight in as dashoffset = 388×(1−p), so scrolling draws the line, and scrolling back un-draws it — the reverse direction rides along free in the arithmetic. The MAP_RANGE presets 1.0 and 0.5 adjust how much scroll the drawing consumes, the demo shakes the value as a 0→1→0 triangle wave with a 900ms half, and the scrub knob shares the same p.
<main class="stage">
<div class="ez is-demo" id="ez">
  <div class="ez__in" data-role="inner">
    <div class="ez__pad" data-role="pad" tabindex="0" role="application" aria-label="Demo stage: Space or Enter pauses, R restarts, left and right arrows pick another value">
      <div class="ez__scene" data-role="scene" role="img" aria-label="A knob standing for the scroll position moves both ways, and its value is exactly how much of the line is drawn"></div>
      <div class="ez__probe" data-role="probe" aria-hidden="true"></div>
      <div class="ez__chart" data-role="chart" aria-hidden="true"></div>
      <p class="ez__status" data-role="status" aria-live="off">Scene ready</p>
      <p class="ez__reada" data-role="reada" aria-hidden="true"></p>
      <p class="ez__readb" data-role="readb" aria-hidden="true"></p>
      <div class="ez__ctrl">
        <button class="ez__pause" data-role="pause" type="button" aria-pressed="false">Pause</button>
… (총 18줄 — 아래 「전체 코드」에서 원문 전체)
@use "../../../../site/static/demo-tokens" as *;
@include stage($stage-ink);
// SVG 선 그리기 장면 공통 — 먹 무대 위 파스텔 스트로크. 파스텔 변형값(BD26): vivid 토큰 직용 금지
$panel: mix($subject-cream, $subject-ink, 10%);
$grid: mix($subject-cream, $subject-ink, 7%);
$line: mix($subject-cream, $subject-ink, 26%);
$dim: mix($subject-cream, $subject-ink, 76%);
// 파스텔 스트로크 팔레트 — vivid 토큰(채도 .55+) 대신 이 값들을 쓴다 (BD26)
$stroke-blue: #d5daea; // $subject-blue 의 파스텔
$stroke-rose: #ebd6db; // 핑크 계열 파스텔
… (총 312줄 — 아래 「전체 코드」에서 원문 전체)html, body {
margin: 0;
overflow: hidden;
}
.stage {
box-sizing: border-box;
min-height: 100vh;
display: grid;
place-items: center;
margin: 0;
background: #17141a;
… (총 437줄 — 아래 「전체 코드」에서 원문 전체)(function () {
const rootEl = document.getElementById("ez");
if (!rootEl) return;
main(rootEl);
function cx(s) { return s; }
function main(root) {
// 무대 좌표 — 안쪽 상자는 늘 480x300 이고 화면 폭에 맞춰 통째로 줄인다
const W = 480;
const CX0 = 8;
const CW = 432;
const SVGW = 448;
const SVGH = 156;
… (총 389줄 — 아래 「전체 코드」에서 원문 전체)// ScrollProgress - 같은 항목 vanilla index.html 의 React 판. 같은 계산을 useEffect 안에서 돌린다
import { useEffect, useRef } from "react";
import styles from "./ScrollProgress.module.scss";
const cx = (s: string): string => s.split(" ").map((n) => styles[n] ?? n).join(" ");
function main(root: HTMLElement): () => void {
// 무대 좌표 — 안쪽 상자는 늘 480x300 이고 화면 폭에 맞춰 통째로 줄인다
const W = 480;
const CX0 = 8;
const CW = 432;
const SVGW = 448;
… (총 375줄 — 아래 「전체 코드」에서 원문 전체)04 · A Progress Line That Turns the Scroll Percent Into Offset Math — Measured area 11.494% · moving frames 23/23Original by GODRICH · SCSS and React ship in the zip · See the password
Where to Look in the Code
apply() fans the same p out across the line, the fill bar and the knob.
    function apply(p) {
        if (lineP) {
            setDraw(lineP, lineLen, p);
        }
        if (fillBar) {
            fillBar.style.width = clamp(p, 0, 1) * 388 + 'px';
        }
        if (scrubKnob) {
            scrubKnob.style.left = 30 + clamp(p, 0, 1) * 374 + 'px';
        }
    }
05A Heart Drawn Closed Then Filled With Color
Demo and Explanation
The closed heart path of 763.9px draws over 0 to 1200ms, and after a 120ms rest the fill-opacity rises from 0.12 to 0.9×0.9 around the 1320ms mark, laying the color layer over the stroke layer. The partner heart repeats the same calculation at a smaller size from 900ms, which is 0.75× the stroke time, and while the line draws, a getPointAtLength dot rides the tip and hides once the fill stage begins.
<main class="stage">
<div class="ez is-demo" id="ez">
  <div class="ez__in" data-role="inner">
    <div class="ez__pad" data-role="pad" tabindex="0" role="application" aria-label="Demo stage: Space or Enter pauses, R restarts, left and right arrows pick another value">
      <div class="ez__scene" data-role="scene" role="img" aria-label="A closed heart completes first as a stroke and then fills with color, an illustration finished in two stages"></div>
      <div class="ez__probe" data-role="probe" aria-hidden="true"></div>
      <div class="ez__chart" data-role="chart" aria-hidden="true"></div>
      <p class="ez__status" data-role="status" aria-live="off">Scene ready</p>
      <p class="ez__reada" data-role="reada" aria-hidden="true"></p>
      <p class="ez__readb" data-role="readb" aria-hidden="true"></p>
      <div class="ez__ctrl">
        <button class="ez__pause" data-role="pause" type="button" aria-pressed="false">Pause</button>
… (총 18줄 — 아래 「전체 코드」에서 원문 전체)
@use "../../../../site/static/demo-tokens" as *;
@include stage($stage-ink);
// SVG 선 그리기 장면 공통 — 먹 무대 위 파스텔 스트로크. 파스텔 변형값(BD26): vivid 토큰 직용 금지
$panel: mix($subject-cream, $subject-ink, 10%);
$grid: mix($subject-cream, $subject-ink, 7%);
$line: mix($subject-cream, $subject-ink, 26%);
$dim: mix($subject-cream, $subject-ink, 76%);
// 파스텔 스트로크 팔레트 — vivid 토큰(채도 .55+) 대신 이 값들을 쓴다 (BD26)
$stroke-blue: #d5daea; // $subject-blue 의 파스텔
$stroke-rose: #ebd6db; // 핑크 계열 파스텔
… (총 312줄 — 아래 「전체 코드」에서 원문 전체)html, body {
margin: 0;
overflow: hidden;
}
.stage {
box-sizing: border-box;
min-height: 100vh;
display: grid;
place-items: center;
margin: 0;
background: #17141a;
… (총 437줄 — 아래 「전체 코드」에서 원문 전체)(function () {
const rootEl = document.getElementById("ez");
if (!rootEl) return;
main(rootEl);
function cx(s) { return s; }
function main(root) {
// 무대 좌표 — 안쪽 상자는 늘 480x300 이고 화면 폭에 맞춰 통째로 줄인다
const W = 480;
const CX0 = 8;
const CW = 432;
const SVGW = 448;
const SVGH = 156;
… (총 402줄 — 아래 「전체 코드」에서 원문 전체)// HeartFill - 같은 항목 vanilla index.html 의 React 판. 같은 계산을 useEffect 안에서 돌린다
import { useEffect, useRef } from "react";
import styles from "./HeartFill.module.scss";
const cx = (s: string): string => s.split(" ").map((n) => styles[n] ?? n).join(" ");
function main(root: HTMLElement): () => void {
// 무대 좌표 — 안쪽 상자는 늘 480x300 이고 화면 폭에 맞춰 통째로 줄인다
const W = 480;
const CX0 = 8;
const CW = 432;
const SVGW = 448;
… (총 395줄 — 아래 「전체 코드」에서 원문 전체)05 · A Heart Drawn Closed Then Filled With Color — Measured area 10.001% · moving frames 23/23Original by GODRICH · SCSS and React ship in the zip · See the password
Where to Look in the Code
The frame function lays the stroke, the rest and the color on one timetable.
    function frame(t) {
        const p = clamp(t / STROKE_MS, 0, 1);
        if (heartP) {
            setDraw(heartP, heartLen, p);
            // the fill is a cut — fill-opacity steps up in a single frame (the poster catches this moment)
            const fo = t >= STROKE_MS + GAP_MS + FILL_MS * 0.8 ? 1 : t >= STROKE_MS + GAP_MS ? 0.12 : 0;
            heartP.setAttribute('fill-opacity', String(fo * 0.9));
            if (heartDot) {
                // the dot follows the tip only while drawing — hidden during the fill stage
                if (t < STROKE_MS) {
                    const at = pointAt(HEART, p * heartLen);
                    heartDot.setAttribute('cx', f1(at.x));
                    heartDot.setAttribute('cy', f1(at.y));
                    heartDot.setAttribute('opacity', '1');
                }
06A Hand-Drawn Wobble Slipping at Every Vertex
Demo and Explanation
Each of the eleven vertices — three for the roof, four for the body and four for the door — gets a seeded-hash offset within ±DISTURB_PX 1.5, re-added every frame as the path is rebuilt. The same seed reproduces the same wobble, so a replay never becomes a different scribble; the same hash rides the 36 grid points of the wobble field, and the wobbled path is re-measured with getTotalLength at every step of the progress.
<main class="stage">
<div class="ez is-demo" id="ez">
  <div class="ez__in" data-role="inner">
    <div class="ez__pad" data-role="pad" tabindex="0" role="application" aria-label="Demo stage: Space or Enter pauses, R restarts, left and right arrows pick another value">
      <div class="ez__scene" data-role="scene" role="img" aria-label="Every vertex of a house gets its seeded slip re-added each moment, a line gone over twice by hand"></div>
      <div class="ez__probe" data-role="probe" aria-hidden="true"></div>
      <div class="ez__chart" data-role="chart" aria-hidden="true"></div>
      <p class="ez__status" data-role="status" aria-live="off">Scene ready</p>
      <p class="ez__reada" data-role="reada" aria-hidden="true"></p>
      <p class="ez__readb" data-role="readb" aria-hidden="true"></p>
      <div class="ez__ctrl">
        <button class="ez__pause" data-role="pause" type="button" aria-pressed="false">Pause</button>
… (총 18줄 — 아래 「전체 코드」에서 원문 전체)
@use "../../../../site/static/demo-tokens" as *;
@include stage($stage-ink);
// SVG 선 그리기 장면 공통 — 먹 무대 위 파스텔 스트로크. 파스텔 변형값(BD26): vivid 토큰 직용 금지
$panel: mix($subject-cream, $subject-ink, 10%);
$grid: mix($subject-cream, $subject-ink, 7%);
$line: mix($subject-cream, $subject-ink, 26%);
$dim: mix($subject-cream, $subject-ink, 76%);
// 파스텔 스트로크 팔레트 — vivid 토큰(채도 .55+) 대신 이 값들을 쓴다 (BD26)
$stroke-blue: #d5daea; // $subject-blue 의 파스텔
$stroke-rose: #ebd6db; // 핑크 계열 파스텔
… (총 312줄 — 아래 「전체 코드」에서 원문 전체)html, body {
margin: 0;
overflow: hidden;
}
.stage {
box-sizing: border-box;
min-height: 100vh;
display: grid;
place-items: center;
margin: 0;
background: #17141a;
… (총 437줄 — 아래 「전체 코드」에서 원문 전체)(function () {
const rootEl = document.getElementById("ez");
if (!rootEl) return;
main(rootEl);
function cx(s) { return s; }
function main(root) {
// 무대 좌표 — 안쪽 상자는 늘 480x300 이고 화면 폭에 맞춰 통째로 줄인다
const W = 480;
const CX0 = 8;
const CW = 432;
const SVGW = 448;
const SVGH = 156;
… (총 409줄 — 아래 「전체 코드」에서 원문 전체)// HanddrawnDisturb - 같은 항목 vanilla index.html 의 React 판. 같은 계산을 useEffect 안에서 돌린다
import { useEffect, useRef } from "react";
import styles from "./HanddrawnDisturb.module.scss";
const cx = (s: string): string => s.split(" ").map((n) => styles[n] ?? n).join(" ");
function main(root: HTMLElement): () => void {
// 무대 좌표 — 안쪽 상자는 늘 480x300 이고 화면 폭에 맞춰 통째로 줄인다
const W = 480;
const CX0 = 8;
const CW = 432;
const SVGW = 448;
… (총 403줄 — 아래 「전체 코드」에서 원문 전체)06 · A Hand-Drawn Wobble Slipping at Every Vertex — Measured area 9.957% · moving frames 23/23Original by GODRICH · SCSS and React ship in the zip · See the password
Where to Look in the Code
The two functions disturbPt and pathOf build all of the wobble.
    function disturbPt(pt, fi, vi, t) {
        // two seed hashes mixed into wobbles of different phases — the same seed reproduces the same wobble
        const h1 = seedHash(fi * 31 + vi, 3);
        const h2 = seedHash(fi * 31 + vi, 9);
        const ph = t * 0.004;
        return [pt[0] + Math.sin(ph + h1 * 6.283) * curDisturb, pt[1] + Math.cos(ph * 1.3 + h2 * 6.283) * curDisturb];
    }
    function pathOf(fig, fi, t) {
        const pts = fig.map(function (v, vi) { return disturbPt(v, fi, vi, t); });
        return 'M ' + pts.map(function (p) { return f1(p[0]) + ' ' + f1(p[1]); }).join(' L ') + ' Z';
    }
07A Check Mark Whose Short Path Springs In
Demo and Explanation
Driving the dashoffset with the damped oscillation x(t) = 1 − e^(−ζωt)·cos(ω_d·t) at ζ 0.20 and ω 18 rad/s gives ω_d 17.63, and the first-cycle overshoot of 43.5% lands on the theoretical peak of 43.7%. The short stroke of 62.2px rides p/0.3 and the long stroke of 131.1px rides (p−0.25)/0.75 on the same spring; the demo fires first at 200ms and repeats every 1200ms, and the overshoot spreads into the box border width and the background brightness as well.
<main class="stage">
<div class="ez is-demo" id="ez">
  <div class="ez__in" data-role="inner">
    <div class="ez__pad" data-role="pad" tabindex="0" role="application" aria-label="Demo stage: Space or Enter pauses, R restarts, left and right arrows pick another value">
      <div class="ez__scene" data-role="scene" role="img" aria-label="A check mark briefly overshoots its mark on a damped oscillation, then settles back into place"></div>
      <div class="ez__probe" data-role="probe" aria-hidden="true"></div>
      <div class="ez__chart" data-role="chart" aria-hidden="true"></div>
      <p class="ez__status" data-role="status" aria-live="off">Scene ready</p>
      <p class="ez__reada" data-role="reada" aria-hidden="true"></p>
      <p class="ez__readb" data-role="readb" aria-hidden="true"></p>
      <div class="ez__ctrl">
        <button class="ez__pause" data-role="pause" type="button" aria-pressed="false">Pause</button>
… (총 18줄 — 아래 「전체 코드」에서 원문 전체)
@use "../../../../site/static/demo-tokens" as *;
@include stage($stage-ink);
// SVG 선 그리기 장면 공통 — 먹 무대 위 파스텔 스트로크. 파스텔 변형값(BD26): vivid 토큰 직용 금지
$panel: mix($subject-cream, $subject-ink, 10%);
$grid: mix($subject-cream, $subject-ink, 7%);
$line: mix($subject-cream, $subject-ink, 26%);
$dim: mix($subject-cream, $subject-ink, 76%);
// 파스텔 스트로크 팔레트 — vivid 토큰(채도 .55+) 대신 이 값들을 쓴다 (BD26)
$stroke-blue: #d5daea; // $subject-blue 의 파스텔
$stroke-rose: #ebd6db; // 핑크 계열 파스텔
… (총 312줄 — 아래 「전체 코드」에서 원문 전체)html, body {
margin: 0;
overflow: hidden;
}
.stage {
box-sizing: border-box;
min-height: 100vh;
display: grid;
place-items: center;
margin: 0;
background: #17141a;
… (총 437줄 — 아래 「전체 코드」에서 원문 전체)(function () {
const rootEl = document.getElementById("ez");
if (!rootEl) return;
main(rootEl);
function cx(s) { return s; }
function main(root) {
// 무대 좌표 — 안쪽 상자는 늘 480x300 이고 화면 폭에 맞춰 통째로 줄인다
const W = 480;
const CX0 = 8;
const CW = 432;
const SVGW = 448;
const SVGH = 156;
… (총 419줄 — 아래 「전체 코드」에서 원문 전체)// CheckSpring - 같은 항목 vanilla index.html 의 React 판. 같은 계산을 useEffect 안에서 돌린다
import { useEffect, useRef } from "react";
import styles from "./CheckSpring.module.scss";
const cx = (s: string): string => s.split(" ").map((n) => styles[n] ?? n).join(" ");
function main(root: HTMLElement): () => void {
// 무대 좌표 — 안쪽 상자는 늘 480x300 이고 화면 폭에 맞춰 통째로 줄인다
const W = 480;
const CX0 = 8;
const CW = 432;
const SVGW = 448;
… (총 408줄 — 아래 「전체 코드」에서 원문 전체)07 · A Check Mark Whose Short Path Springs In — Measured area 14.885% · moving frames 23/23Original by GODRICH · SCSS and React ship in the zip · See the password
Where to Look in the Code
The single dampedOsc line pushes past the target and settles back.
    const dampedOsc = function (tms) {
        // x(t) = 1 - e^(-z w t) cos(w_d t) — passes the target of 1 and returns, t in seconds
        const t = tms / 1000;
        const wd = OMEGA * Math.sqrt(1 - ZETA * ZETA);
        return 1 - Math.exp(-ZETA * OMEGA * t) * Math.cos(wd * t);
    };
        if (shP && loP) {
            // the short stroke draws first (0 to 0.3) and the long one follows (0.25 to 1) — the same spring rides the progress
            setDraw(shP, shLen, clamp(p / 0.3, 0, 1.2));
            setDraw(loP, loLen, clamp((p - 0.25) / 0.75, 0, 1.2));
            if (boxEl) {
                boxEl.setAttribute('aria-checked', p > 0.5 ? 'true' : 'false');
                // the overshoot spreads into the box border width and the background brightness (the same math)
                boxEl.style.borderWidth = f1(3 + Math.abs(p - 1) * 10) + 'px';
                boxEl.style.background = 'rgba(213, 218, 234, ' + f1(clamp(p, 0, 1) * 0.28) + ')';
            }
        }
08Three Wave Lines Layering by Computed Phase
Demo and Explanation
The same sine curve becomes three paths with phases offset k×WAVE_PHASE 0.9 rad apart, and each layer starts drawing at a different moment, 120ms + k×140ms apart. The window function y = 78 + sin(0.144x + phase) × 56 × sin(π·s/60) brings both ends down to zero so the tails hold still, and because each path is a 60-point polyline, the measured length per layer differs slightly with the phase.
<main class="stage">
<div class="ez is-demo" id="ez">
  <div class="ez__in" data-role="inner">
    <div class="ez__pad" data-role="pad" tabindex="0" role="application" aria-label="Demo stage: Space or Enter pauses, R restarts, left and right arrows pick another value">
      <div class="ez__scene" data-role="scene" role="img" aria-label="Three sine layers offset only in phase draw one after another at staggered moments and layer elegantly"></div>
      <div class="ez__probe" data-role="probe" aria-hidden="true"></div>
      <div class="ez__chart" data-role="chart" aria-hidden="true"></div>
      <p class="ez__status" data-role="status" aria-live="off">Scene ready</p>
      <p class="ez__reada" data-role="reada" aria-hidden="true"></p>
      <p class="ez__readb" data-role="readb" aria-hidden="true"></p>
      <div class="ez__ctrl">
        <button class="ez__pause" data-role="pause" type="button" aria-pressed="false">Pause</button>
… (총 18줄 — 아래 「전체 코드」에서 원문 전체)
@use "../../../../site/static/demo-tokens" as *;
@include stage($stage-ink);
// SVG 선 그리기 장면 공통 — 먹 무대 위 파스텔 스트로크. 파스텔 변형값(BD26): vivid 토큰 직용 금지
$panel: mix($subject-cream, $subject-ink, 10%);
$grid: mix($subject-cream, $subject-ink, 7%);
$line: mix($subject-cream, $subject-ink, 26%);
$dim: mix($subject-cream, $subject-ink, 76%);
// 파스텔 스트로크 팔레트 — vivid 토큰(채도 .55+) 대신 이 값들을 쓴다 (BD26)
$stroke-blue: #d5daea; // $subject-blue 의 파스텔
$stroke-rose: #ebd6db; // 핑크 계열 파스텔
… (총 312줄 — 아래 「전체 코드」에서 원문 전체)html, body {
margin: 0;
overflow: hidden;
}
.stage {
box-sizing: border-box;
min-height: 100vh;
display: grid;
place-items: center;
margin: 0;
background: #17141a;
… (총 437줄 — 아래 「전체 코드」에서 원문 전체)(function () {
const rootEl = document.getElementById("ez");
if (!rootEl) return;
main(rootEl);
function cx(s) { return s; }
function main(root) {
// 무대 좌표 — 안쪽 상자는 늘 480x300 이고 화면 폭에 맞춰 통째로 줄인다
const W = 480;
const CX0 = 8;
const CW = 432;
const SVGW = 448;
const SVGH = 156;
… (총 388줄 — 아래 「전체 코드」에서 원문 전체)// WavePhased - 같은 항목 vanilla index.html 의 React 판. 같은 계산을 useEffect 안에서 돌린다
import { useEffect, useRef } from "react";
import styles from "./WavePhased.module.scss";
const cx = (s: string): string => s.split(" ").map((n) => styles[n] ?? n).join(" ");
function main(root: HTMLElement): () => void {
// 무대 좌표 — 안쪽 상자는 늘 480x300 이고 화면 폭에 맞춰 통째로 줄인다
const W = 480;
const CX0 = 8;
const CW = 432;
const SVGW = 448;
… (총 380줄 — 아래 「전체 코드」에서 원문 전체)08 · Three Wave Lines Layering by Computed Phase — Measured area 17.785% · moving frames 23/23Original by GODRICH · SCSS and React ship in the zip · See the password
Where to Look in the Code
The sinePath generator pulls the three layers out with only the phase changed.
    const sinePath = function (phase) {
        const pts = [];
        for (let s = 0; s <= SAMPLES; s += 1) {
            const x = 24 + s / SAMPLES * 400;
            const y = 78 + Math.sin(SINE_K * x * 4 + phase) * SINE_AMP * Math.sin(Math.PI * s / SAMPLES);
            pts.push(f1(x) + ' ' + f1(y));
        }
        return 'M ' + pts.join(' L ');
    };
09Diagram Arrows Connecting in a Relay
Demo and Explanation
Arrow one draws forward with its dashoffset running L→0, arrow two runs −L→0 so the path draws backward, and arrow three splits its dasharray into the four pieces grow (half−grow) grow L so both ends grow at the same speed and meet in the middle. The arrowheads follow over the last 15% after 85% of the body, the turns are set by relayDelay 260ms with DRAW_MS 700, and the bottom bar fills by the count of connected arrows out of three.
<main class="stage">
<div class="ez is-demo" id="ez">
  <div class="ez__in" data-role="inner">
    <div class="ez__pad" data-role="pad" tabindex="0" role="application" aria-label="Demo stage: Space or Enter pauses, R restarts, left and right arrows pick another value">
      <div class="ez__scene" data-role="scene" role="img" aria-label="Diagram arrows draw forward, backward and from both ends at once, connecting into one shape at the last"></div>
      <div class="ez__probe" data-role="probe" aria-hidden="true"></div>
      <div class="ez__chart" data-role="chart" aria-hidden="true"></div>
      <p class="ez__status" data-role="status" aria-live="off">Scene ready</p>
      <p class="ez__reada" data-role="reada" aria-hidden="true"></p>
      <p class="ez__readb" data-role="readb" aria-hidden="true"></p>
      <div class="ez__ctrl">
        <button class="ez__pause" data-role="pause" type="button" aria-pressed="false">Pause</button>
… (총 18줄 — 아래 「전체 코드」에서 원문 전체)
@use "../../../../site/static/demo-tokens" as *;
@include stage($stage-ink);
// SVG 선 그리기 장면 공통 — 먹 무대 위 파스텔 스트로크. 파스텔 변형값(BD26): vivid 토큰 직용 금지
$panel: mix($subject-cream, $subject-ink, 10%);
$grid: mix($subject-cream, $subject-ink, 7%);
$line: mix($subject-cream, $subject-ink, 26%);
$dim: mix($subject-cream, $subject-ink, 76%);
// 파스텔 스트로크 팔레트 — vivid 토큰(채도 .55+) 대신 이 값들을 쓴다 (BD26)
$stroke-blue: #d5daea; // $subject-blue 의 파스텔
$stroke-rose: #ebd6db; // 핑크 계열 파스텔
… (총 312줄 — 아래 「전체 코드」에서 원문 전체)html, body {
margin: 0;
overflow: hidden;
}
.stage {
box-sizing: border-box;
min-height: 100vh;
display: grid;
place-items: center;
margin: 0;
background: #17141a;
… (총 437줄 — 아래 「전체 코드」에서 원문 전체)(function () {
const rootEl = document.getElementById("ez");
if (!rootEl) return;
main(rootEl);
function cx(s) { return s; }
function main(root) {
// 무대 좌표 — 안쪽 상자는 늘 480x300 이고 화면 폭에 맞춰 통째로 줄인다
const W = 480;
const CX0 = 8;
const CW = 432;
const SVGW = 448;
const SVGH = 156;
… (총 467줄 — 아래 「전체 코드」에서 원문 전체)// ArrowRelay - 같은 항목 vanilla index.html 의 React 판. 같은 계산을 useEffect 안에서 돌린다
import { useEffect, useRef } from "react";
import styles from "./ArrowRelay.module.scss";
const cx = (s: string): string => s.split(" ").map((n) => styles[n] ?? n).join(" ");
function main(root: HTMLElement): () => void {
// 무대 좌표 — 안쪽 상자는 늘 480x300 이고 화면 폭에 맞춰 통째로 줄인다
const W = 480;
const CX0 = 8;
const CW = 432;
const SVGW = 448;
… (총 448줄 — 아래 「전체 코드」에서 원문 전체)09 · Diagram Arrows Connecting in a Relay — Measured area 10.083% · moving frames 23/23Original by GODRICH · SCSS and React ship in the zip · See the password
Where to Look in the Code
The three branches of mode in the frame function are the fork where one calculation turns three directions.
            let off;
            if (mode === 'rev') {
                // reverse: the offset runs from -L to 0 — the line grows from the end point toward the start
                off = -L + p * L;
                arrowPaths[a].setAttribute('stroke-dasharray', String(L));
                arrowPaths[a].setAttribute('stroke-dashoffset', String(off));
            }
            else if (mode === 'both') {
                // both ends at once: dasharray splits into two half-spaced pieces so the ends meet in the middle
                const half = L / 2;
                const grow = p * half;
                arrowPaths[a].setAttribute('stroke-dasharray', f1(grow) + ' ' + f1(half - grow) + ' ' + f1(grow) + ' ' + f1(L));
                arrowPaths[a].removeAttribute('stroke-dashoffset');
            }
How Many Values Does One Drawn Stroke Need — Total Length, dasharray, dashoffset and Duration
Length comes first. Every L used on screen is a value the browser measured — not one length is hard-coded in the source.
| Scene | Total length (L) | How it was measured |
|---|---|---|
| 01 Ring chart | 440.9px | getTotalLength, 0.25% off the theoretical 2π×70 = 439.8 |
| 02 Logo signature | five strokes, 500px together | getTotalLength per stroke |
| 03 Map route | 472.9px | getTotalLength |
| 04 Scroll progress line | 388px | getTotalLength on the straight horizontal line |
| 05 Heart | 763.9px | getTotalLength on the path closed with Z |
| 06 Hand-drawn wobble | changes every frame | re-measured on the wobbled path |
| 07 Check mark | 62.2px and 131.1px | each of the two strokes |
| 08 Three waves | differs per layer | getTotalLength on the 60-point polylines |
| 09 Diagram | each of the three arrows | getTotalLength at build time |
Durations and delays sit in a different seat per scene. Scene 01 divides its cycle into a 200ms opening, 1500ms of drawing and a 300ms hold; scene 05 splits into a 1200ms stroke, a 120ms rest and a 500ms fill; scene 07 fires at 200ms and repeats every 1200ms.
Scene 08 brings its three layers in at 120ms plus 140ms intervals, and scene 09 gives each arrow a 260ms turn with 700ms of drawing. The four values interlock like this — L is measured, dasharray equals L, dashoffset is L×(1−p), and p comes from a timetable (01, 05, 07, 08, 09), a sequence calculation (02) or an outside value such as the scroll (04).
Measure With getTotalLength, Set dasharray Equal to It and Bring dashoffset Down to 0 — the Order One Stroke Is Drawn In
Following this order makes a single stroke easy. Attach the path to the page, measure L with getTotalLength(), and set dasharray to L. Then build p from time, scroll or a sequence, write dashoffset as L×(1−p), and if needed lift a tip dot onto the line with getPointAtLength(p×L).
    // the drawing core: dasharray holds the total length and dashoffset comes down as length x (1 - p)
    function setDraw(p, total, p01) {
        p.setAttribute('stroke-dasharray', String(total));
        p.setAttribute('stroke-dashoffset', String(total * (1 - clamp(p01, 0, 1))));
    }
Why this pair of attributes. An SVG stroke uses dasharray to decide which stretches to paint and which to skip, and dashoffset to push that pattern along the path. With dasharray equal to L the skip becomes exactly the undrawn remainder, and bringing dashoffset down to 0 pushes the skip off the path so the line completes.
Any moment mid-drawing is therefore expressible as the single value L×(1−p), and the structure where the same p spreads into dot positions, bars and gauges follows from it naturally. For waving divider lines in the same palette, the divider wave collection is a sibling post.
What svg path animation css Covers Alone and Where JS Steps In — the Line Between transition and animation, and Which Side Scroll Drawing Falls On
The border is who builds p. A single stroke on a fixed timetable is CSS territory — moving stroke-dasharray and stroke-dashoffset through keyframes or a transition is enough for a one-shot flourish, and the loading spinner collection puts the same principle to work.
JS earns its place in three moments: when the path changes and the length must be re-measured on the spot (02, 06), when an outside value such as the scroll must feed p every frame, and when a sequence overlap has to be calculated (the delay accumulation in 02). The svg line drawing animation on scroll pattern is the representative of the second case, because the scroll position is itself p — the triangle wave in 04 merely stands in for a person scrolling, and on a real page the scroll value drops straight into that seat.
Scene 02 sits between the two: pairing the strokes with path.animate() hands delay management to the engine and reads progress back through getComputedTiming(). The Web Animations API behind it starts at Chrome 84, Firefox 75, Safari 14, Edge 84 and iOS 13.4, and the wider scroll story is written up separately in the scroll-driven animations guide.
Support is generous. SVG itself dates back to Chrome 4, Firefox 3, Safari 4, Edge 12 and iOS 8, and getTotalLength, getPointAtLength and stroke-dasharray sit so close to the SVG core that caniuse carries no separate entry for them, which is why this post says no more than that Safari has supported them for a long time. prefers-reduced-motion starts at Chrome 74, Firefox 63, Safari 11, Edge 79 and iOS 10.3.
Where Line Drawing Breaks — Stroke Attribute Inheritance, Lengths Skewed by a Scaled viewBox and Stroke Widths Warped by vector-effect
getTotalLength Returns a Value Only After the Element Is Attached
A path not yet attached cannot be flattened by the browser, so no value comes back. Instead of measuring through an offscreen path outside the viewport, these scenes attach a temporary SVG with the same viewBox inside a visibility:hidden probe box, measure it, and detach — all nine scenes measure through the same helper.
When the viewBox Changes, the Probe Must Receive the Same One
Scene 02 narrows its viewBox to zoom in on the strokes, and getPointAtLength coordinates stay in the path's own coordinate system, so they remain usable on screen as they are — but if the probe copy does not receive the same viewBox, the lengths and the coordinates drift apart. A bug where the drawing landed shifted this way appeared once during the build.
A Negative dashoffset Is a Feature, Not a Bug
The streaming dashes in 03 hold dashoffset at −p×L so they flow with the traveler, and the reverse arrow in 09 runs from −L to 0 to draw the path backward. A negative offset pushes the pattern forward along the path by the standard definition, so it is a direction expression to reach for, not a glitch to remove.
The Shorthand animation Property Deletes the Delay
The CSS shorthand animation resets delay to 0, and a sequence delay can vanish without a sound — giving the delay through the Web Animations API or the individual animation-delay property removes the trap entirely.
A Line Alone Looks Thin on Screen
Line drawing is narrow by nature, so accumulated area comes out low. Spreading the same progress into bars, gauges, arc faces and moving dots raises the area without touching the logic, which lifted these scenes from the 4 to 10% range up to 10.0 through 17.8%.
Two attribute facts complete the picture. A CSS stroke-dasharray declaration overwrites the value written as an SVG attribute, so fixing only one side leaves them out of step, and vector-effect: non-scaling-stroke detaches only the stroke width from the scale while leaving the length and the offset arithmetic untouched. The svg path animation examples you meet on the web differ mostly in how they pick these four values, and once the meanings are clear, the output of a generator-style tool becomes something you can adjust by hand.
Download the nine scenes as HTML, CSS and JS, plus the React version and the editing files, from the card below, and unzip it with the password zyqdmnhk.
How Much Does the Feel Shift When the Total Length, the Duration and the Delays Change — Sequence Gaps, Easing and Start Direction Compared
| Name | Value changed | Feel |
|---|---|---|
| Wider sequence gaps | 02 STAGGER_MS 240 → 600 | Stroke starts spread to 0, 600, 1200, 1800 and 2400ms, the rest before the last stroke grows long and one letter reads as several strokes (at 240 the last start is 1170ms with the end at 2847ms, and at 120 the signature flows out at once) |
| A stronger hand-drawn wobble | 06 DISTURB_PX 1.5 → 4 | The slip at every vertex widens 2.7 times into a pen gone over the paper twice — the vertices (60,128), (160,30) and (260,128) shift to 60.7,129.7, 157.2,26.2 and 260.0,126.2 within ±4, while 0.5 comes close to a clean ink line |
| A steeper scroll mapping | 04 MAP_RANGE 1.0 → 0.5 | The whole line draws within half a screen of scroll and feels quick to respond — the knob shares the same p, so switching presets only looks like the knob sped up |
All three can be changed in place with the left and right arrow keys. Because one value fans out into several expressions, moving STAGGER_MS moves the gauge heights and the chart spans with it, and moving DISTURB_PX scales the 36-point wobble field by the same factor.
One Finished Picture Under Reduced Motion — Accessibility That Reads the Drawing Progress as a Sentence
Every scene draws itself on a timetable or the scroll, so it plays through without input. The keyboard offers Space and Enter for pause (the button carries aria-pressed), R to restart and the arrow keys to step presets, and when the tab hides, a visibilitychange listener stops the scene and resumes it where it left off on return.
Announcements are spent sparingly. The status line, which changes every frame, is set to aria-live="off" and never read out, and the spoken sentence in the role="status" region is refreshed only on pause and preset changes. The pause control is a <button>, the scene box carries role="img" with an aria-label, and scene 07 reports its state through aria-checked.
When reduced motion turns on, the SCSS switches every animation off with .ez * { animation: none !important } and the JS draws a single finished frame — at that moment document.getAnimations().length measured 0.
        if (reduced) {
            // reduced motion — every animation is off and the scene is a single finished frame (draws the final build frame)
            statusP.textContent = 'Reduced motion on · finished state';
            readB.textContent = 'Showing the finished drawing at once instead of the drawing process';
            doneP.textContent = readB.textContent;
            cfg.frame(1e9);
        }
SVG Line Drawing FAQ — Does CSS Alone Work, Unknown Lengths, Icon Fonts and Responsive Breakage
Can I draw a line with CSS alone, like the svg path animation codepen demos do?
Drawing one stroke in a set time is CSS territory — move dasharray and dashoffset through keyframes and it is done. The total length has to be known in advance, so the first measurement needs one call to getTotalLength from JS; scroll linking and sequence overlaps need a per-frame value, which puts them on the JS side.
What should I do when the path's total length is unknown?
Attach the element and measure with getTotalLength() — no value comes back before attachment, which is why this post measures through a visibility:hidden probe box. Using the browser's figure directly, like the 440.9px ring circumference, keeps the length following along when you later edit the curvature or the stroke width.
What do I fix first when line drawing slips on a responsive layout?
Match the viewBox of the main SVG and the probe first — coordinates stay in the path's own system, so with the same viewBox in both, nothing drifts regardless of screen size. Next check whether a CSS stroke-* declaration is overwriting the attribute values, and treat multi-piece dasharrays like the both-ends drawing in 09 with care, since their rendering differs across browsers and belongs in a real one before shipping.
Reference links: getTotalLength · getPointAtLength · stroke-dasharray · prefers-reduced-motion
You might also like
 TransitionsImage Reveal Effect CSS — 9 Canvas-computed Wipes
 Transitions9 CSS Glitch Effect Transitions (No Codepen)
 TransitionsCSS Divider: 9 Demos That Compute the Line Shape
 TransitionsFlipbook Animation: 9 Canvas Page Flip Scenes
 Transitions9 mega menu ui patterns, link list to site map
 Transitions9 Filter UI Patterns (Panel Slide to Chip Remove)
 TransitionsCart Drawer UI Patterns: 9 Motion Techniques
 TransitionsContext Menu UI: 9 Right-Click Menu Patterns
 TransitionsCSS Bottom Navigation Bar: 9 Transition Patterns
 TransitionsCarousel Slider UI Design — 9 Transitions